Official outlook comparison — ONDJ 2026/27
Season: ONDJ 2026/27 (1 Oct 2026 – 31 Jan 2027) · Area: ONDJ R3 (Deyr) rainfall domain
Official outlooks from ICPAC and the Ethiopian Meteorology Institute (EMI), compared with this platform's forecast, using only values a person has checked against the published figures. The comparison describes agreement between outlooks, not which is more accurate.
Key findings — ONDJ R3 (Deyr) rainfall domain
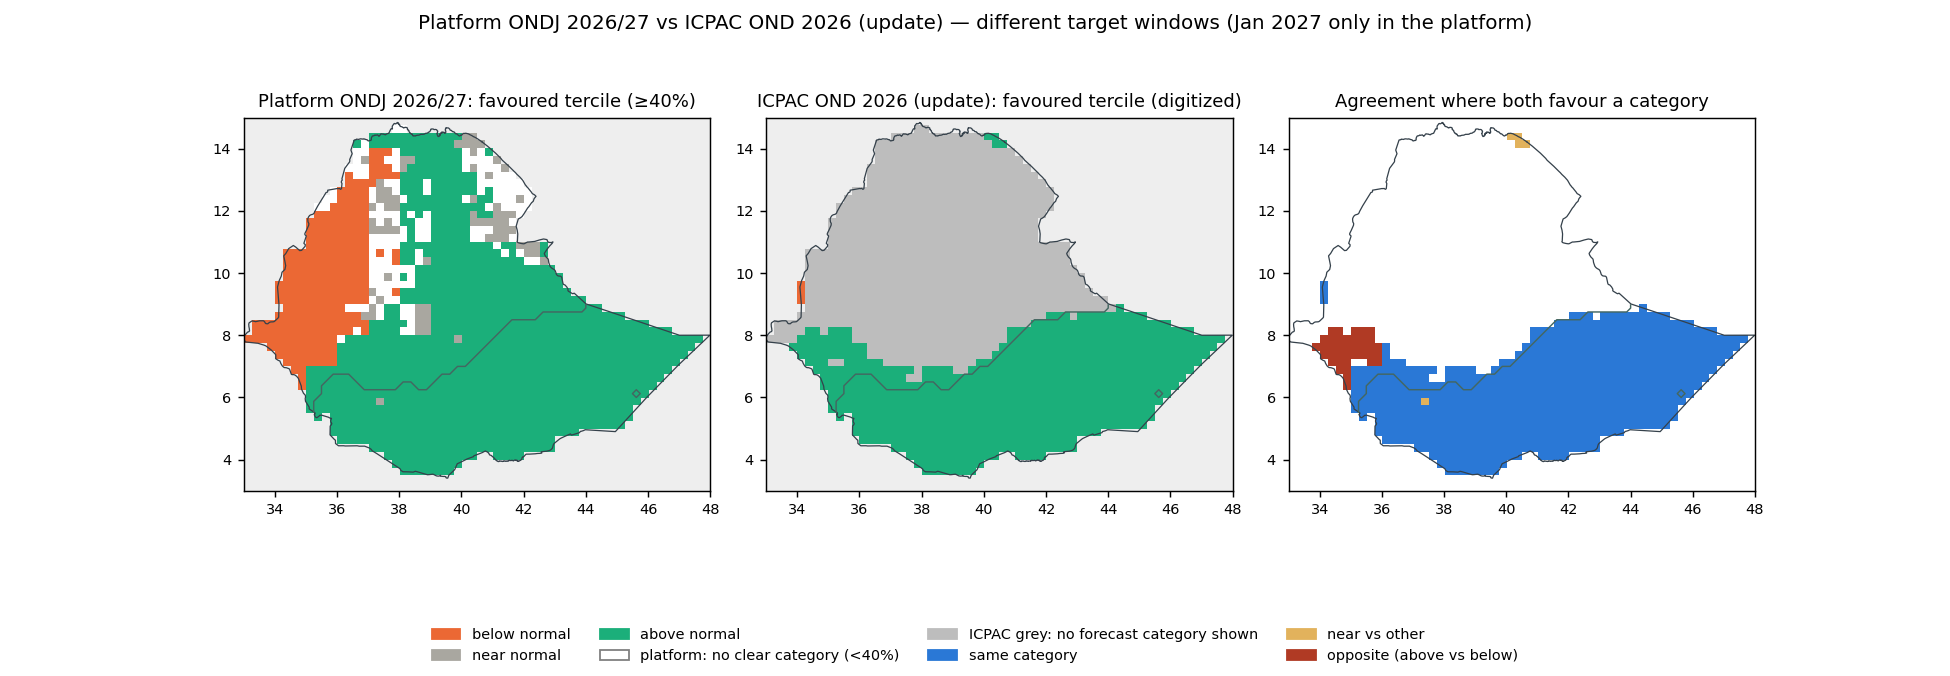
- ICPAC — ONDJ R3 (Deyr) rainfall domain. Category agreement of 99.8% within the compared area, which covers >99% of the analysed domain. Predominant category in both: above normal. Periods differ (Oct 2026–Dec 2026 vs Oct 2026–Jan 2027).Evidence: Platform map (domain) · Platform data (NetCDF) · Official figure · Original file · Comparison map · Source record
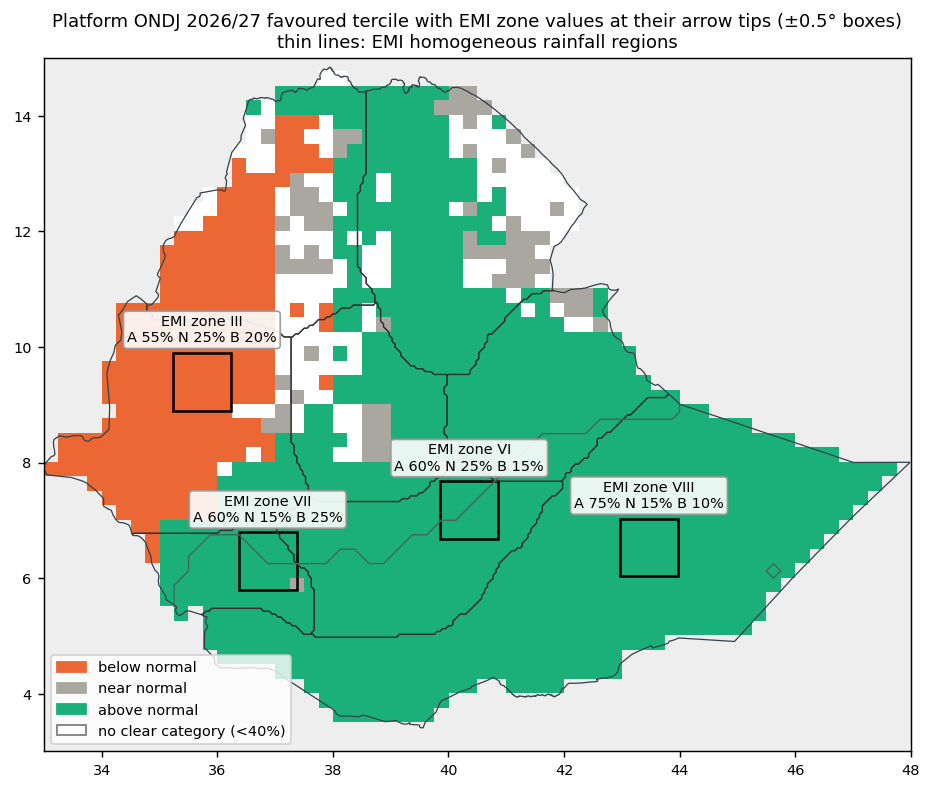
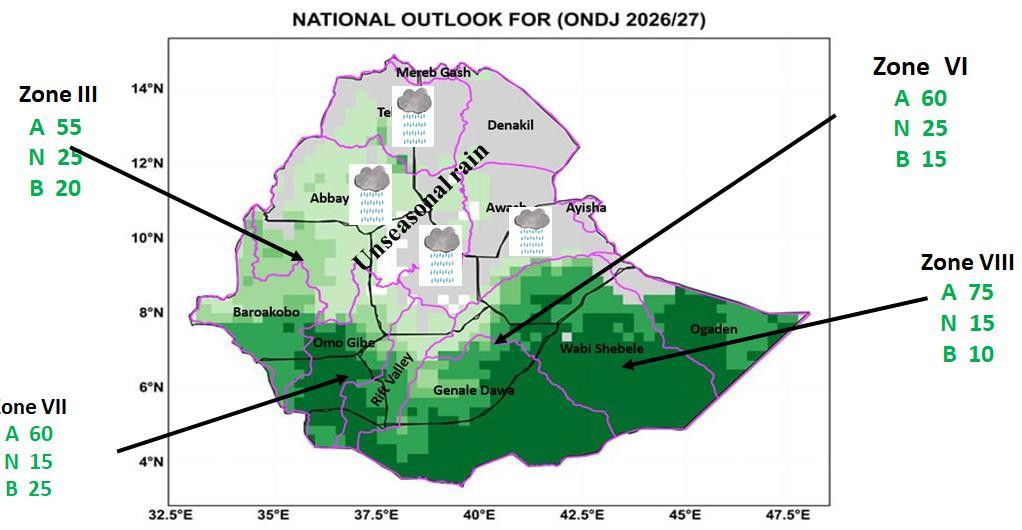
- EMI — sampled neighbourhoods near the zone arrows in the domain. Both favour above normal near the arrows of zones VI, VII and VIII. The samples near zones VI and VII only partly overlap the domain (44% and 69% of sample cells); the values describe the whole sample. Sampled neighbourhoods (±0.5°), not complete EMI zones.Evidence: Official figure · Original PDF page · Platform map (All Ethiopia) · Platform data (NetCDF) · Source record
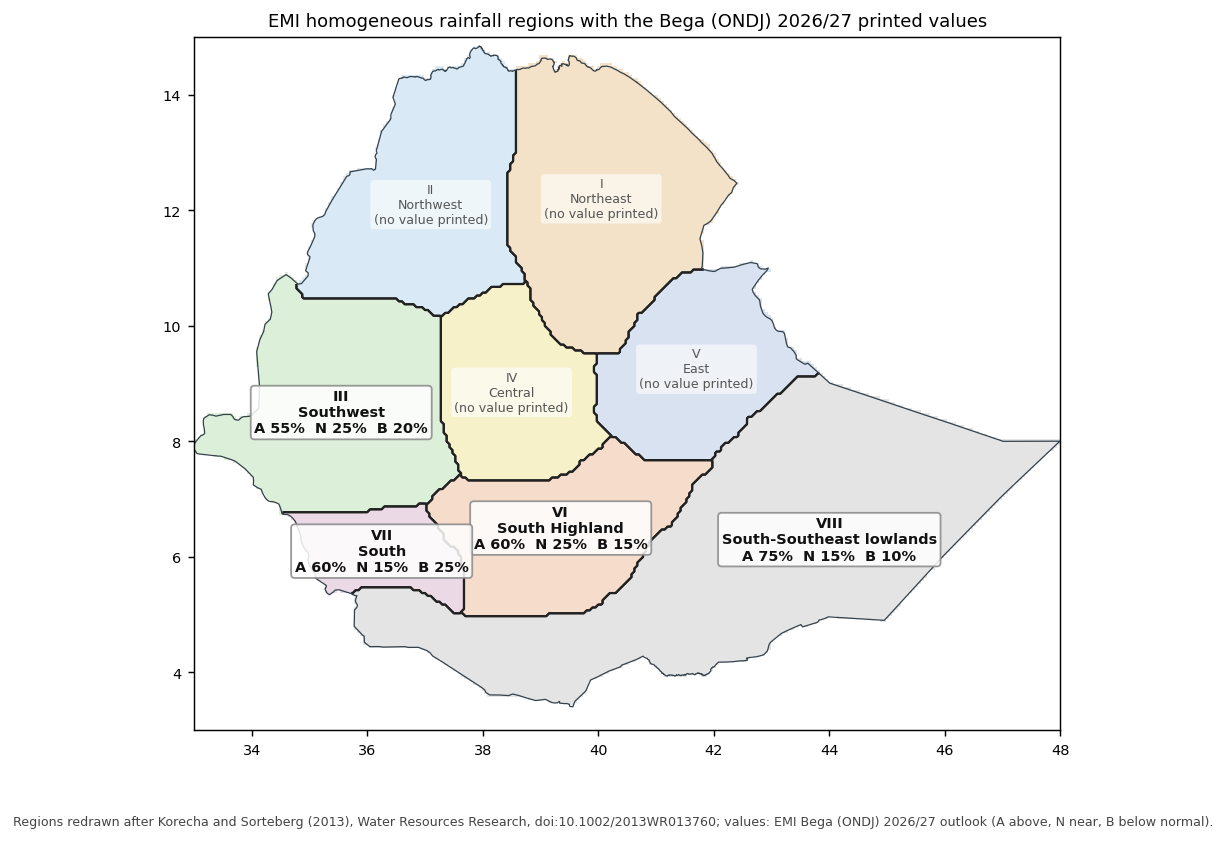
- EMI — whole zones (rainfall regions). Platform area mean of local probabilities over each EMI zone, below / near / above: zone VI (South Highland): both favour above normal, platform 19% / 25% / 56% over the whole zone (66% of it in the domain); zone VII (South): both favour above normal, platform 22% / 26% / 52% over the whole zone (71% of it in the domain); zone VIII (South-Southeast lowlands): both favour above normal, platform 16% / 25% / 59% over the whole zone (99% of it in the domain). Zone boundaries: EMI homogeneous rainfall regions as published in 2013 (Korecha and Sorteberg), assumed unchanged.Evidence: Official figure · Original PDF page · Platform map (All Ethiopia) · Platform data (NetCDF) · Source record
- Robustness of the extraction. The EMI category relationships are stable under the tested location and neighbourhood changes (100 variants per zone: half-widths 0.25–1.0°, arrow-tip shifts up to ±0.5°). With the ICPAC map as digitized and shifted by one source pixel in each direction, the All Ethiopia category agreement stays between 93.6% and 94.2%. With the ICPAC map as digitized and shifted by one source pixel in each direction, the ONDJ R3 (Deyr) rainfall domain category agreement stays at 99.8%. These are bounded sensitivity checks of the extraction, not statistical confidence intervals; exact EMI zone comparisons remain unavailable.
| Area | Compared area (share of the analysed area) | Category agreement within it | Opposite categories within it |
|---|---|---|---|
| All Ethiopia (national context) | 46% | 93.7% | 5.6% |
| ONDJ R3 (Deyr) rainfall domain | >99% | 99.8% | 0.0% |
| Location | Official | Platform over the whole zone | Platform near the arrow (±0.5°) | Relationship near the arrow | Evidence |
|---|---|---|---|---|---|
| Zone VIII Entire sample in the domain (arrow sample) | 10% / 15% / 75% | 16% / 25% / 59% Same category · South-Southeast lowlands region · 99% of the zone in the selected domain | 16% / 30% / 54% | Same category | Platform map (domain) · Platform data (NetCDF) · Official figure · Original PDF page |
| Zone VII Partly overlaps the domain — 69% of sample cells (arrow sample) | 25% / 15% / 60% | 22% / 26% / 52% Same category · South region · 71% of the zone in the selected domain | 20% / 22% / 58% | Same category | Platform map (All Ethiopia) · Platform data (NetCDF) · Official figure · Original PDF page |
| Zone VI Partly overlaps the domain — 44% of sample cells (arrow sample) | 15% / 25% / 60% | 19% / 25% / 56% Same category · South Highland region · 66% of the zone in the selected domain | 19% / 24% / 57% | Same category | Platform map (All Ethiopia) · Platform data (NetCDF) · Official figure · Original PDF page |
| Zone III Outside the domain (national context) (arrow sample) | 20% / 25% / 55% | 48% / 25% / 27% Opposing categories · Southwest region · 0% of the zone in the selected domain | 53% / 29% / 18% | Opposing categories | Platform map (All Ethiopia) · Platform data (NetCDF) · Official figure · Original PDF page |
Platform values are area means of local probabilities. "Whole zone" uses EMI's homogeneous rainfall regions as published in 2013 (assumed unchanged for this outlook); "near the arrow" uses the ±0.5° sample around each arrow tip, also where it only partly overlaps the domain. Percentages are rounded to add up to 100%.
| Location | ICPAC (favoured category, printed interval) | Platform | Relationship | Evidence |
|---|---|---|---|---|
| Near zone VIII arrow Entire sample in the domain | Above normal 70–80% 75% of shown cells; also Above normal 80–90% (25%) | 16% / 30% / 54% | Same category | Platform map (domain) · Platform data (NetCDF) · Official figure · Original file · Comparison map |
| Near zone VII arrow Partly overlaps the domain — 69% of sample cells | Above normal 60–70% | 20% / 22% / 58% | Same category | Platform map (All Ethiopia) · Platform data (NetCDF) · Official figure · Original file · Comparison map |
| Near zone VI arrow Partly overlaps the domain — 44% of sample cells | Above normal 70–80% 31% of the sample grey (no forecast category shown) | 19% / 24% / 57% | Same category | Platform map (All Ethiopia) · Platform data (NetCDF) · Official figure · Original file · Comparison map |
| Near zone III arrow Outside the domain (national context) | no forecast category shown 100% of the sample grey (no forecast category shown) | 53% / 29% / 18% | Not comparable: ICPAC shows no forecast category here | Platform map (All Ethiopia) · Platform data (NetCDF) · Official figure · Original file · Comparison map |
| ONDJ R3 (Deyr) rainfall domain selected area | Above normal (most often 70–80%) shown on >99% of the area; <1% grey (no forecast category shown) | 16% / 26% / 58% | Same category (where both show a category) | Platform map (domain) · Platform data (NetCDF) · Official figure · Original file · Comparison map |
| All Ethiopia national context | Above normal (most often 70–80%) shown on 46% of the area; 54% grey (no forecast category shown) | 27% / 27% / 46% | Same category (where both show a category) | Platform map (All Ethiopia) · Platform data (NetCDF) · Official figure · Original file · Comparison map |
ICPAC publishes only the favoured category and its probability interval (the other two categories are not published), for 1 Oct 2026 – 31 Dec 2026; the platform covers 1 Oct 2026 – 31 Jan 2027, so the two are compared as tendencies, not as the same event. Locations are the EMI arrow-tip boxes or the digitized EMI zones; platform values are area means of local probabilities over each location or area.
National context (All Ethiopia)
- ICPAC — All Ethiopia. Category agreement of 93.6% within the compared area, which covers 46% of the analysed national area. Predominant category in both: above normal. Periods differ (Oct 2026–Dec 2026 vs Oct 2026–Jan 2027).Evidence: Platform map (All Ethiopia) · Platform data (NetCDF) · Official figure · Original file · Comparison map · Source record
- EMI — sampled neighbourhoods near the zone arrows. Opposing categories near the arrow of zone III: platform below normal, EMI above normal. Both favour above normal near the arrows of zones VI, VII and VIII. Sampled neighbourhoods (±0.5°), not complete EMI zones.Evidence: Official figure · Original PDF page · Platform map (All Ethiopia) · Platform data (NetCDF) · Source record
- EMI — whole zones (rainfall regions). Platform area mean of local probabilities over each EMI zone, below / near / above: zone III (Southwest): opposing: platform below normal, EMI above normal, platform 48% / 25% / 27%; zone VI (South Highland): both favour above normal, platform 19% / 25% / 56%; zone VII (South): both favour above normal, platform 22% / 26% / 52%; zone VIII (South-Southeast lowlands): both favour above normal, platform 16% / 25% / 59%. Zone boundaries: EMI homogeneous rainfall regions as published in 2013 (Korecha and Sorteberg), assumed unchanged.Evidence: Official figure · Original PDF page · Platform map (All Ethiopia) · Platform data (NetCDF) · Source record
Detailed interpretation
Above-normal rainfall is the predominant tendency in both outlooks over their shared displayed area in the ONDJ R3 (Deyr) rainfall domain, with localized disagreement. ICPAC shows a favoured category on >99% of the ONDJ R3 (Deyr) rainfall domain and no forecast category shown (the legend does not explain the grey areas) on <1%; where it shows one it favours above normal on 100%, most often at 70-80% and 80-90%. The platform favours above normal on >99% and below normal on 0% of the ONDJ R3 (Deyr) rainfall domain. There is category agreement of 99.8% within the compared area, which covers >99% of the analysed domain. ICPAC publishes only the favoured category and its probability interval, so probabilities are not differenced. The official outlook covers Oct 2026–Dec 2026 and the platform Oct 2026–Jan 2027 (Jan 2027 only in the platform), so this compares spatial tendencies, not probabilities for the same seasonal event.Evidence: Platform map (domain) · Platform data (NetCDF) · Official figure · Original file · Comparison map
The platform favours below-normal rainfall near the arrow of EMI zone III, while the EMI outlook favours above-normal rainfall. This indicates disagreement in the favoured rainfall category. EMI prints 20% / 25% / 55% (below / near / above); the platform's area mean of local probabilities in the sampled neighbourhood is 53% / 29% / 18%. Over the whole zone (the EMI Southwest rainfall region), the platform area mean is 48% / 25% / 27%: opposing categories.Evidence: Platform map (All Ethiopia) · Platform data (NetCDF) · Official figure · Original PDF page
Both outlooks favour wetter-than-normal conditions near the arrow of EMI zone VI. EMI prints 15% / 25% / 60% (below / near / above); the platform's area mean of local probabilities in the sampled neighbourhood is 19% / 24% / 57%. Over the whole zone (the EMI South Highland rainfall region), the platform area mean is 19% / 25% / 56%: same category.Evidence: Platform map (All Ethiopia) · Platform data (NetCDF) · Official figure · Original PDF page
Both outlooks favour wetter-than-normal conditions near the arrow of EMI zone VII. EMI prints 25% / 15% / 60% (below / near / above); the platform's area mean of local probabilities in the sampled neighbourhood is 20% / 22% / 58%. Over the whole zone (the EMI South rainfall region), the platform area mean is 22% / 26% / 52%: same category.Evidence: Platform map (All Ethiopia) · Platform data (NetCDF) · Official figure · Original PDF page
Both outlooks favour wetter-than-normal conditions near the arrow of EMI zone VIII. EMI prints 10% / 15% / 75% (below / near / above); the platform's area mean of local probabilities in the sampled neighbourhood is 16% / 30% / 54%. Over the whole zone (the EMI South-Southeast lowlands rainfall region), the platform area mean is 16% / 25% / 59%: same category.Evidence: Platform map (All Ethiopia) · Platform data (NetCDF) · Official figure · Original PDF page
For every EMI zone, the platform value near the arrow is the area mean of local probabilities within ±0.5° of the arrow tip, not the complete EMI zone: the figure publishes no zone boundaries and no reference period, so exact zone probability differences are not calculated.
National context: Above-normal rainfall is the predominant tendency in both outlooks over their shared displayed area in Ethiopia, with localized disagreement. ICPAC shows a favoured category on 46% of Ethiopia and no forecast category shown (the legend does not explain the grey areas) on 54%; where it shows one it favours above normal on >99%, most often at 70-80% and 80-90%. The platform favours above normal on 69% and below normal on 16% of Ethiopia. There is category agreement of 93.6% within the compared area, which covers 46% of the analysed national area; opposite categories (above vs below) on 6% of the compared area. ICPAC publishes only the favoured category and its probability interval, so probabilities are not differenced. The official outlook covers Oct 2026–Dec 2026 and the platform Oct 2026–Jan 2027 (Jan 2027 only in the platform), so this compares spatial tendencies, not probabilities for the same seasonal event.Evidence: Platform map (All Ethiopia) · Platform data (NetCDF) · Official figure · Original file · Comparison map
Not calculated: rainfall-anomaly differences, because no official rainfall-amount anomaly product was found in the checked ICPAC and EMI products; which forecast is more accurate, because that needs observations and a separate verification design (see Verification); same-event probability differences, because the target windows or spatial supports differ and ICPAC publishes only favoured-category intervals.
Sources, extraction review and methods
ICPAC: OND 2026 (update)
Extraction reviewed Checked 2026-10-09: unchanged
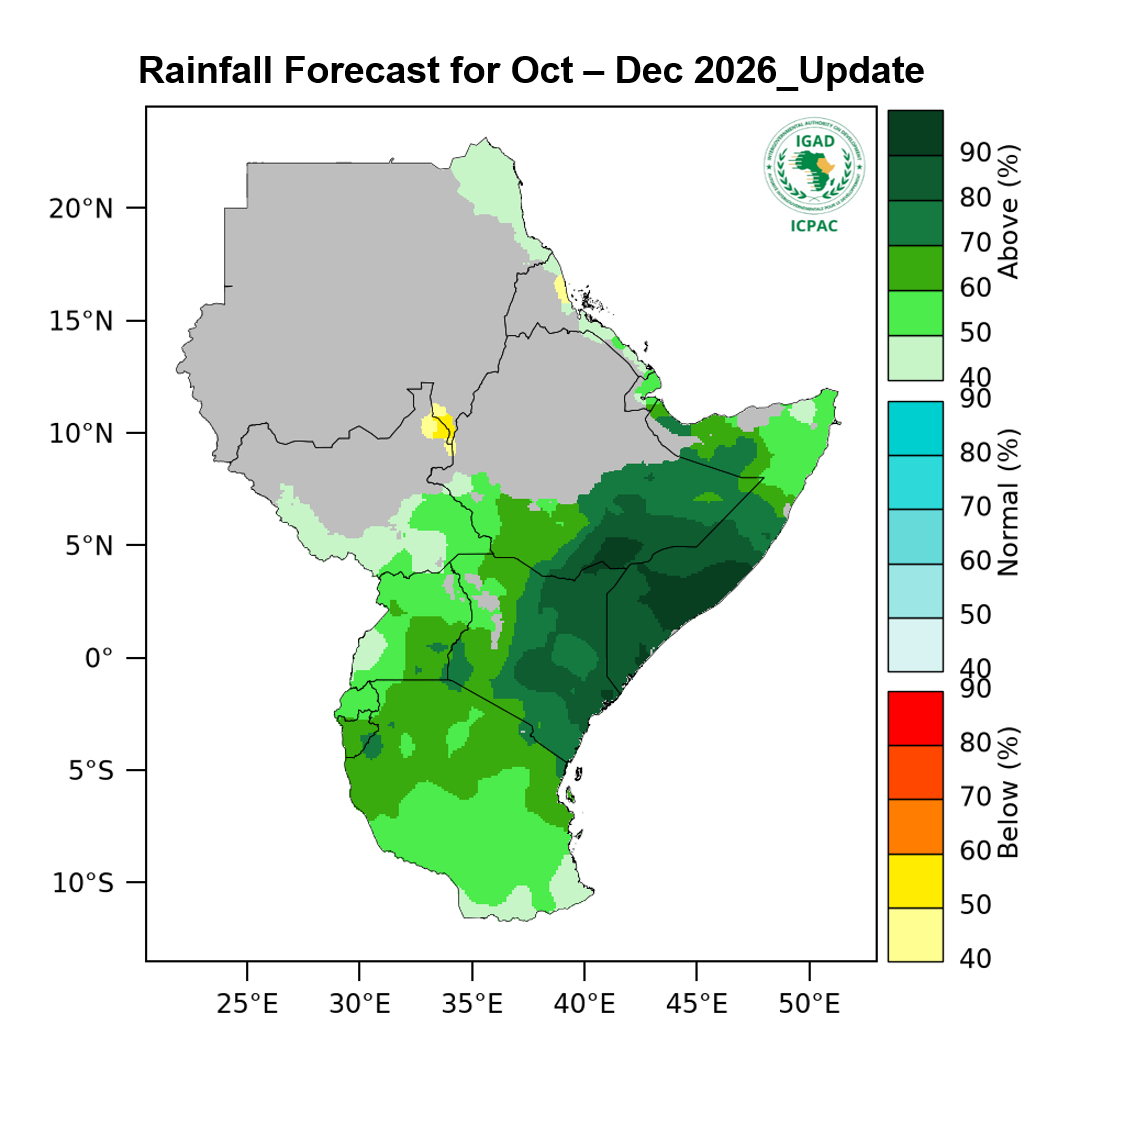
Above-normal rainfall is likely across most of the region, with the highest probabilities over north-eastern Kenya, central to southern Somalia and south-eastern Ethiopia.
Across much of the remaining region, the probability of above-normal rainfall is generally in the range of 50–70%.
— ICPAC, detail page, rainfall forecast item
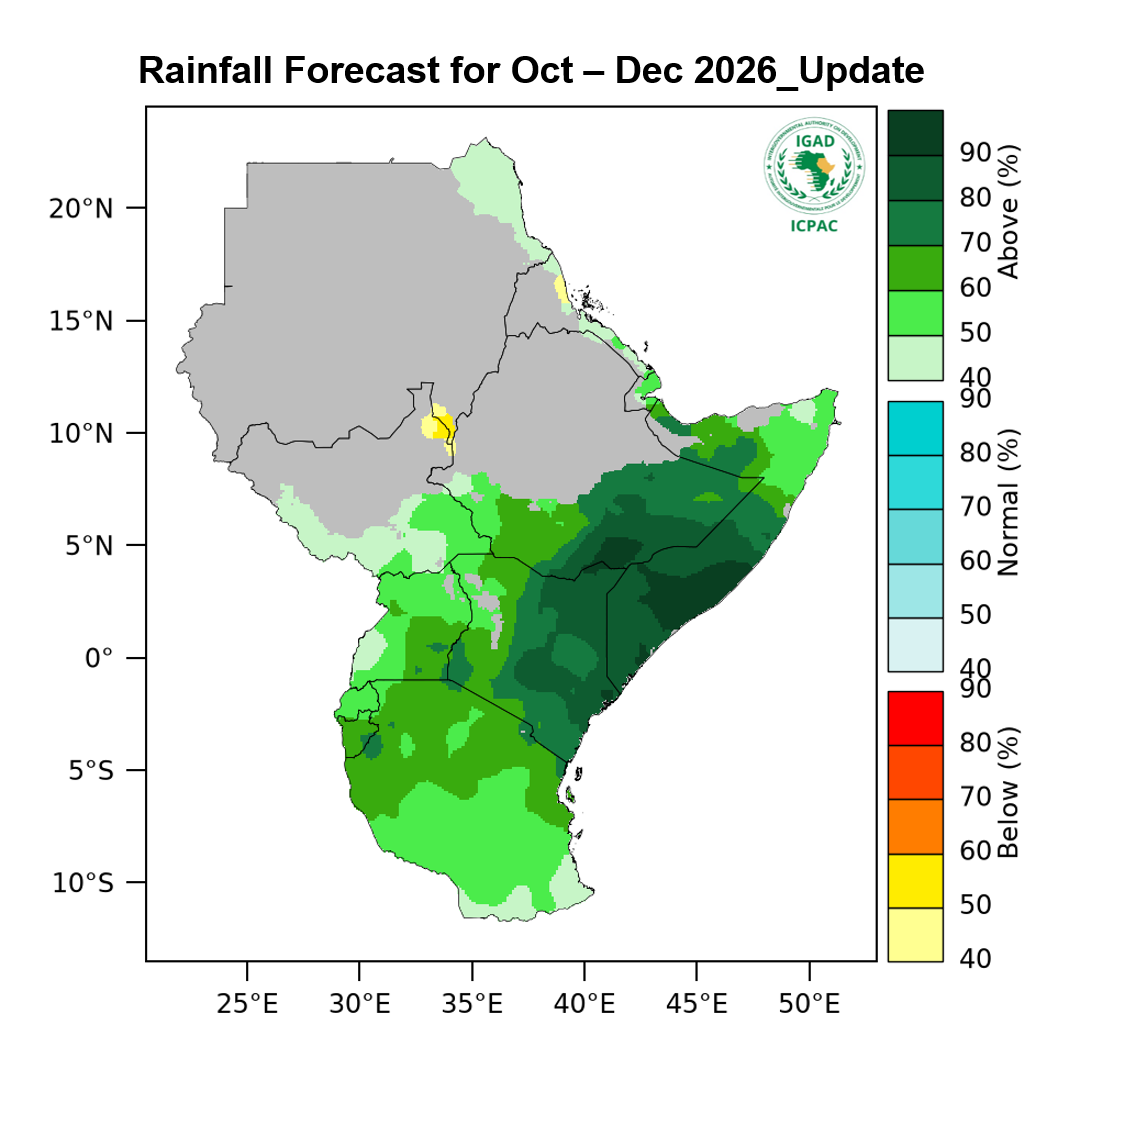
EMI: Bega (ONDJ) 2026/27
Extraction reviewed Checked 2026-10-09: unchanged; a matching page without a document yet was skipped (Bega 2026/27 Seasonal Climate Forecast)
October: Humid to wet conditions across southern and southwestern catchments Baro-Akobo, Wabi Shebelle, Genale Dawa, Ogaden, and Abay support initial surface water accumulation.
November: Moisture shifts southward; wet to very wet conditions continue in Genale Dawa, Wabi Shebelle, Baro- Akobo, Ogaden, and parts of Abay Rift Valley, while northern areas dry out.
December: Dry to arid conditions dominate northern, central, and eastern basins Afar-Denakil, Aysha, middle upper Abay, Tekeze, and Awash. Sub-humid to wet levels persist in Omo-Gibe, Rift Valley, Baro-Akobo, Genale Dawa, Wabi Shebelle, and middle lower Ogaden.
January: Arid conditions expand across most northern, central, and eastern catchments. Sub-humid to wet conditions remain confined to Omo-Gibe, Rift Valley, and upper Genale Dawa.
— EMI, PDF page 21
| Comparison | Where | Status | Why |
|---|---|---|---|
| Official probabilities shown | EMI zone III | available | |
| Favoured-category relationship | EMI zone III | available | reviewed visual (arrow-tip neighbourhood) |
| Platform mean over the official zone | EMI zone III | available | EMI homogeneous rainfall regions as published in 2013 (digitized) |
| Probability difference for the same event | EMI zone III | unavailable | the zone boundary is not published with the figure; the official reference period is not stated |
| Official probabilities shown | EMI zone VI | available | |
| Favoured-category relationship | EMI zone VI | available | reviewed visual (arrow-tip neighbourhood) |
| Platform mean over the official zone | EMI zone VI | available | EMI homogeneous rainfall regions as published in 2013 (digitized) |
| Probability difference for the same event | EMI zone VI | unavailable | the zone boundary is not published with the figure; the official reference period is not stated |
| Official probabilities shown | EMI zone VII | available | |
| Favoured-category relationship | EMI zone VII | available | reviewed visual (arrow-tip neighbourhood) |
| Platform mean over the official zone | EMI zone VII | available | EMI homogeneous rainfall regions as published in 2013 (digitized) |
| Probability difference for the same event | EMI zone VII | unavailable | the zone boundary is not published with the figure; the official reference period is not stated |
| Official probabilities shown | EMI zone VIII | available | |
| Favoured-category relationship | EMI zone VIII | available | reviewed visual (arrow-tip neighbourhood) |
| Platform mean over the official zone | EMI zone VIII | available | EMI homogeneous rainfall regions as published in 2013 (digitized) |
| Probability difference for the same event | EMI zone VIII | unavailable | the zone boundary is not published with the figure; the official reference period is not stated |
| Mapped category agreement | All Ethiopia | available | reviewed digitization |
| Mapped category agreement | ONDJ R3 (Deyr) rainfall domain | available | reviewed digitization |
| Probability difference for the same event | — | unavailable | the target periods differ; only the favoured category and its interval are published |
| Rainfall anomaly difference | — | unavailable | no official rainfall-amount anomaly product was found in the checked products |
| Which forecast is more accurate | — | unavailable | needs observations and a separate verification design (see Verification) |
- Area means are area-weighted means of local grid-cell probabilities, not probabilities of area-mean rainfall.
- Favoured category: for the platform and EMI, the untied leading tercile where it reaches 40% (the map display rule), otherwise no clear category; for ICPAC, the dominant category ICPAC printed, including its 33–40% intervals.
- ICPAC covers Oct–Dec 2026 and the platform Oct–Jan 2027: a probability for one period cannot be built by averaging monthly probabilities of the other, so they are compared only as spatial tendencies.