Amount and range shadow (EMOS)
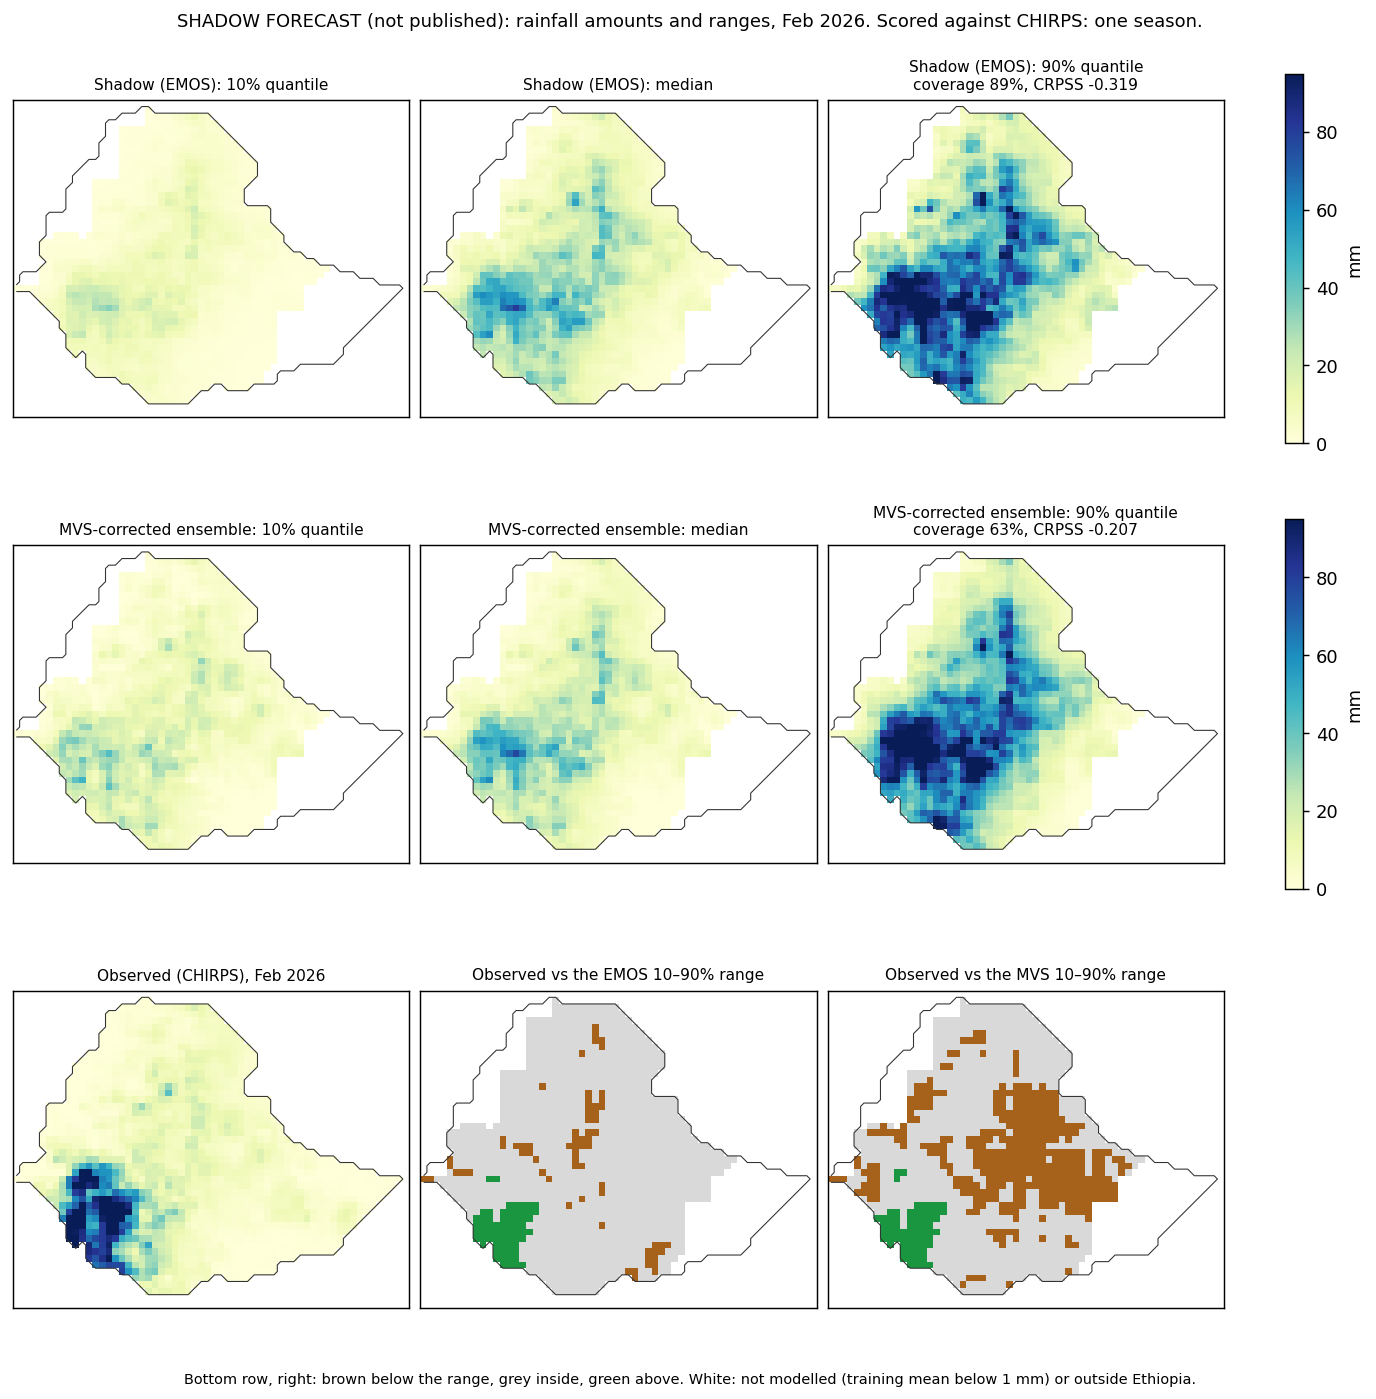
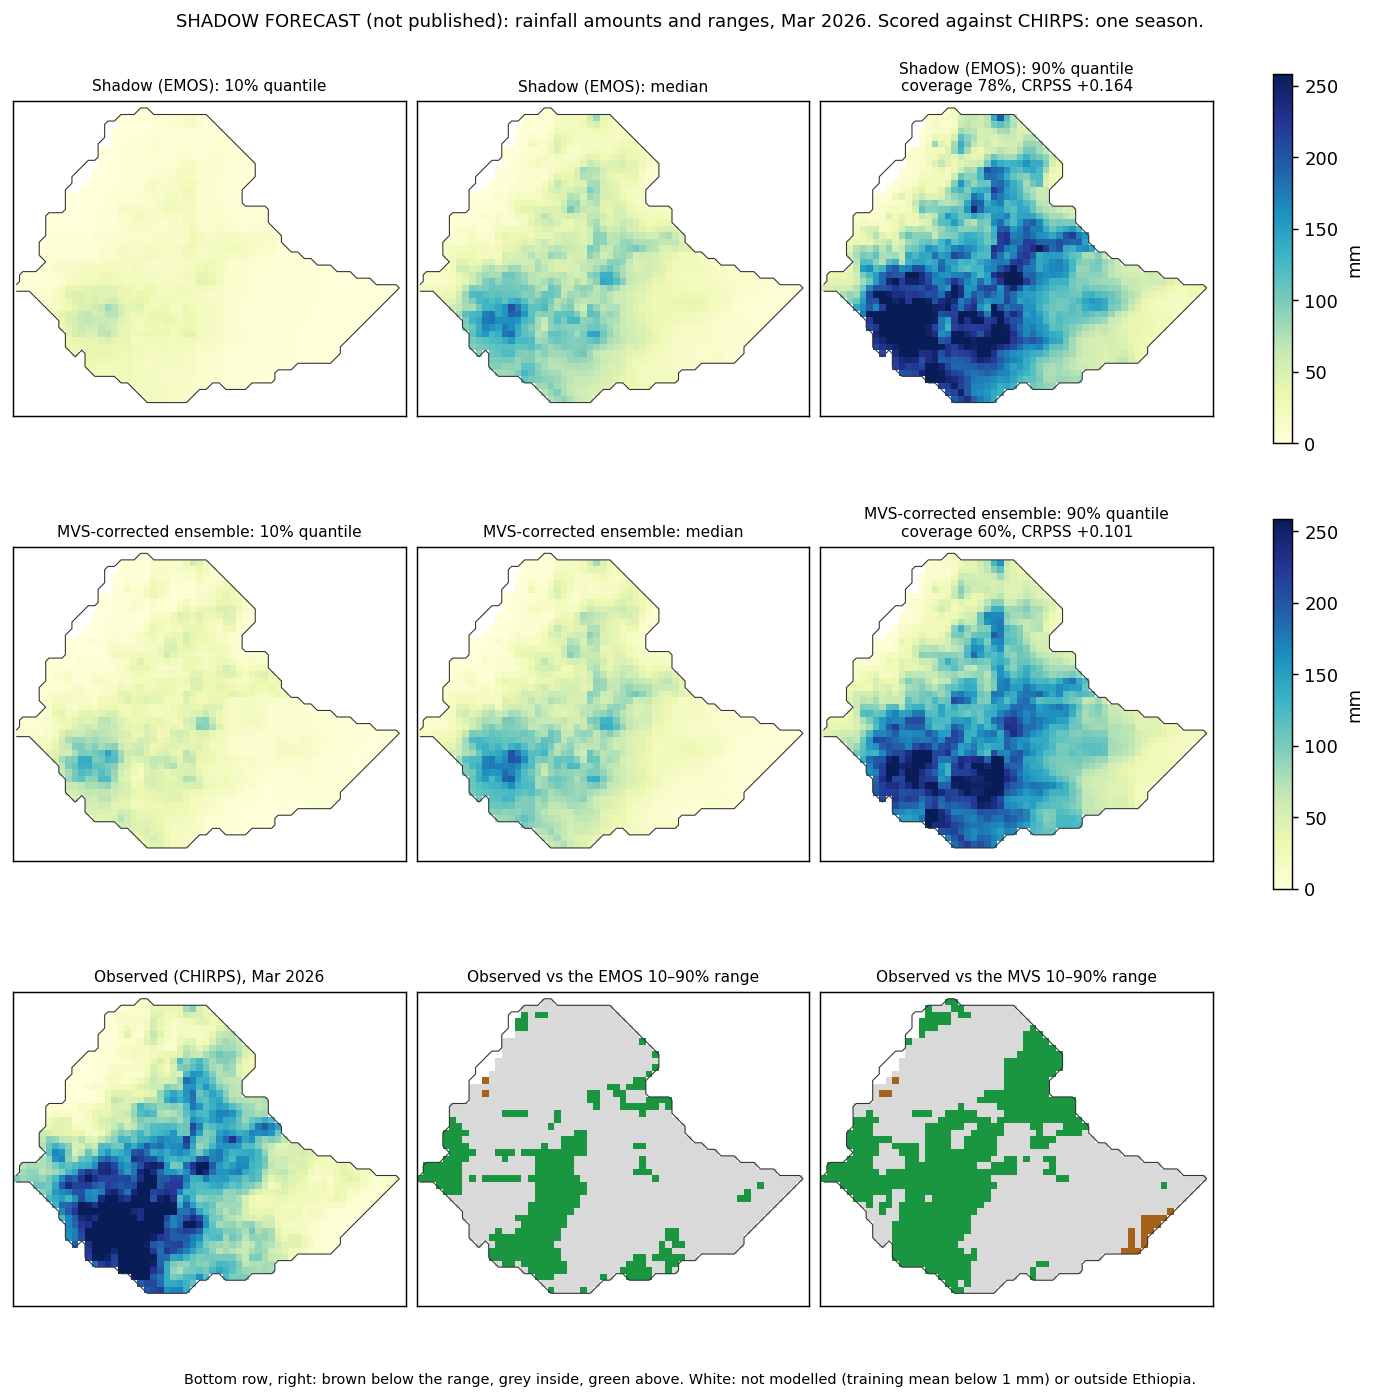
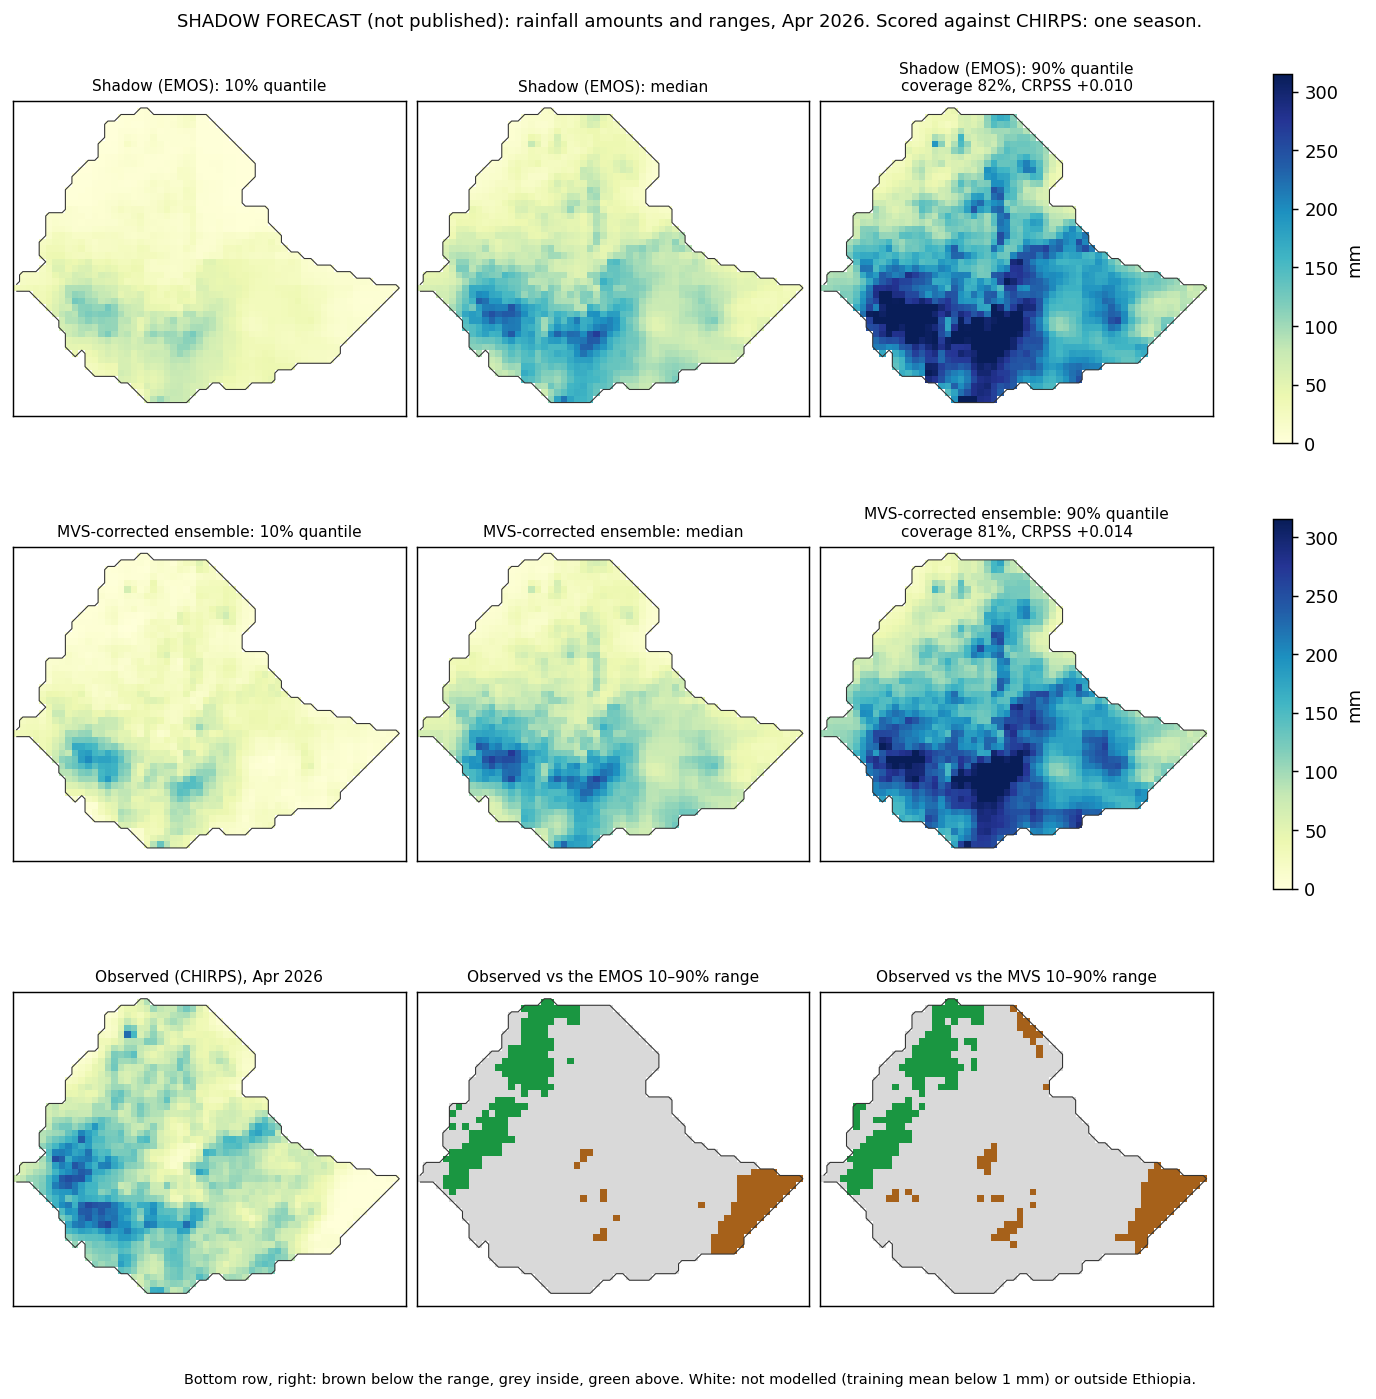
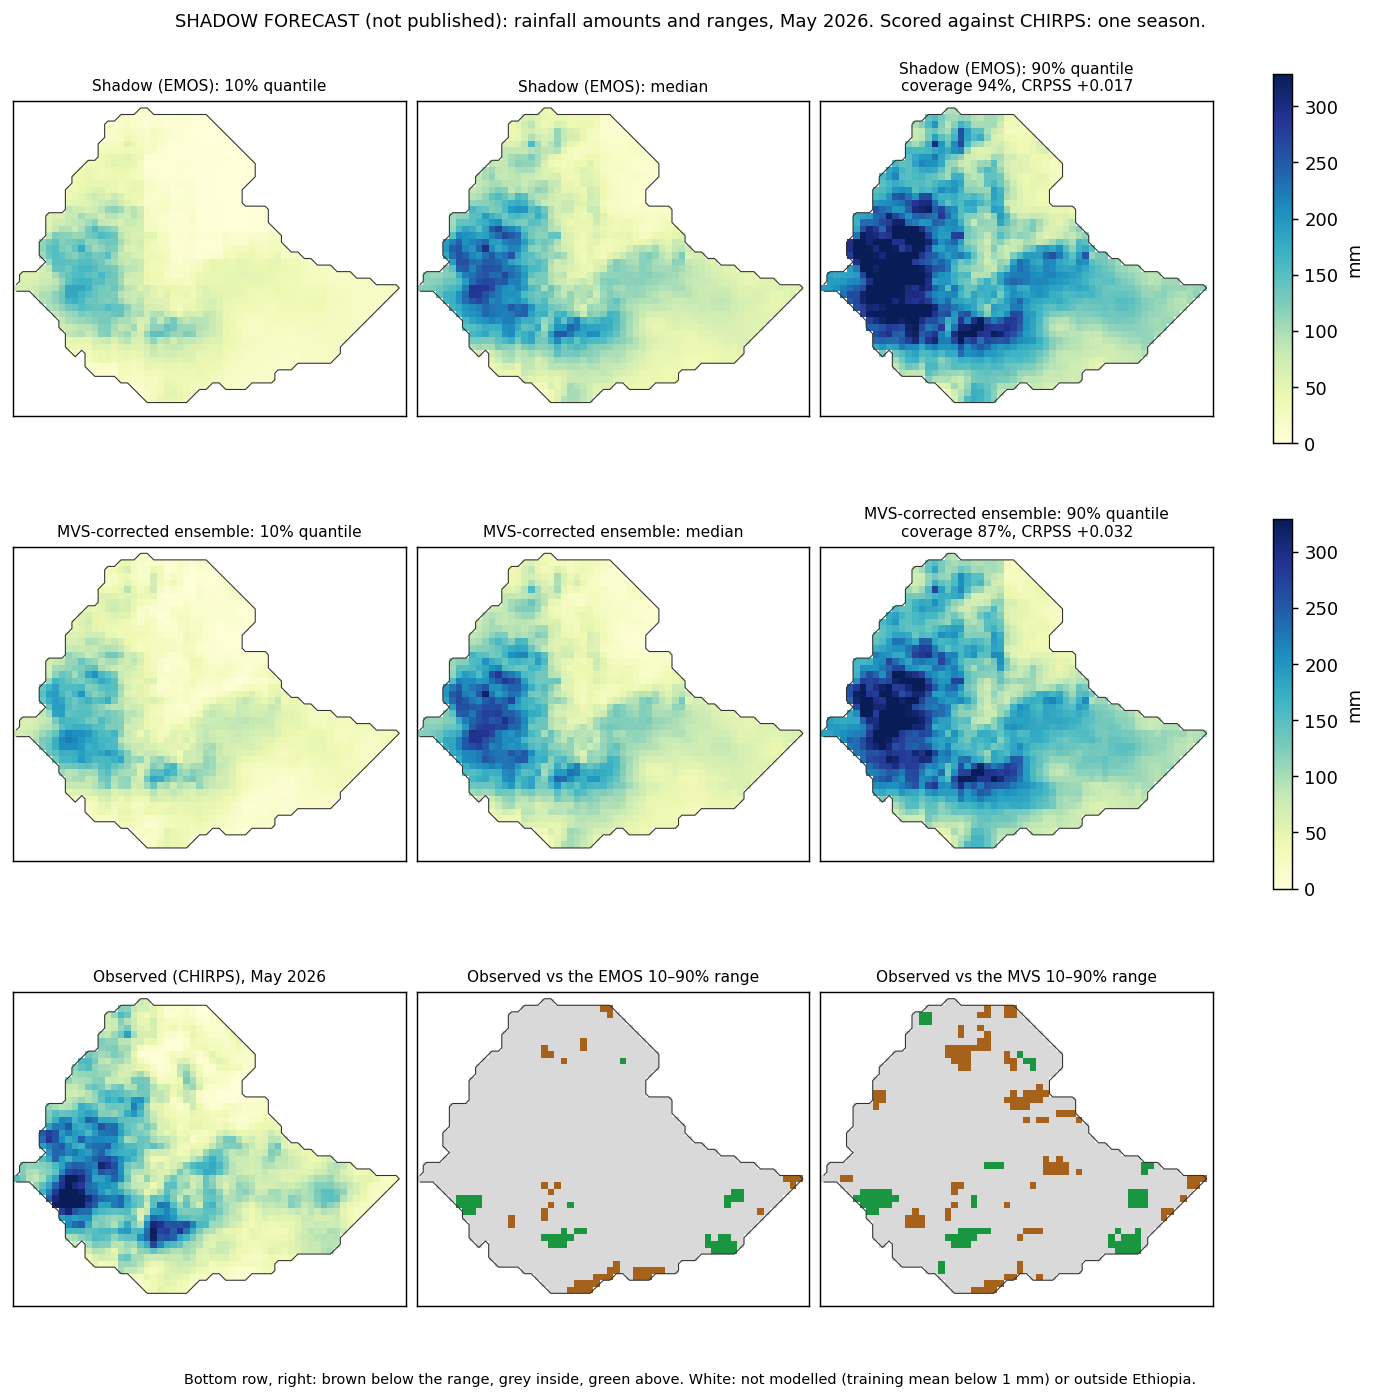
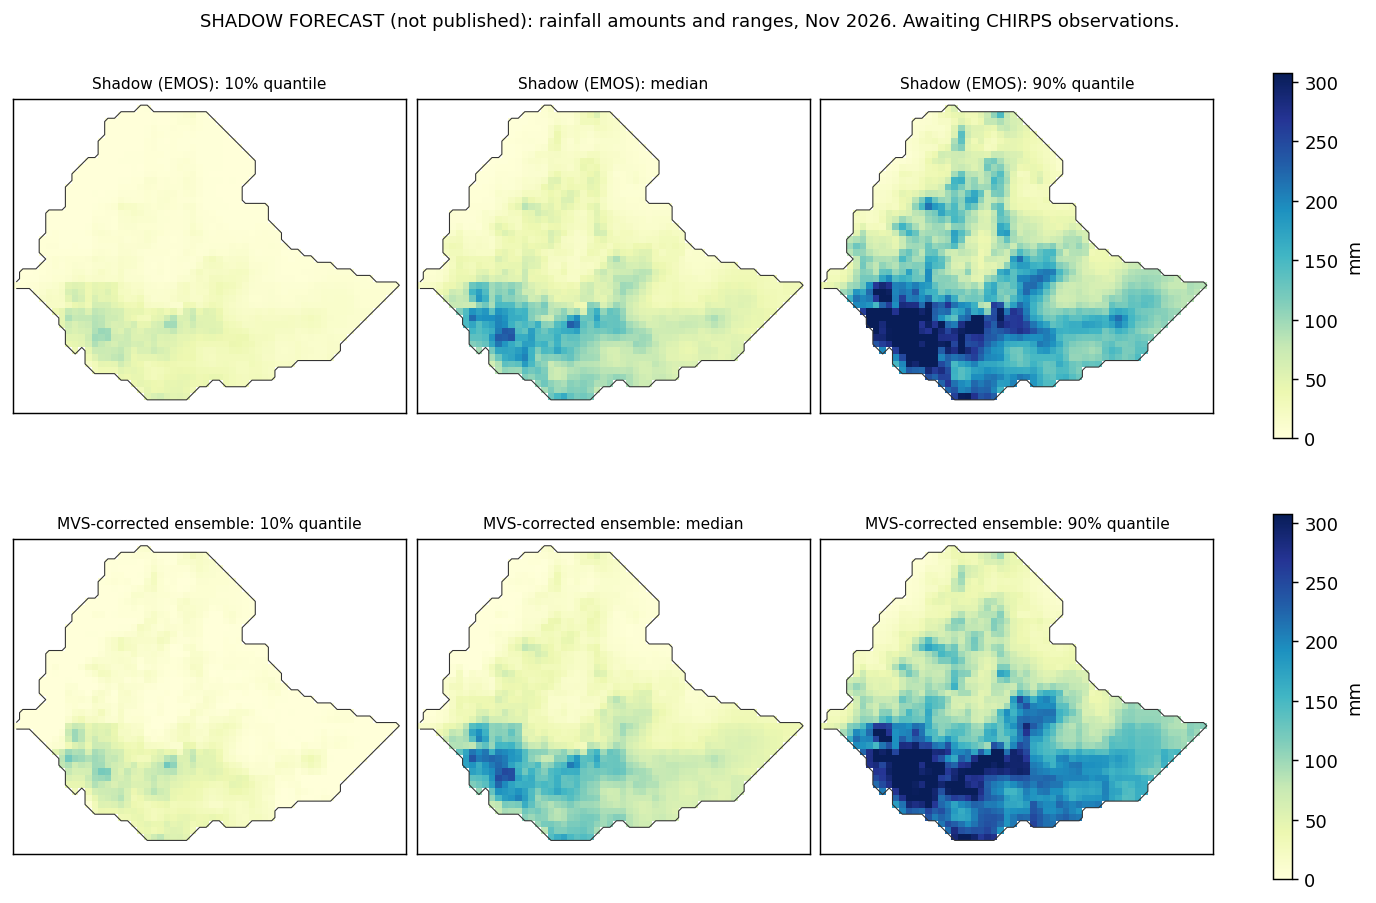
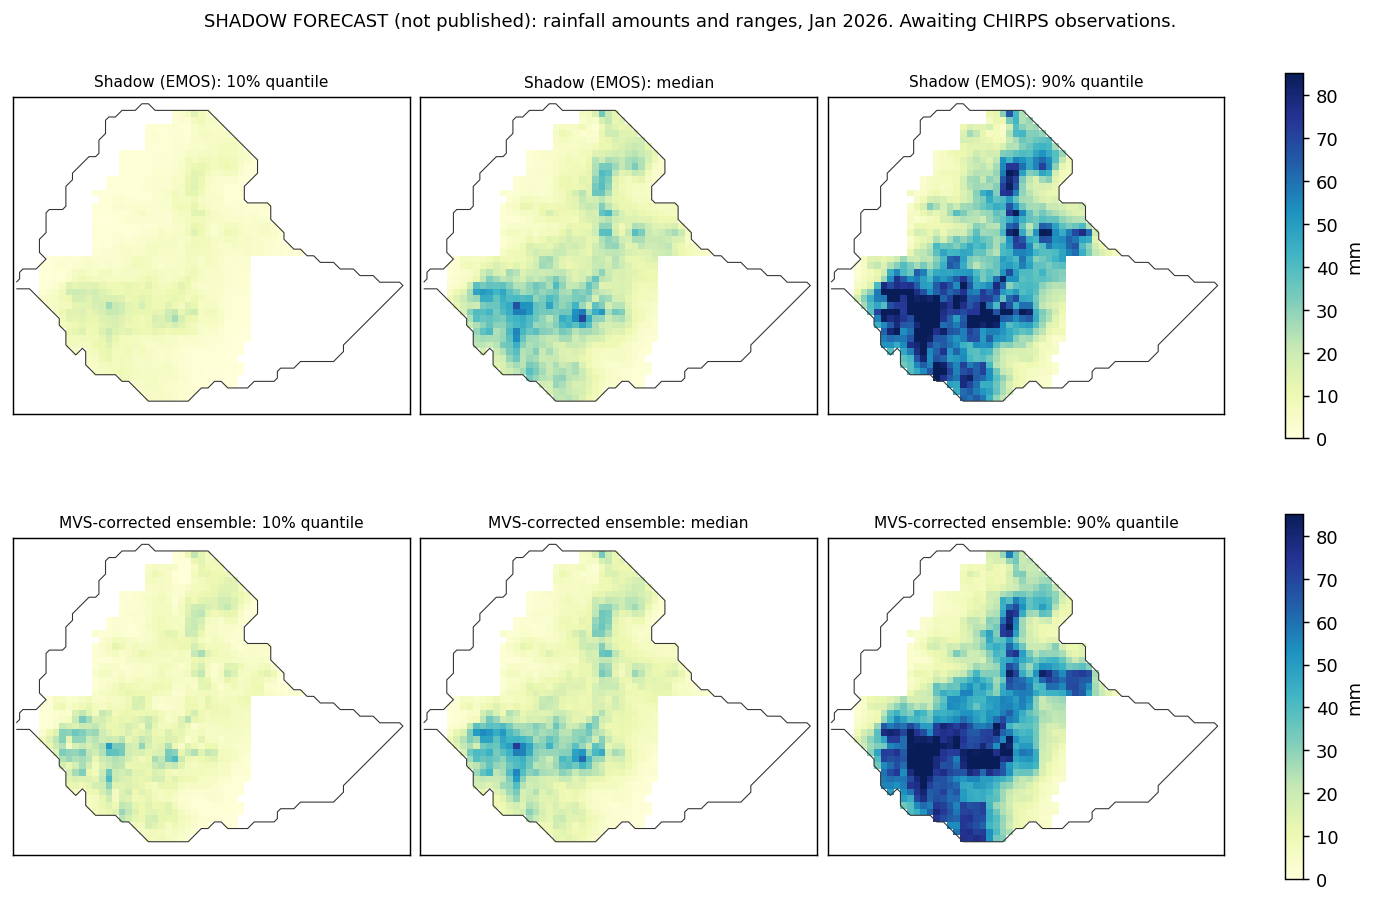
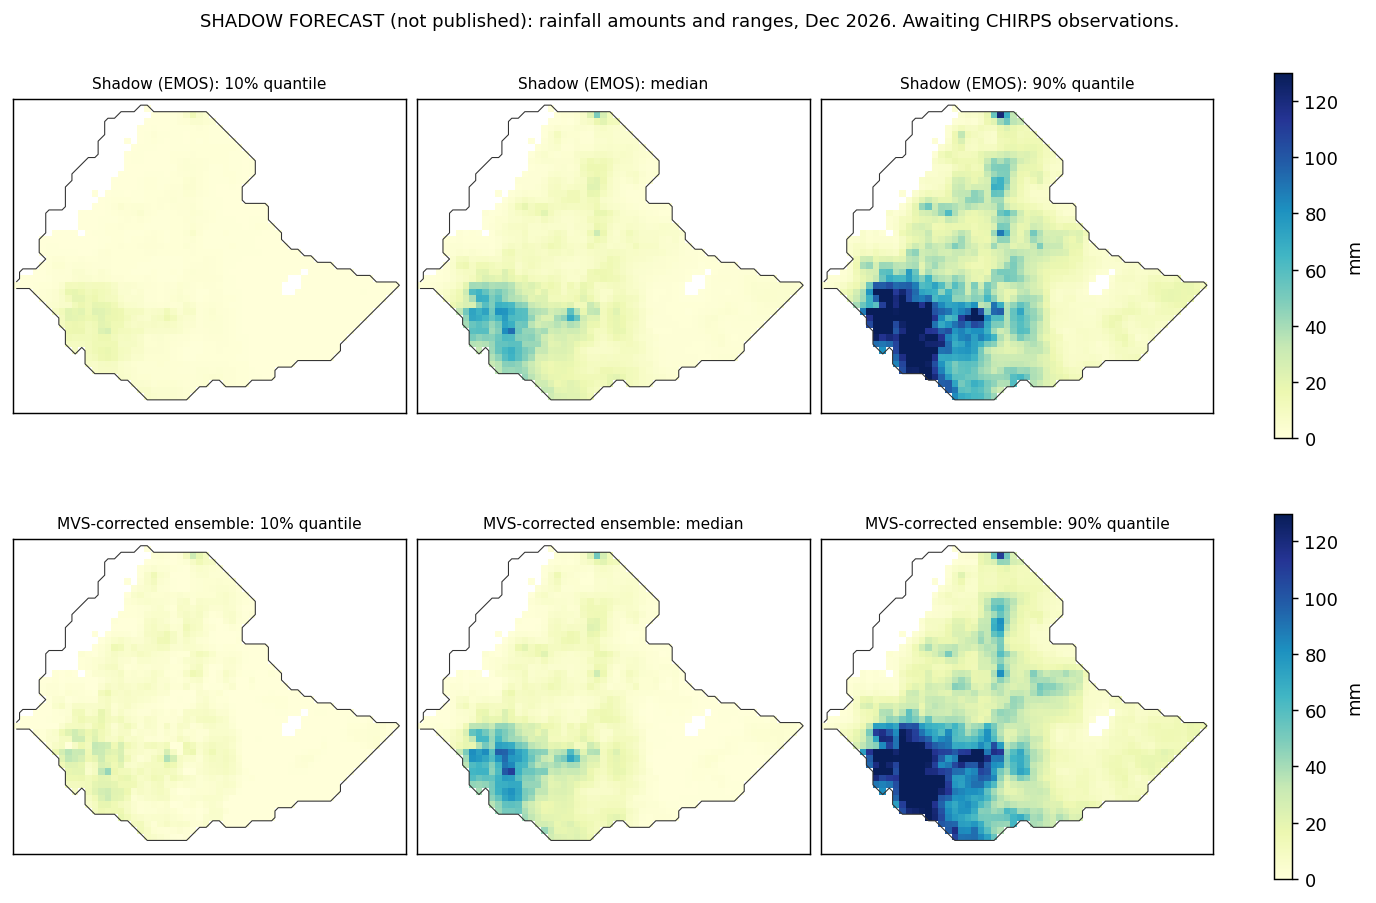
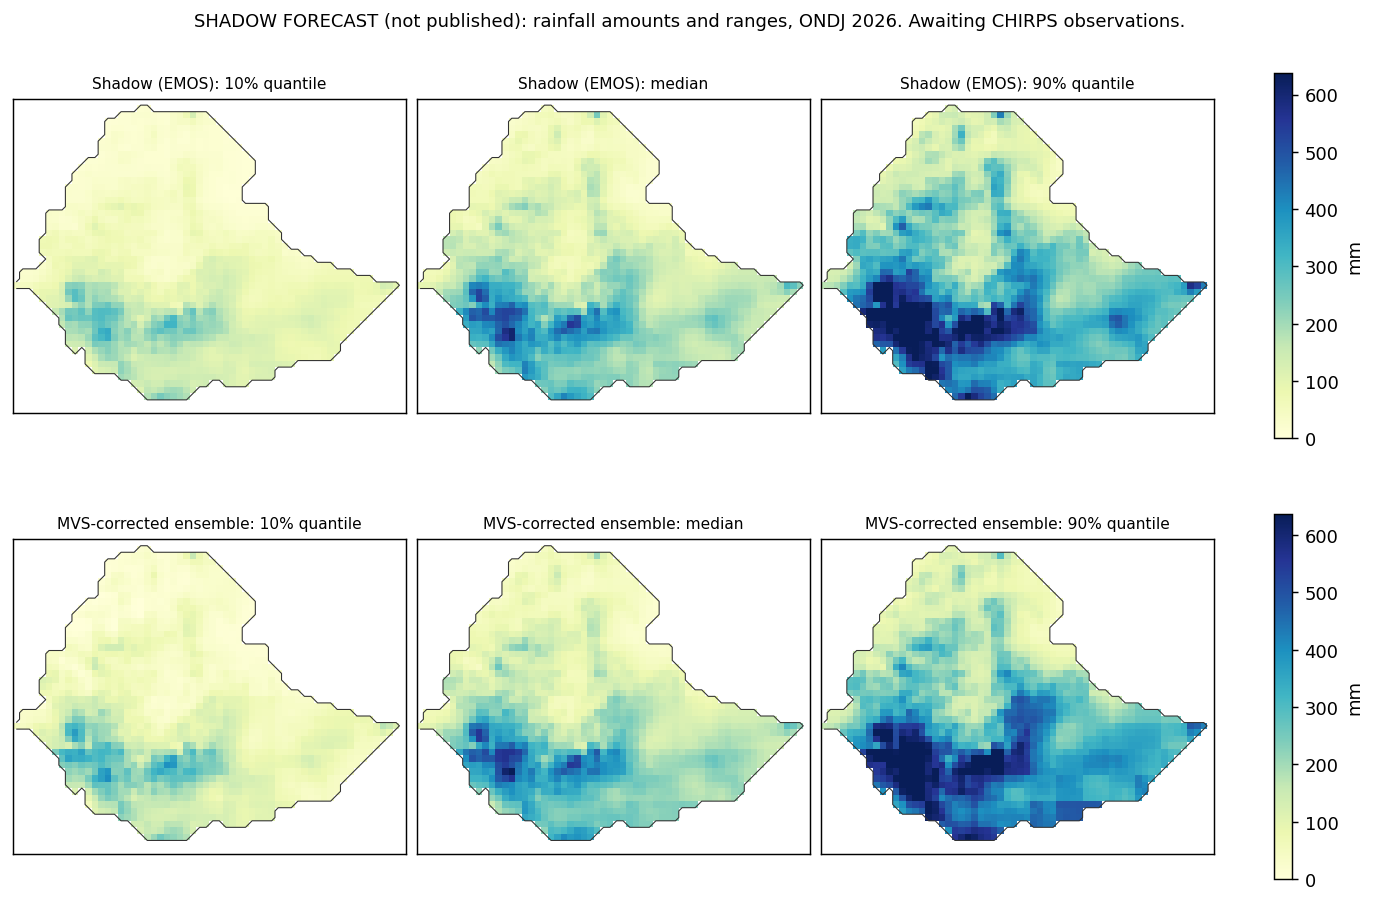
Not a published forecast. Since 2026-10-14, each cycle also runs the EMOS distribution model (censored shifted gamma, fitted on the cycle's reference years) and records its median and 10–90% range for every target next to the MVS-corrected ensemble. In Phase 2 the EMOS 10-90% intervals held 76-84% of observed totals where the MVS-corrected ensemble's held 46-76% (80% is calibrated), and EMOS was confirmed better in CRPS for the January-initialized FMAM season and JJAS September. The shadow builds independent evidence season by season before any amount or range product is considered. Each season is scored once its CHIRPS observations exist; any change to what is published is a separate decision after several seasons.
January initialization · FMAM and its monthsFebruary initialization · FMAM and its monthsMay initialization · JJAS and its monthsSeptember initialization · ONDJ and its months
January initialization · FMAM and its months
2026 forecast · 5 of 5 targets observed so far
| Target | Climatology (mm) | Shadow: median (10–90%), mm | MVS ensemble: median (10–90%), mm | Range width / climatology (shadow / MVS) |
|---|---|---|---|---|
| Feb | 20 | 18 (6–40) | 15 (10–39) | 2.01 / 1.56 |
| Mar | 53 | 50 (13–131) | 47 (26–116) | 2.48 / 2.00 |
| Apr | 99 | 86 (33–176) | 85 (38–171) | 1.58 / 1.50 |
| May | 110 | 98 (47–170) | 98 (57–158) | 1.25 / 1.07 |
| FMAM | 278 | 266 (165–402) | 267 (170–396) | 0.94 / 0.91 |
| Target | Coverage, shadow | Coverage, MVS | CRPSS, shadow | CRPSS, MVS | Median pinball, shadow (mm) | Median pinball, MVS (mm) | RPSS, shadow terciles | RPSS, published |
|---|---|---|---|---|---|---|---|---|
| Feb | 89% | 63% | -0.319 | -0.207 | 5.1 | 4.4 | -0.332 | -0.042 |
| Mar | 78% | 60% | +0.164 | +0.101 | 30.4 | 31.7 | +0.279 | +0.049 |
| Apr | 82% | 81% | +0.010 | +0.014 | 16.8 | 17.2 | +0.025 | +0.010 |
| May | 94% | 87% | +0.017 | +0.032 | 11.5 | 11.7 | +0.031 | +0.028 |
| FMAM | 88% | 84% | -0.027 | -0.066 | 33.1 | 33.5 | -0.022 | -0.026 |
Feb 2026: maps
Mar 2026: maps
Apr 2026: maps
May 2026: maps
FMAM 2026: maps
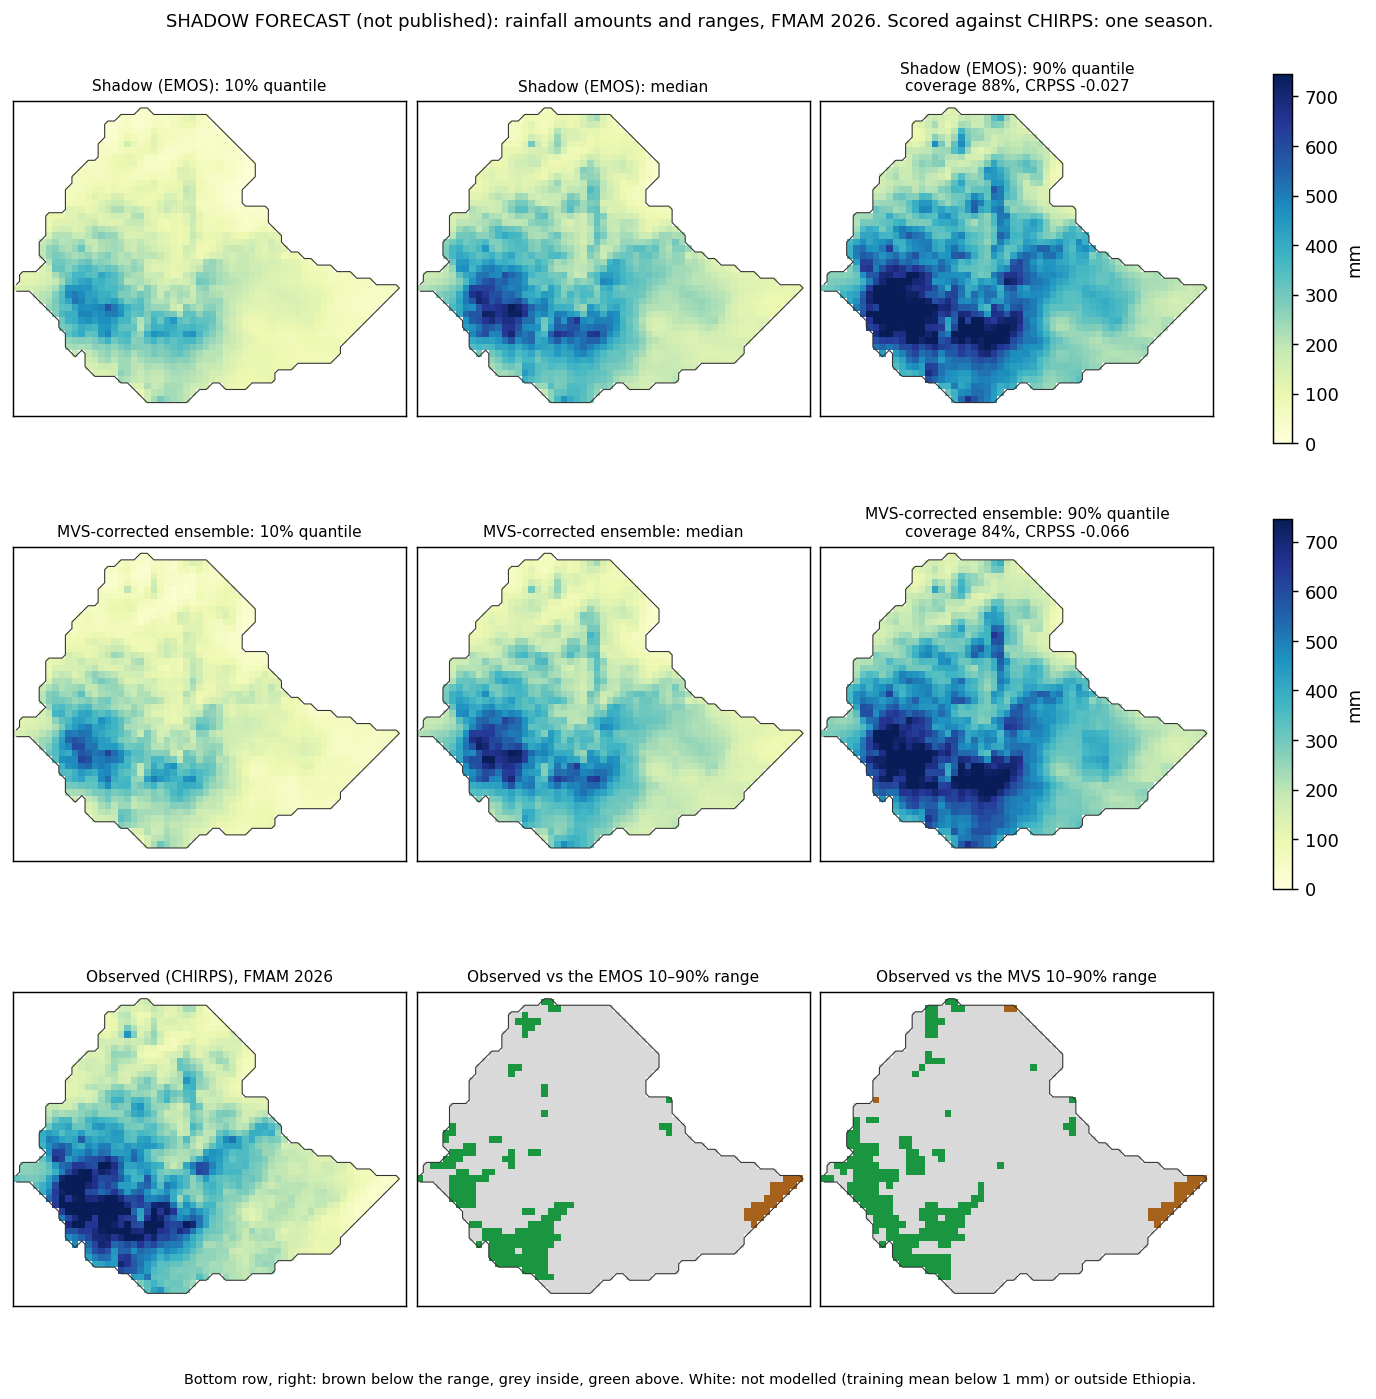
Benchmark evidence for this cycle: Phase 2 distribution models.
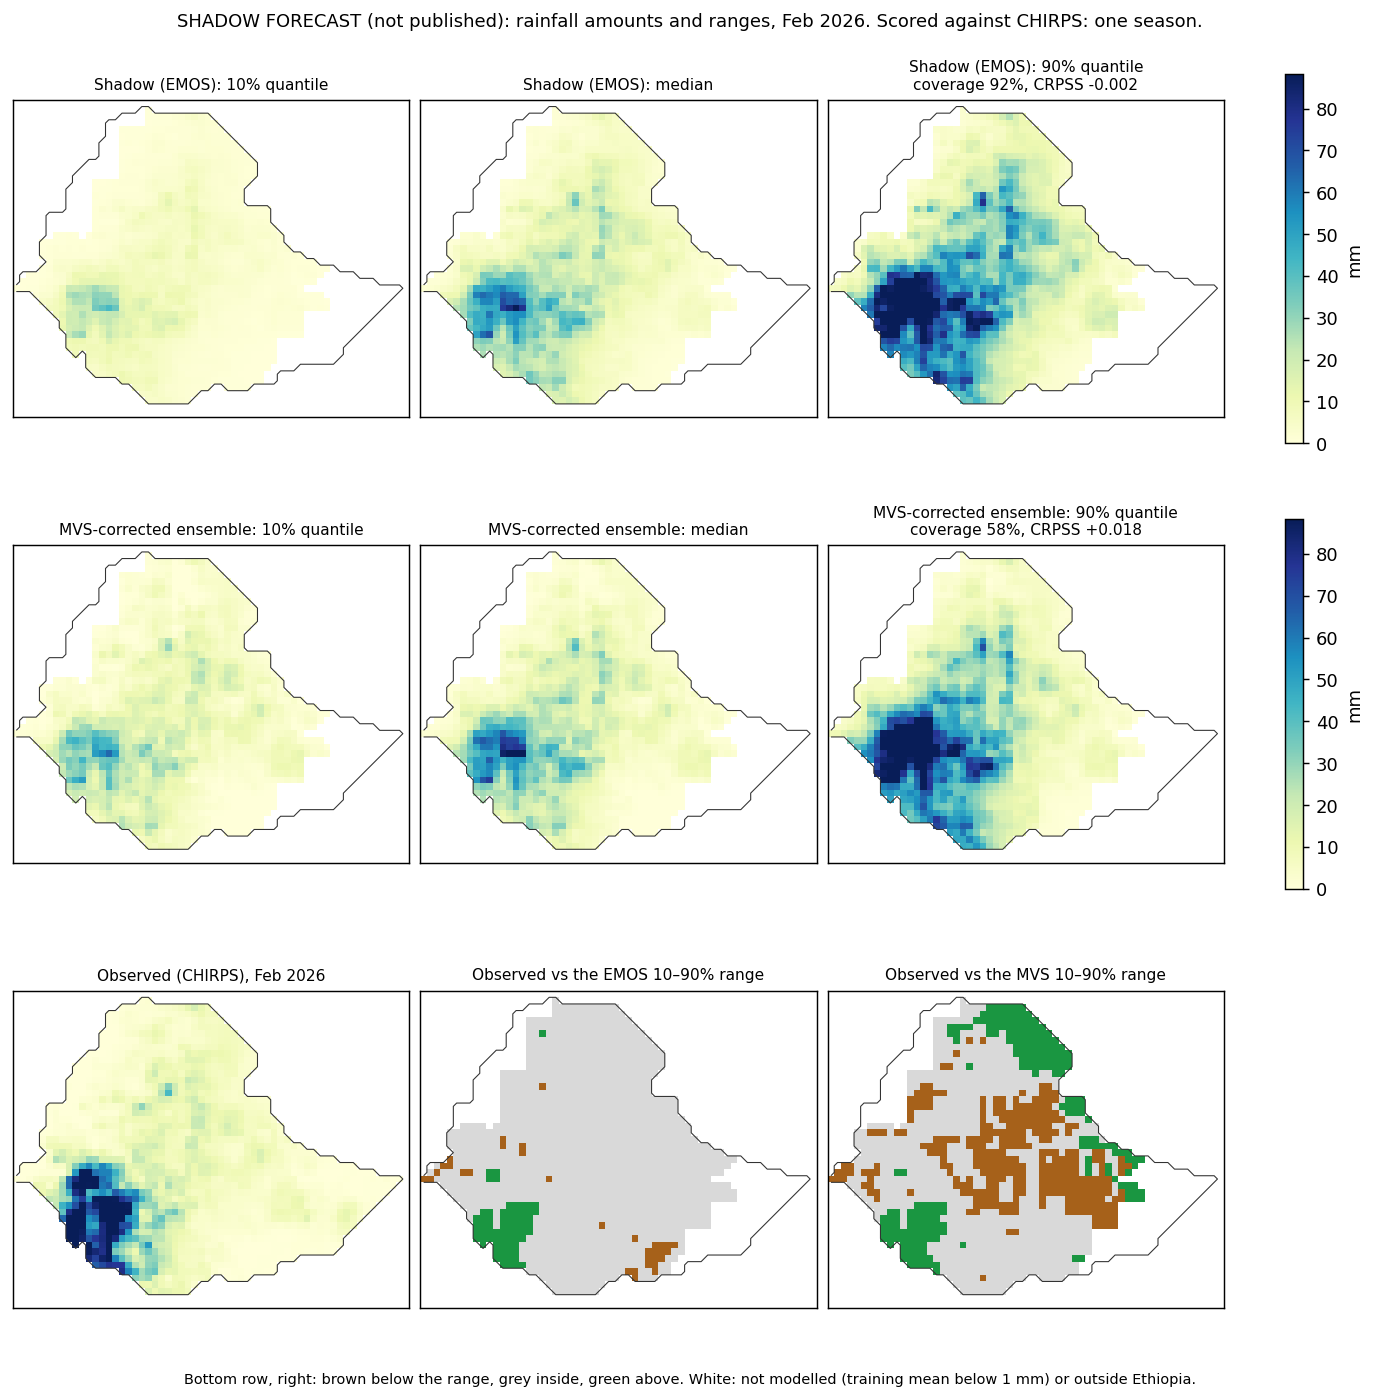
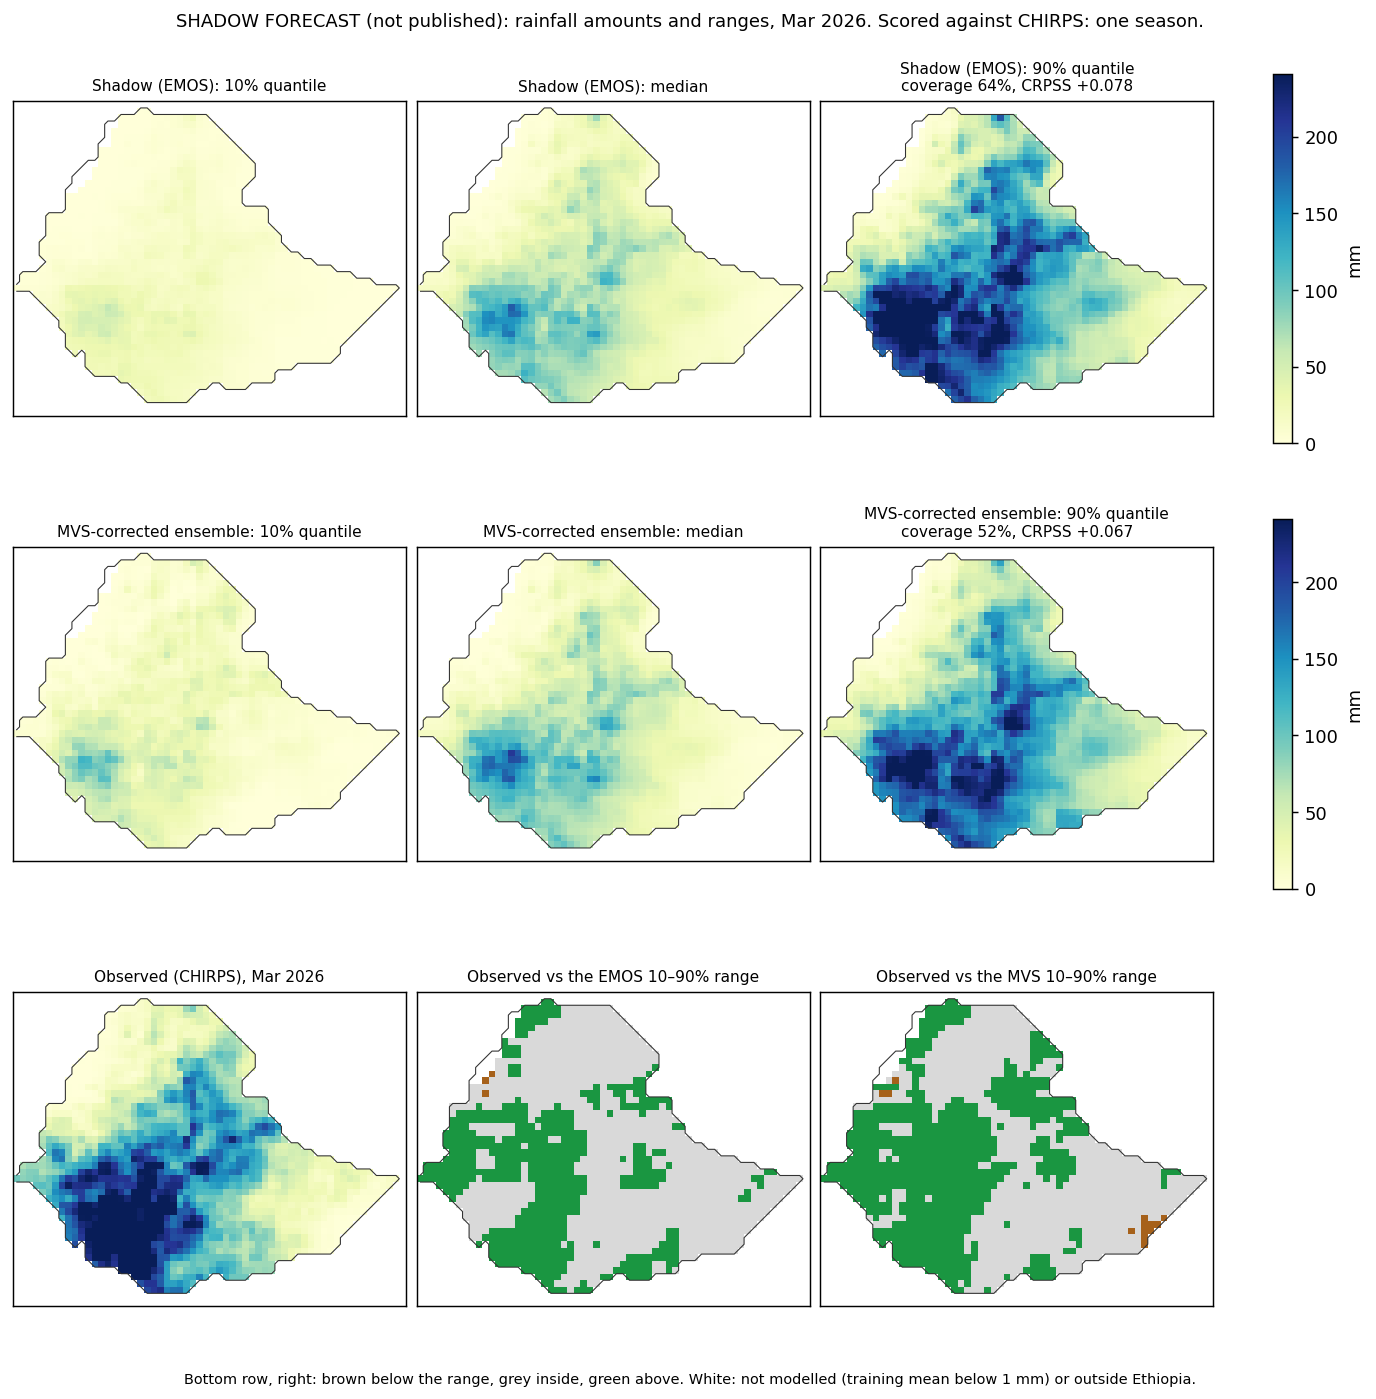
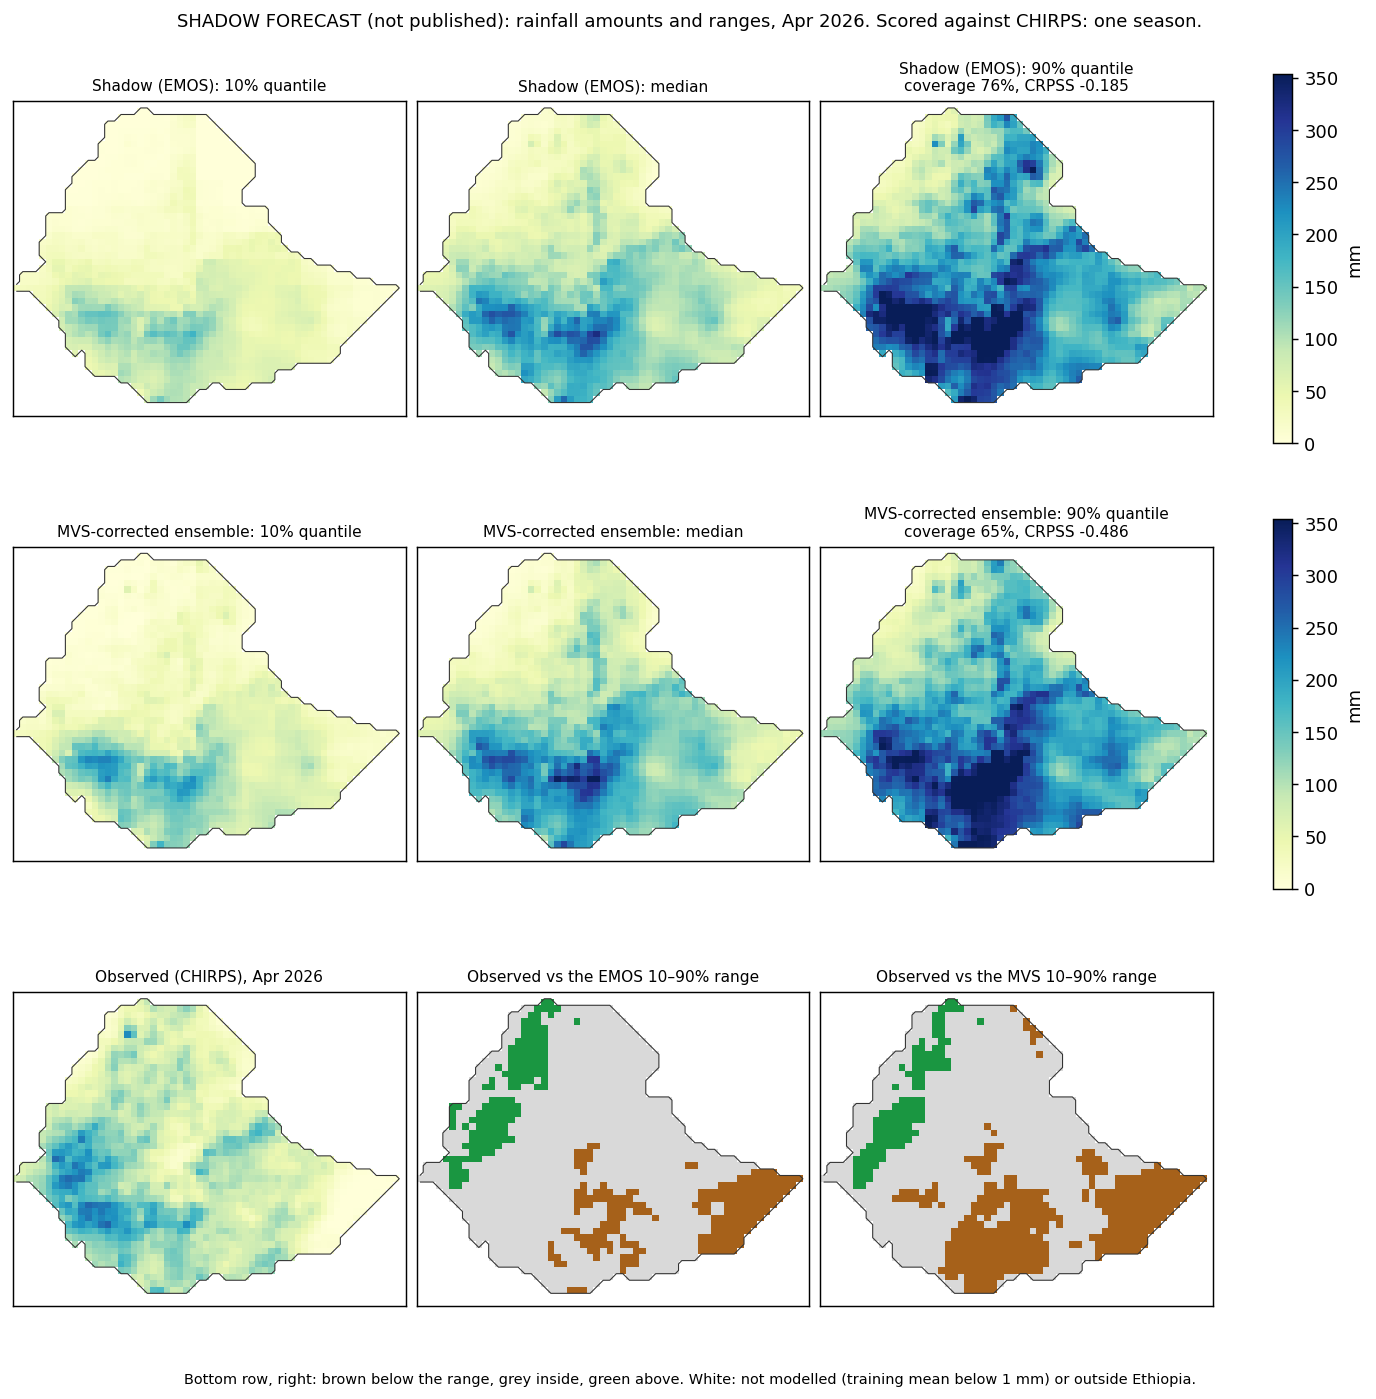
February initialization · FMAM and its months
2026 forecast · 5 of 5 targets observed so far
| Target | Climatology (mm) | Shadow: median (10–90%), mm | MVS ensemble: median (10–90%), mm | Range width / climatology (shadow / MVS) |
|---|---|---|---|---|
| Feb | 19 | 14 (5–31) | 14 (10–27) | 1.34 / 0.85 |
| Mar | 53 | 45 (12–118) | 48 (22–106) | 2.12 / 1.78 |
| Apr | 99 | 101 (44–197) | 119 (59–197) | 1.78 / 1.64 |
| May | 110 | 100 (45–182) | 99 (52–172) | 1.43 / 1.28 |
| FMAM | 278 | 286 (186–420) | 301 (206–413) | 0.94 / 0.86 |
| Target | Coverage, shadow | Coverage, MVS | CRPSS, shadow | CRPSS, MVS | Median pinball, shadow (mm) | Median pinball, MVS (mm) | RPSS, shadow terciles | RPSS, published |
|---|---|---|---|---|---|---|---|---|
| Feb | 92% | 58% | -0.002 | +0.018 | 3.7 | 3.6 | -0.030 | -0.009 |
| Mar | 64% | 52% | +0.078 | +0.067 | 32.6 | 31.2 | +0.131 | +0.058 |
| Apr | 76% | 65% | -0.185 | -0.486 | 20.9 | 28.0 | -0.152 | -0.134 |
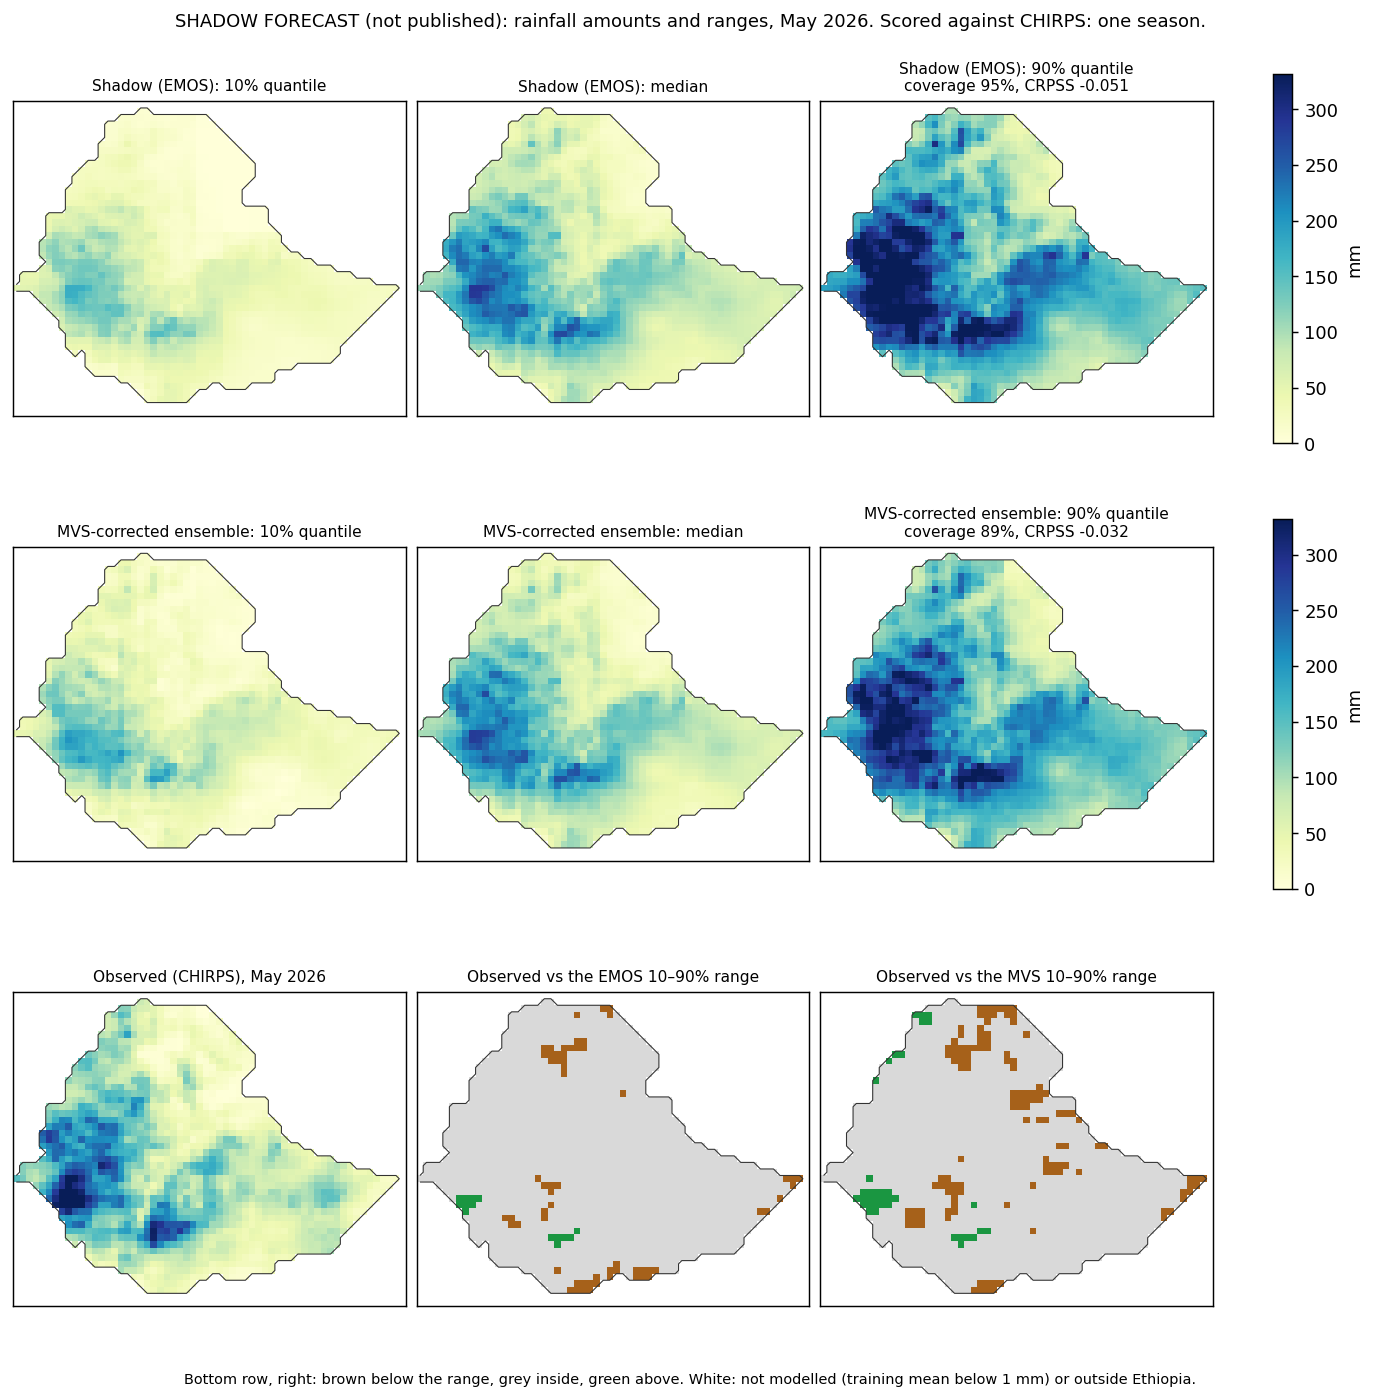
| May | 95% | 89% | -0.051 | -0.032 | 12.1 | 12.2 | -0.024 | +0.002 |
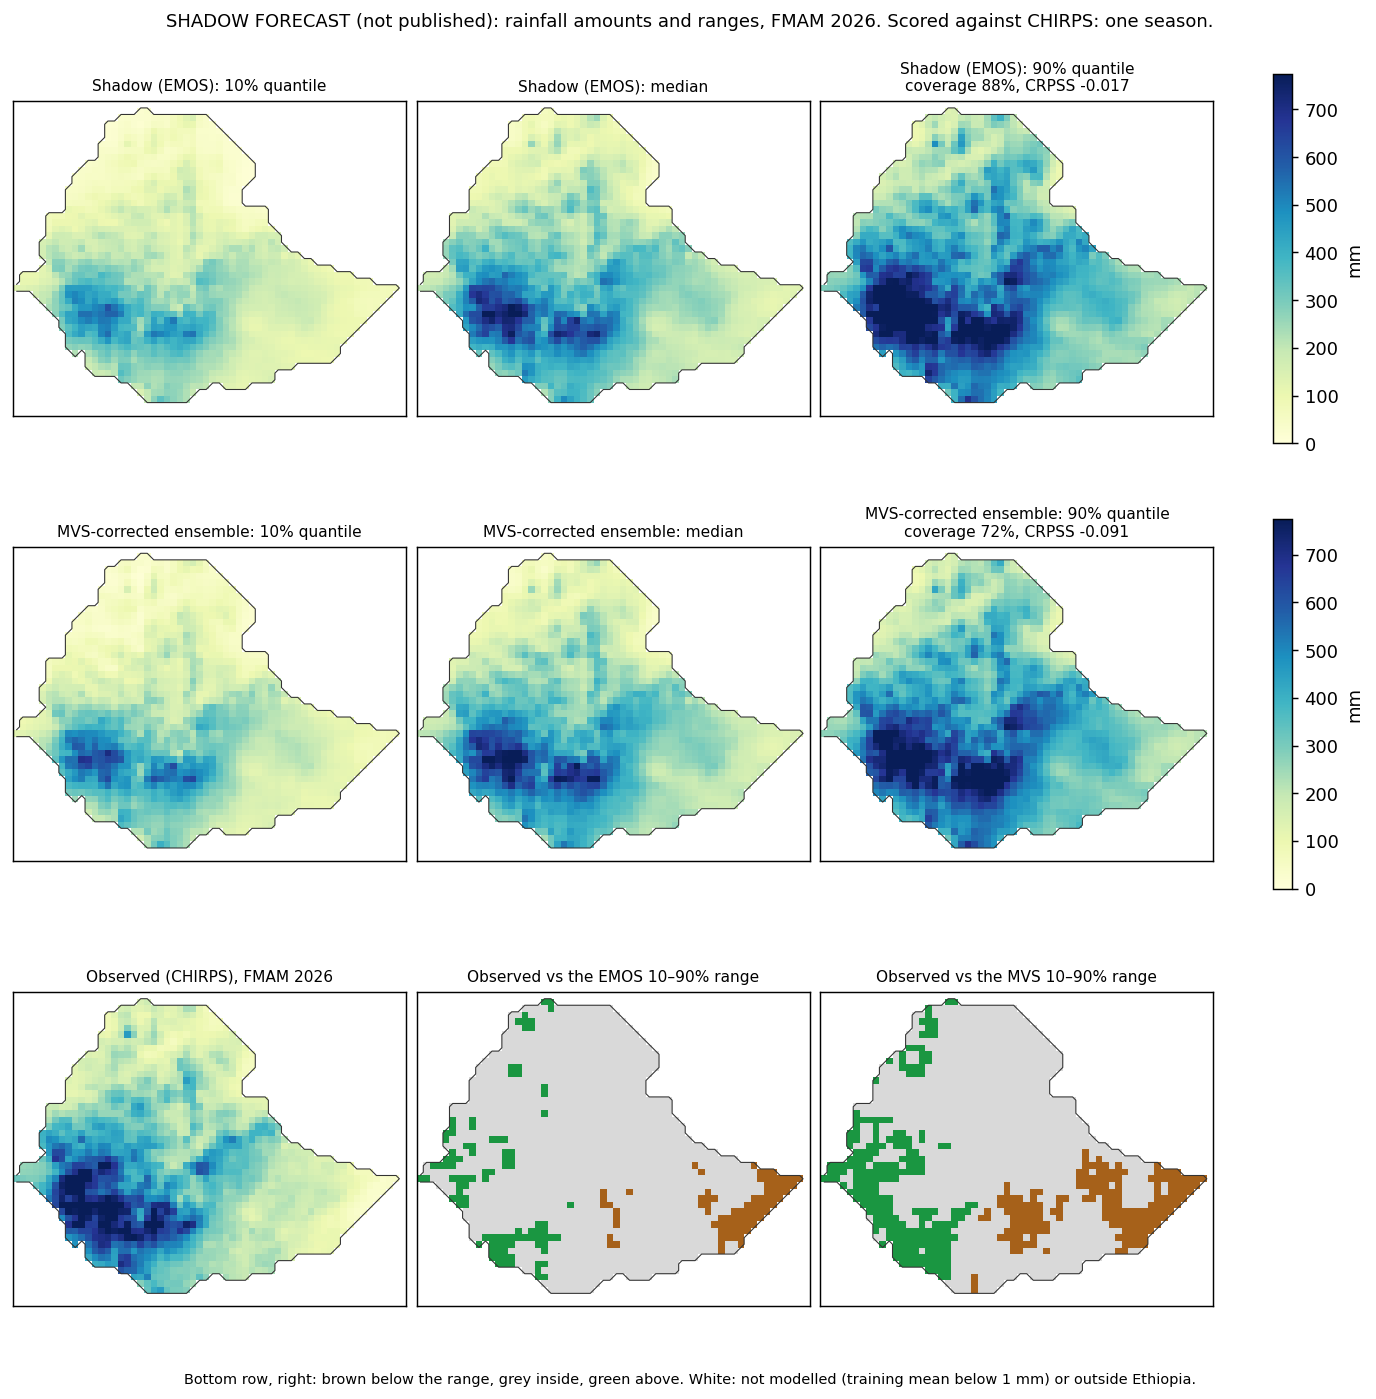
| FMAM | 88% | 72% | -0.017 | -0.091 | 33.1 | 35.0 | -0.046 | -0.013 |
Feb 2026: maps
Mar 2026: maps
Apr 2026: maps
May 2026: maps
FMAM 2026: maps
Benchmark evidence for this cycle: Phase 2 distribution models.
May initialization · JJAS and its months
2026 forecast · 5 of 5 targets observed so far
| Target | Climatology (mm) | Shadow: median (10–90%), mm | MVS ensemble: median (10–90%), mm | Range width / climatology (shadow / MVS) |
|---|---|---|---|---|
| Jul | 164 | 151 (101–212) | 138 (96–184) | 0.74 / 0.64 |
| Jun | 95 | 81 (45–132) | 71 (49–100) | 0.98 / 0.62 |
| Aug | 165 | 149 (104–206) | 137 (102–180) | 0.68 / 0.58 |
| Sep | 112 | 103 (61–161) | 93 (58–141) | 1.42 / 1.45 |
| JJAS | 516 | 473 (373–593) | 430 (345–515) | 0.79 / 0.73 |
| Target | Coverage, shadow | Coverage, MVS | CRPSS, shadow | CRPSS, MVS | Median pinball, shadow (mm) | Median pinball, MVS (mm) | RPSS, shadow terciles | RPSS, published |
|---|---|---|---|---|---|---|---|---|
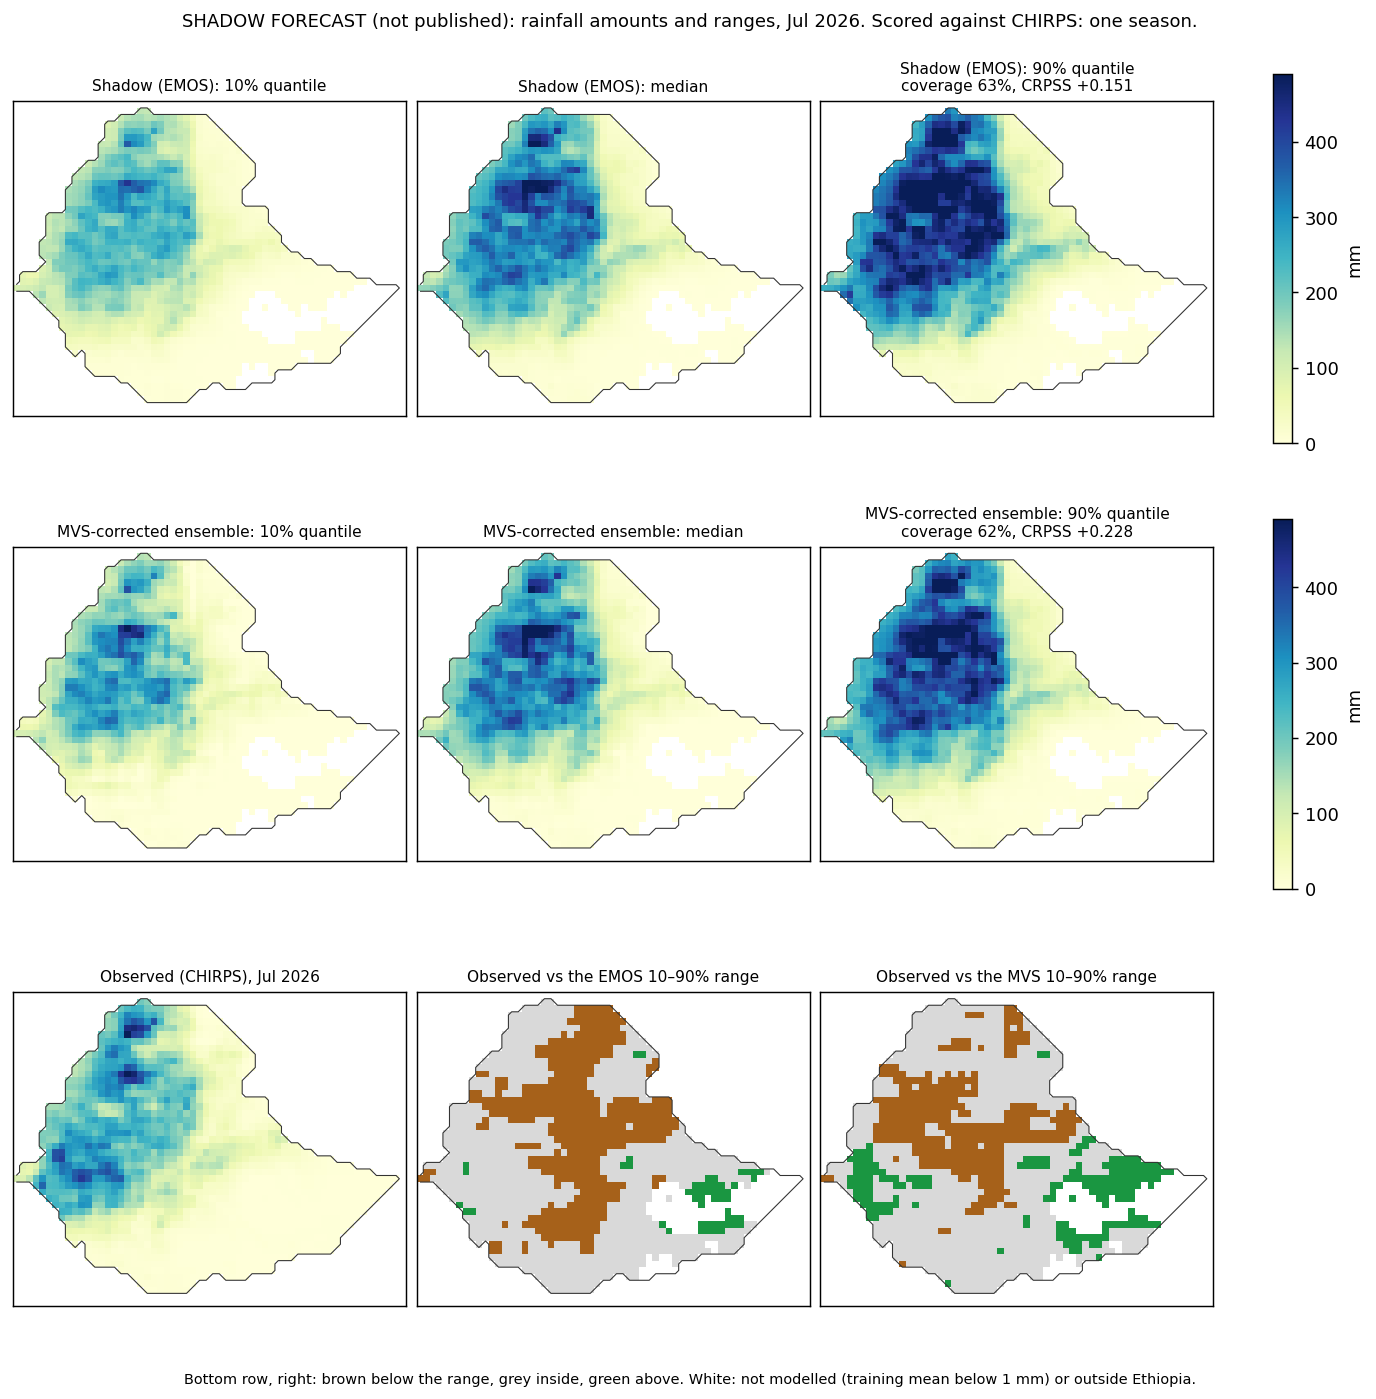
| Jul | 63% | 62% | +0.151 | +0.228 | 22.0 | 19.8 | +0.193 | +0.200 |
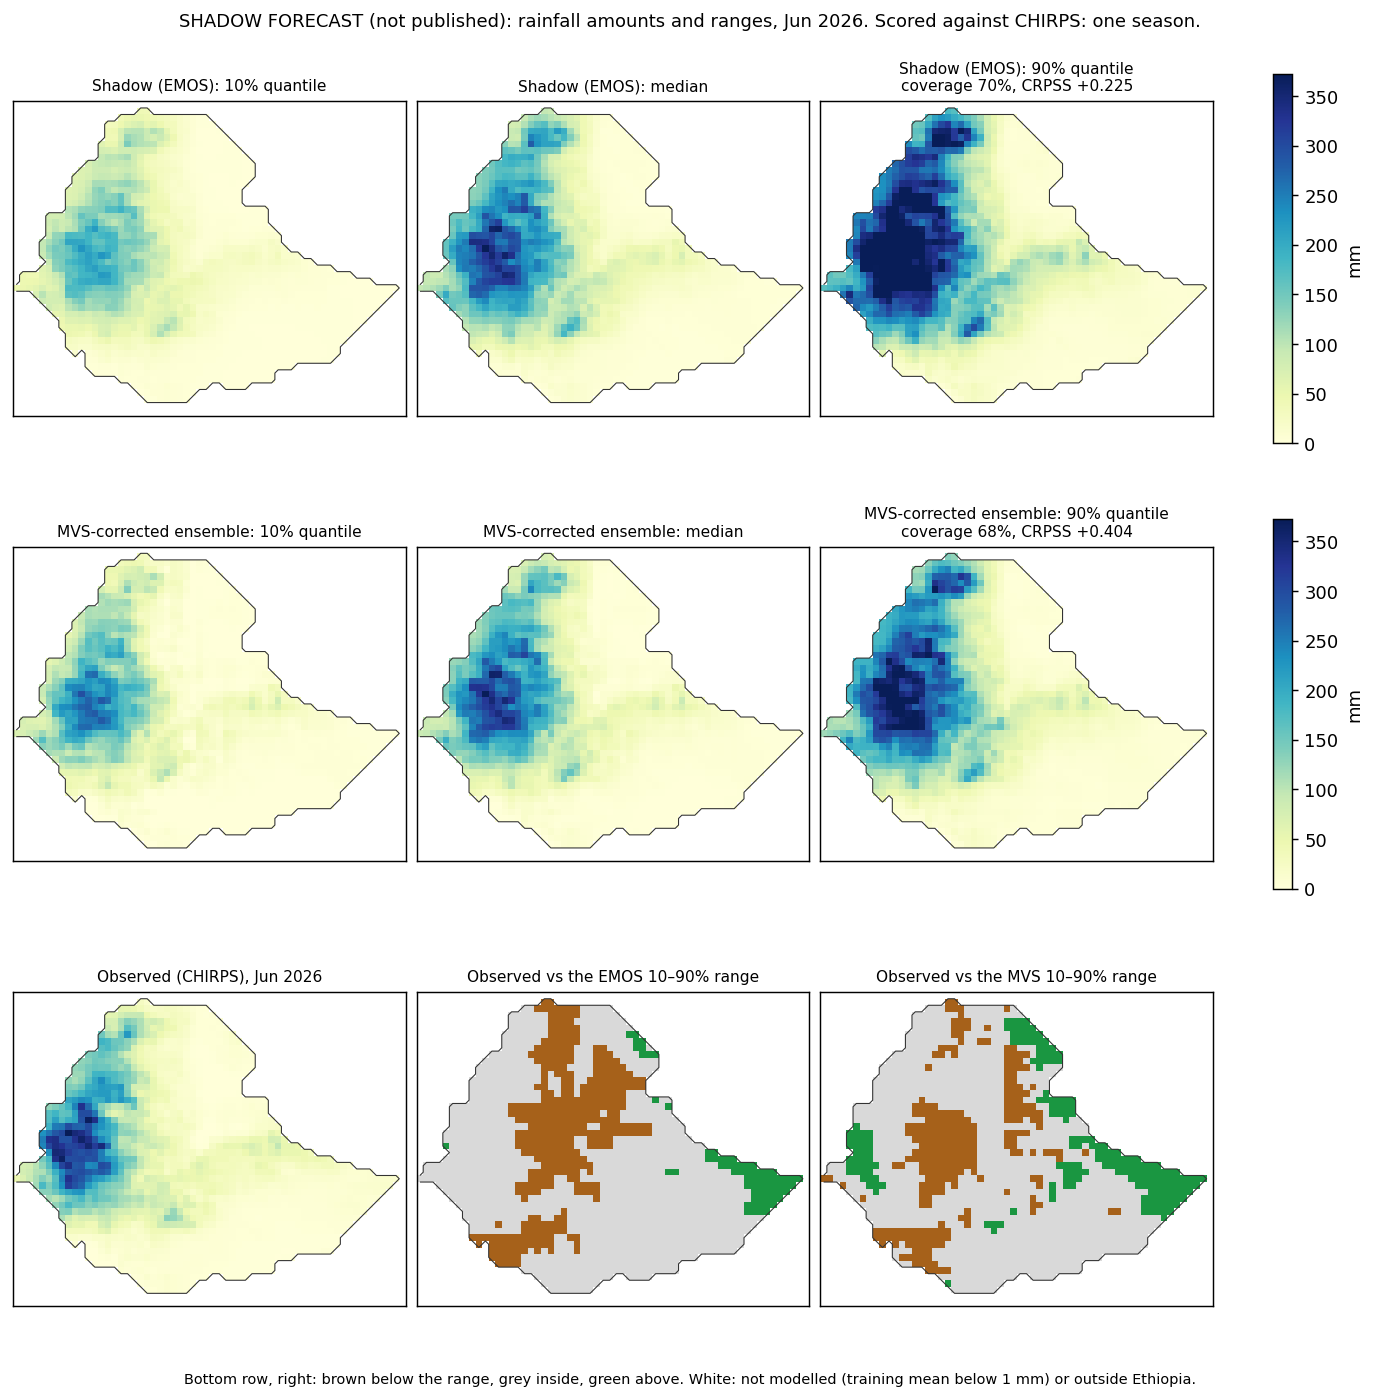
| Jun | 70% | 68% | +0.225 | +0.404 | 12.5 | 9.5 | +0.195 | +0.125 |
| Aug | 75% | 73% | +0.269 | +0.431 | 14.2 | 11.1 | +0.291 | +0.277 |
| Sep | 90% | 84% | +0.147 | +0.182 | 10.7 | 10.5 | +0.211 | +0.107 |
| JJAS | 59% | 73% | +0.285 | +0.532 | 50.5 | 34.2 | +0.371 | +0.352 |
Jul 2026: maps
Jun 2026: maps
Aug 2026: maps
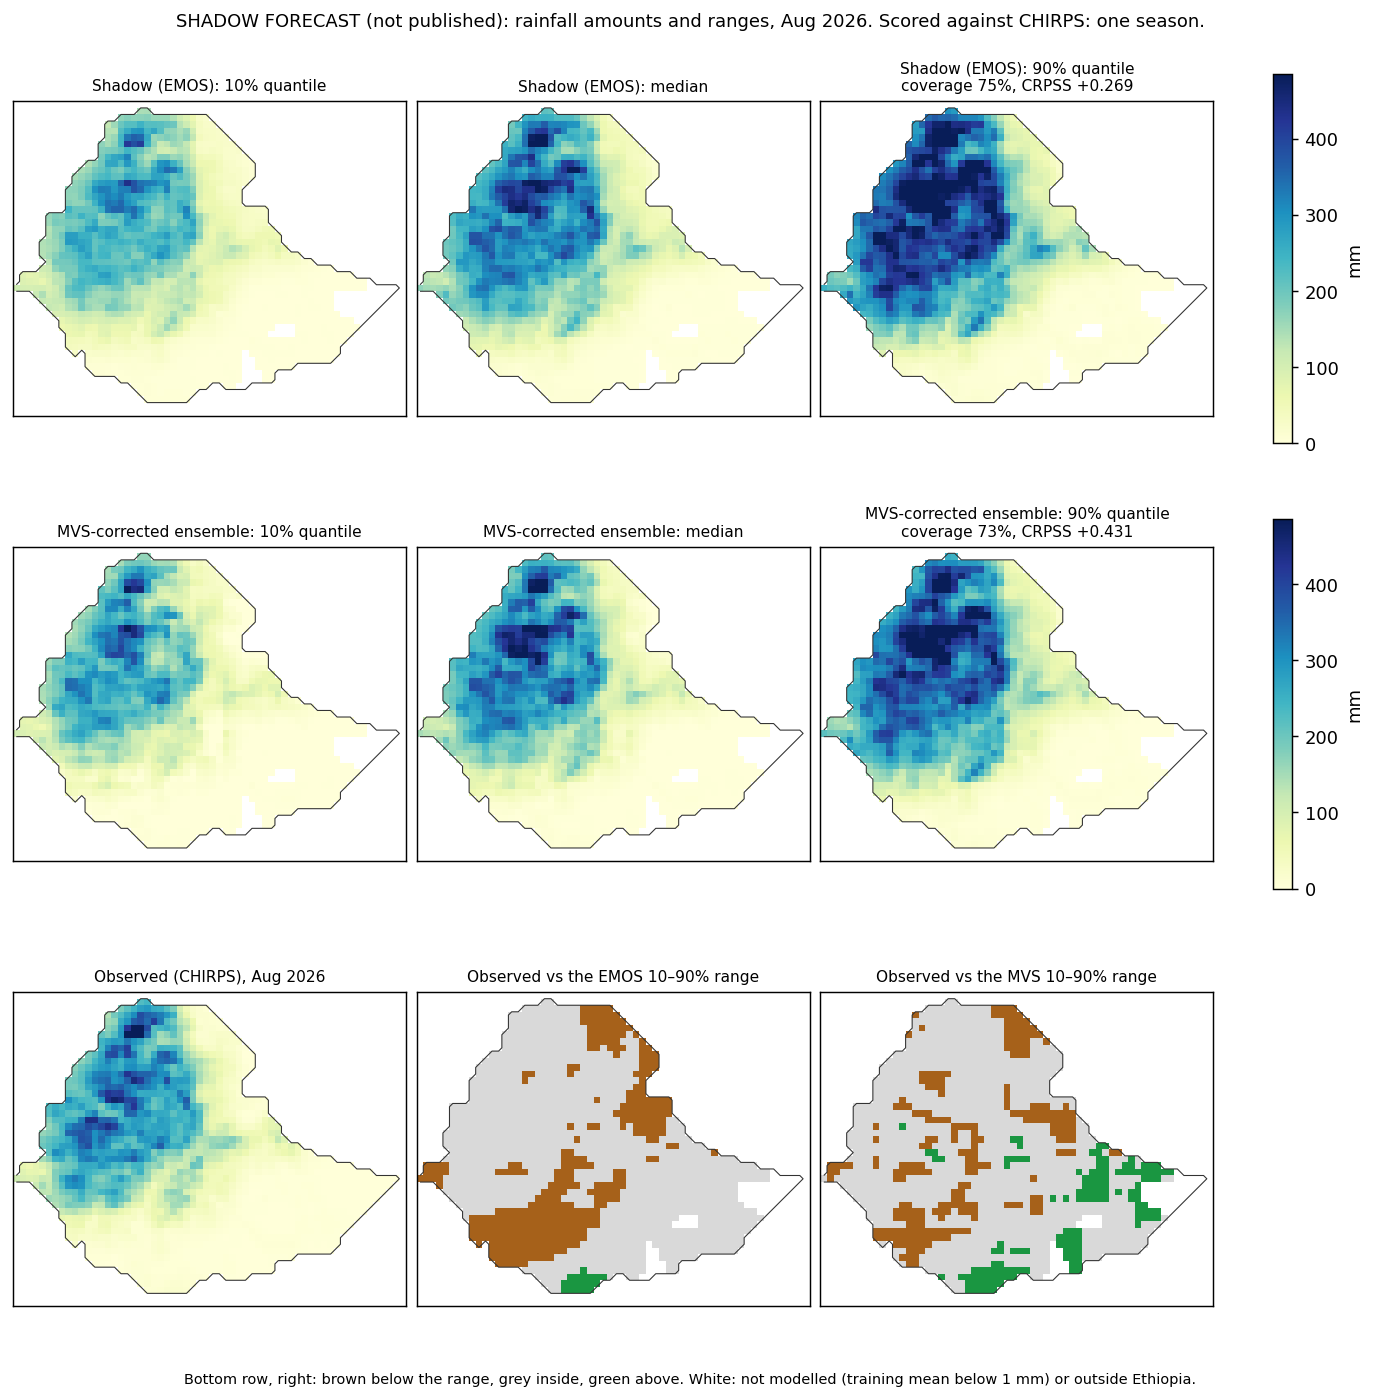
Sep 2026: maps
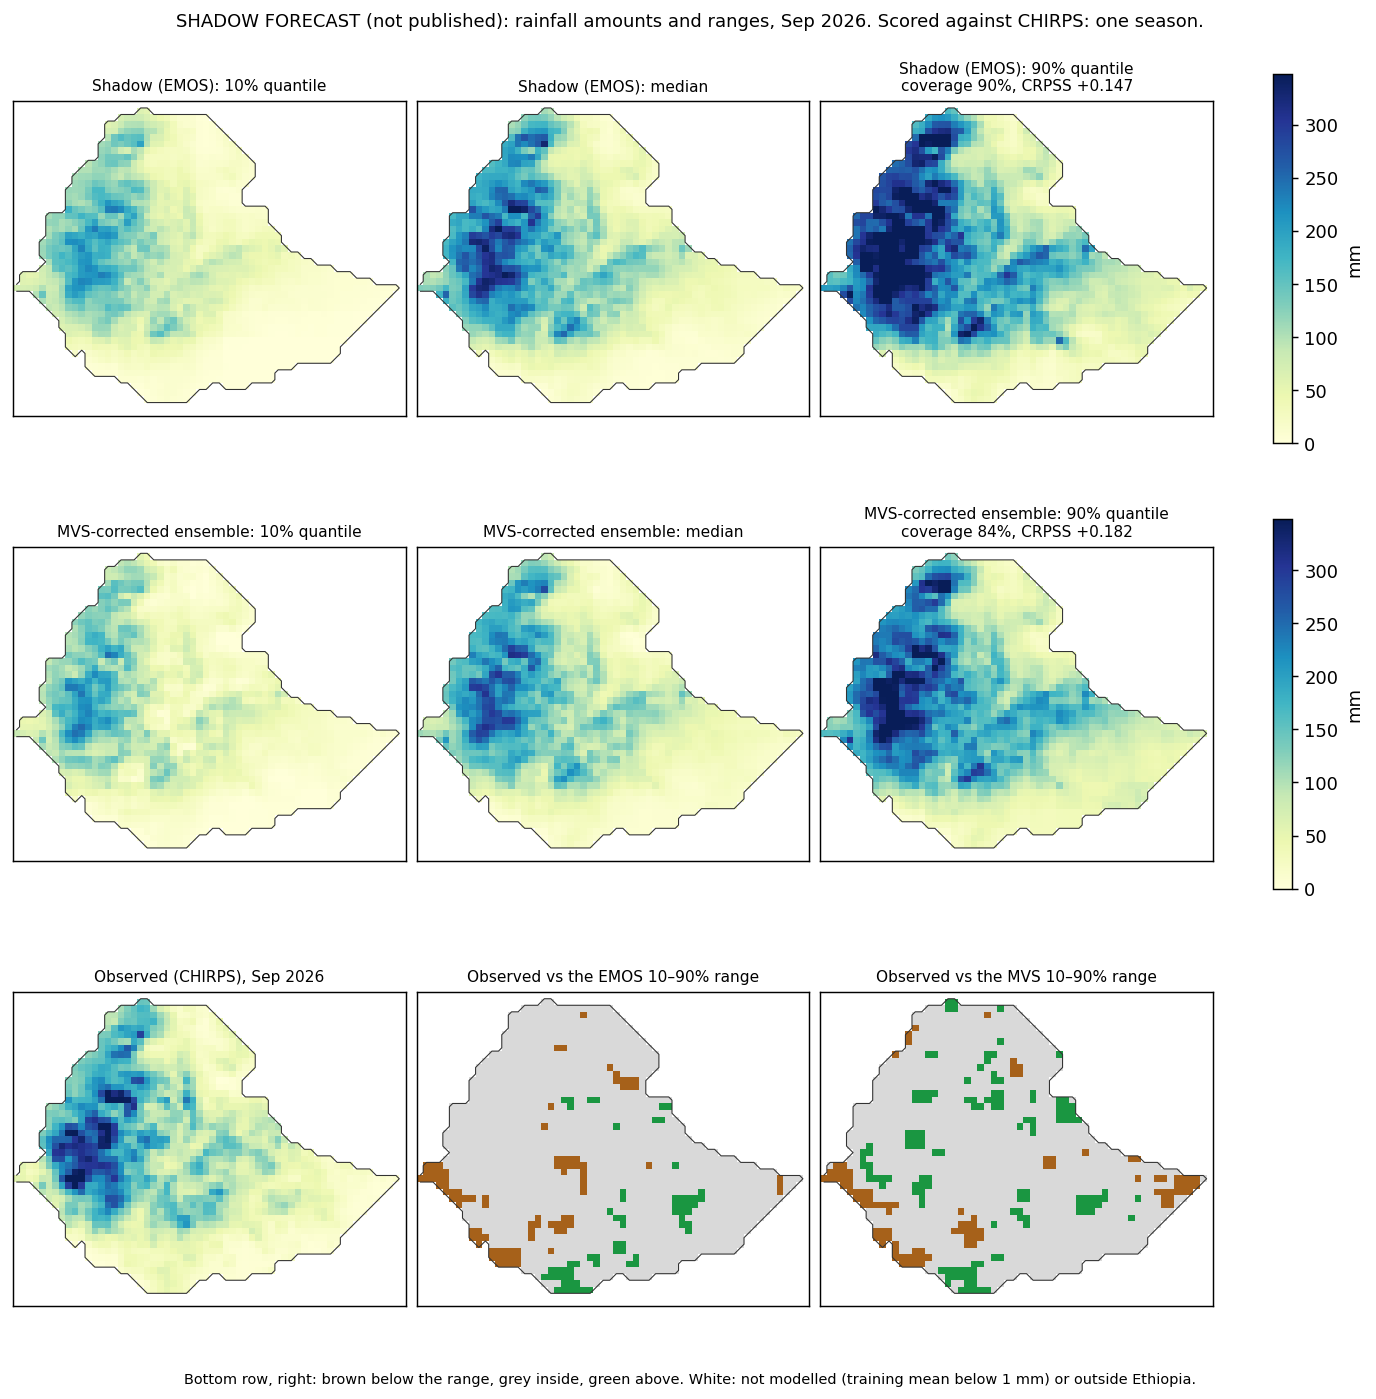
JJAS 2026: maps
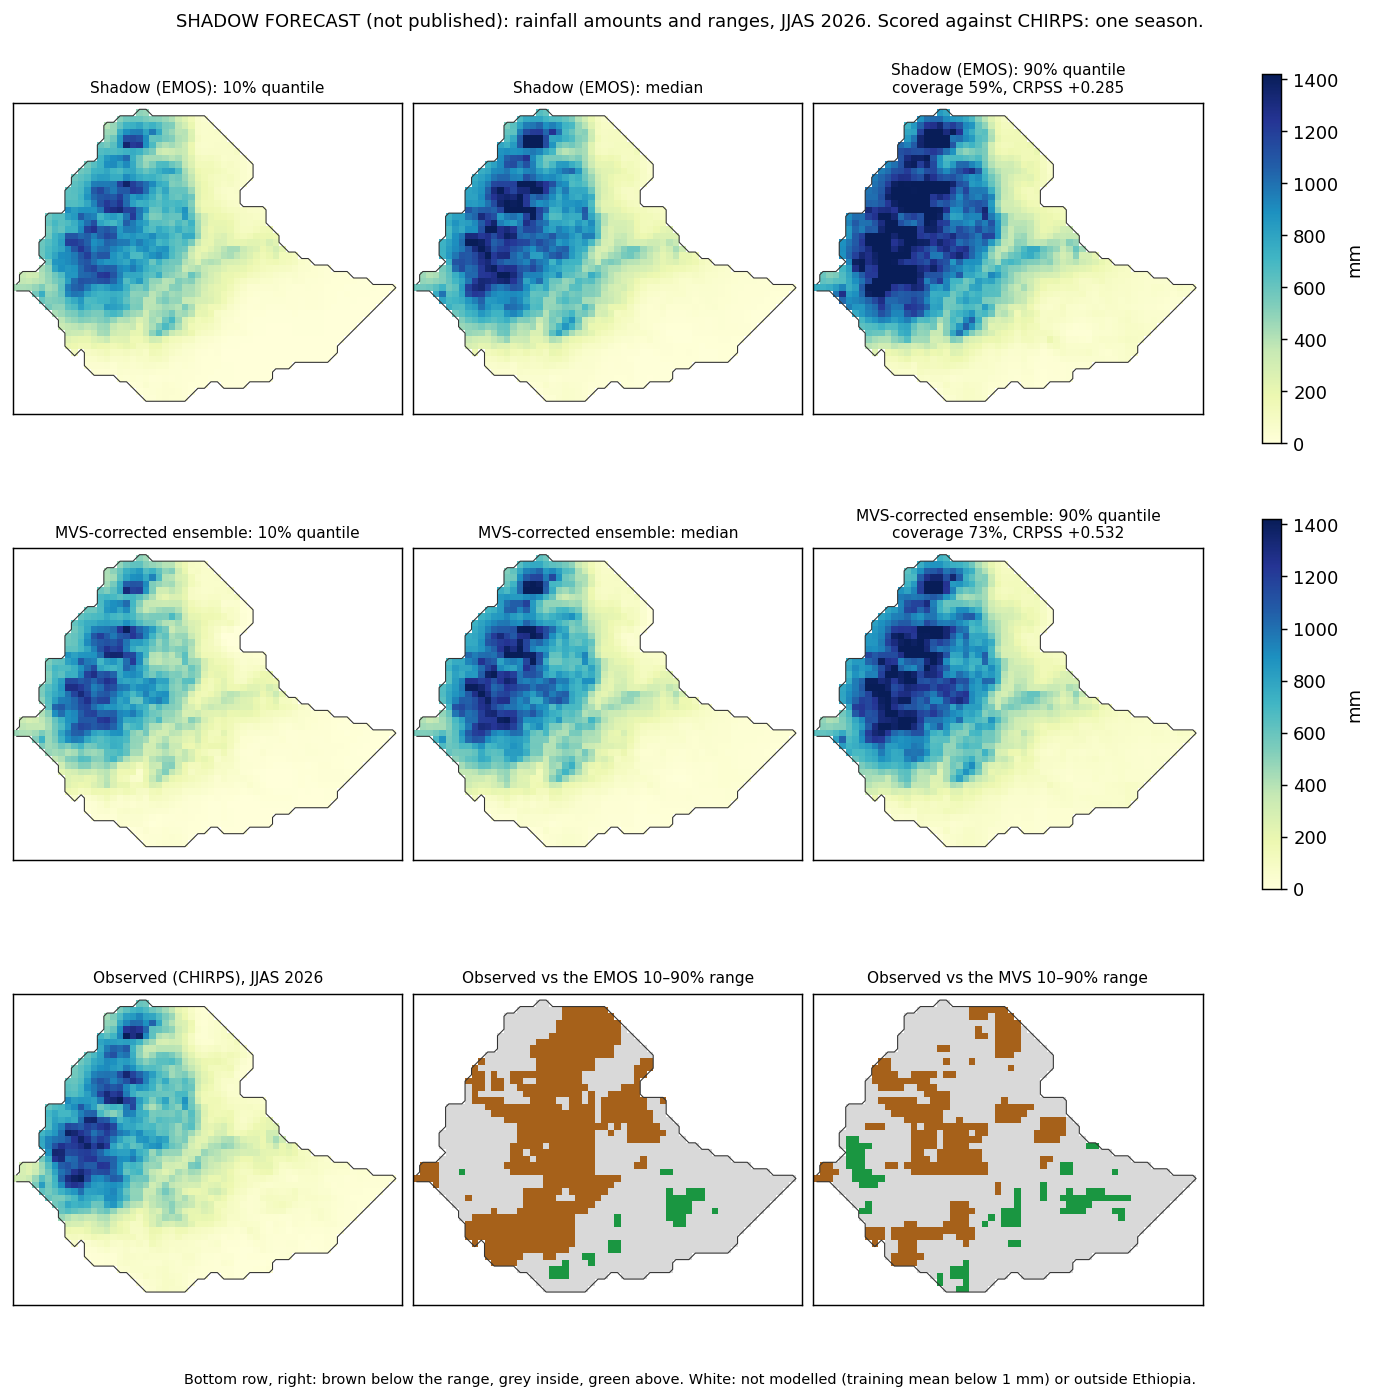
Benchmark evidence for this cycle: Phase 2 distribution models.
September initialization · ONDJ and its months
2026 forecast · 0 of 5 targets observed so far
| Target | Climatology (mm) | Shadow: median (10–90%), mm | MVS ensemble: median (10–90%), mm | Range width / climatology (shadow / MVS) |
|---|---|---|---|---|
| Oct | 92 | 78 (30–170) | 87 (38–160) | 1.72 / 1.56 |
| Nov | 44 | 55 (18–127) | 55 (17–133) | 2.77 / 2.90 |
| Jan | 17 | 17 (6–41) | 15 (9–40) | 2.17 / 1.83 |
| Dec | 15 | 12 (3–37) | 12 (5–39) | 2.32 / 2.40 |
| ONDJ | 163 | 176 (90–306) | 181 (94–313) | 1.43 / 1.49 |
Awaiting CHIRPS observations.
Oct 2026: maps
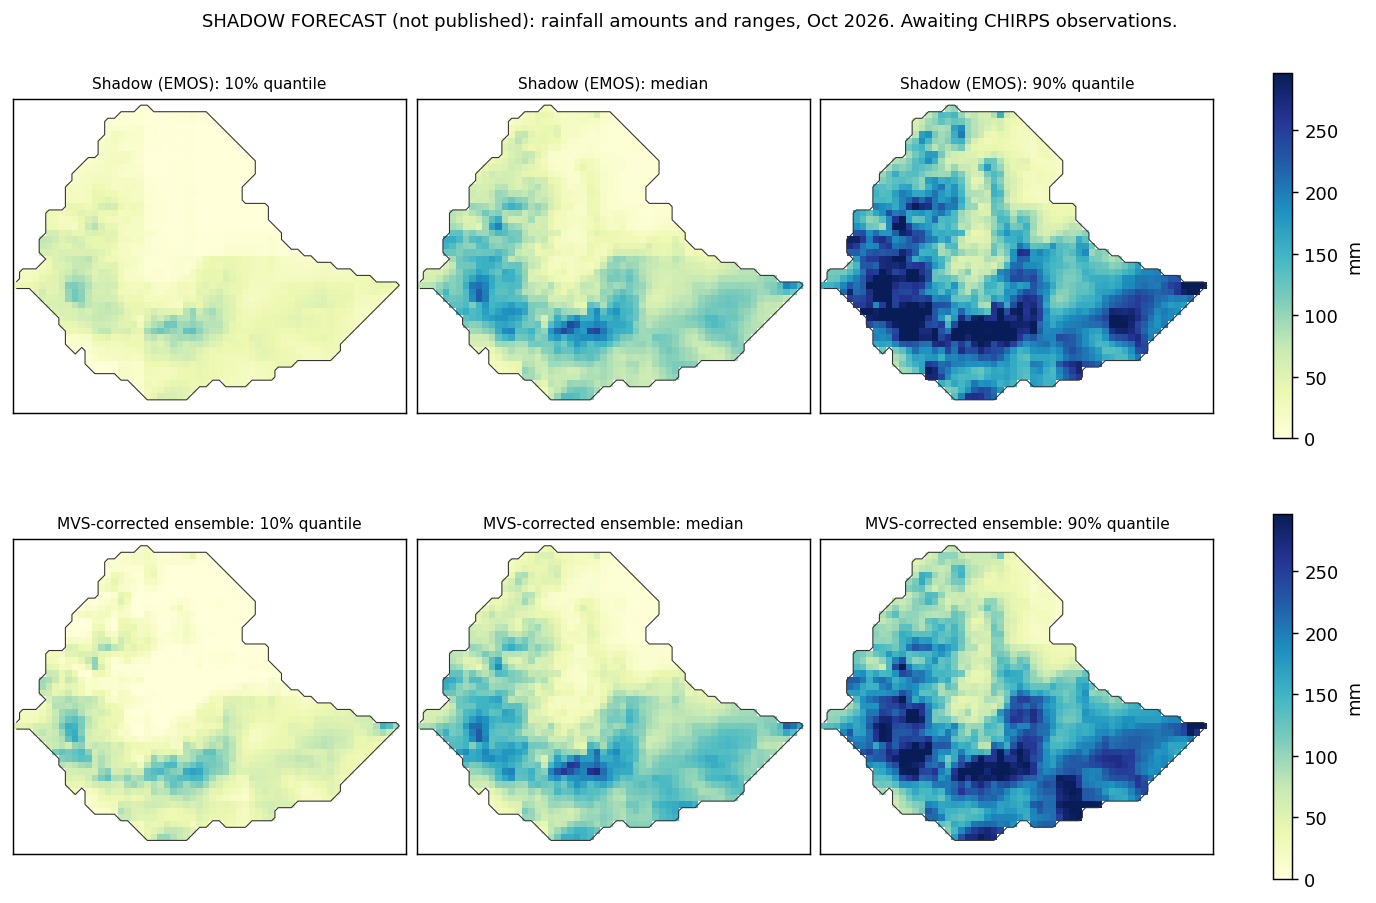
Nov 2026: maps
Jan 2026: maps
Dec 2026: maps
ONDJ 2026: maps
Benchmark evidence for this cycle: Phase 2 distribution models.