Verification · JJAS 2026
Frozen forecasts compared with official CHIRPS v3.0 observations once a target period is complete. Each result is one season or month, so it shows what happened this time, not long-term reliability.
The selected target comes first; the other verified targets of the cycle follow. Maps: forecast and observed anomaly side by side.
Forecast vs observed rainfall anomaly, JJAS R1+R2 rainfall domain (mm)
Forecast anomalyObserved anomaly
Area-mean anomalies against the 1993–2025 CHIRPS average. Probability skill (RPSS) refers to the blended probabilities; rainfall amount skill (CRPSS) and bias to the amount-corrected ensemble. Skill scores are decimals: +0.193 means a 19.3% lower score than climatology.
JJAS 2026
What happened?
- Rainfall was drier than the reference average by 208 mm (−25%), averaged over the assessed area.
- 95% of the assessed area fell in the below normal tercile.
What did the forecast capture?
- The forecast captured the dry conditions (−131 mm forecast, −208 mm observed).
- The highest average probability (51%) was on the observed below normal category.
- Probabilities scored better than climatology (RPSS +0.446).
- Rainfall amounts scored better than climatology (CRPSS +0.538).
What did it miss?
- Forecast rainfall was 76.2 mm higher than observed, averaged over the assessed area. It underestimated the rainfall deficit by about 37%.
Probability skill (RPSS)+0.446 (44.6% lower score than climatology)
Rainfall amount skill (CRPSS)+0.538 (53.8% lower score than climatology)
Average rainfall error (bias, positive = too wet)+76.2 mm
Observed category distribution (of the assessed area)95% / 4% / 2% below / near / above
Assessed area (share of the selected area)100% probabilities · 100% amounts
Raw benchmark (uncorrected model) RPSS+0.068
Monthly breakdown (Jun, Jul, Aug, Sep)
Jun 2026
What happened?
- Rainfall was drier than the reference average by 52 mm (−34%), averaged over the assessed area.
- 85% of the assessed area fell in the below normal tercile.
What did the forecast capture?
- The forecast captured the dry conditions (−32 mm forecast, −52 mm observed).
- The highest average probability (39%) was on the observed below normal category.
- Probabilities scored better than climatology (RPSS +0.144).
- Rainfall amounts scored better than climatology (CRPSS +0.410).
What did it miss?
- Forecast rainfall was 19.9 mm higher than observed, averaged over the assessed area. It underestimated the rainfall deficit by about 38%.
Probability skill (RPSS)+0.144 (14.4% lower score than climatology)
Rainfall amount skill (CRPSS)+0.410 (41.0% lower score than climatology)
Average rainfall error (bias, positive = too wet)+19.9 mm
Observed category distribution (of the assessed area)85% / 11% / 4% below / near / above
Assessed area (share of the selected area)100% probabilities · 100% amounts
Raw benchmark (uncorrected model) RPSS−0.016
Jul 2026
What happened?
- Rainfall was drier than the reference average by 73 mm (−29%), averaged over the assessed area.
- 81% of the assessed area fell in the below normal tercile.
What did the forecast capture?
- The forecast captured the dry conditions (−32 mm forecast, −73 mm observed).
- The highest average probability (43%) was on the observed below normal category.
- Probabilities scored better than climatology (RPSS +0.177).
- Rainfall amounts scored better than climatology (CRPSS +0.205).
What did it miss?
- Forecast rainfall was 40.9 mm higher than observed, averaged over the assessed area. It underestimated the rainfall deficit by about 56%.
Probability skill (RPSS)+0.177 (17.7% lower score than climatology)
Rainfall amount skill (CRPSS)+0.205 (20.5% lower score than climatology)
Average rainfall error (bias, positive = too wet)+40.9 mm
Observed category distribution (of the assessed area)81% / 14% / 5% below / near / above
Assessed area (share of the selected area)100% probabilities · 100% amounts
Raw benchmark (uncorrected model) RPSS−0.154
Aug 2026
What happened?
- Rainfall was drier than the reference average by 58 mm (−22%), averaged over the assessed area.
- 85% of the assessed area fell in the below normal tercile.
What did the forecast capture?
- The forecast captured the dry conditions (−34 mm forecast, −58 mm observed).
- The highest average probability (45%) was on the observed below normal category.
- Probabilities scored better than climatology (RPSS +0.289).
- Rainfall amounts scored better than climatology (CRPSS +0.411).
What did it miss?
- Forecast rainfall was 23.6 mm higher than observed, averaged over the assessed area. It underestimated the rainfall deficit by about 41%.
Probability skill (RPSS)+0.289 (28.9% lower score than climatology)
Rainfall amount skill (CRPSS)+0.411 (41.1% lower score than climatology)
Average rainfall error (bias, positive = too wet)+23.6 mm
Observed category distribution (of the assessed area)85% / 14% / 2% below / near / above
Assessed area (share of the selected area)100% probabilities · 100% amounts
Raw benchmark (uncorrected model) RPSS+0.097
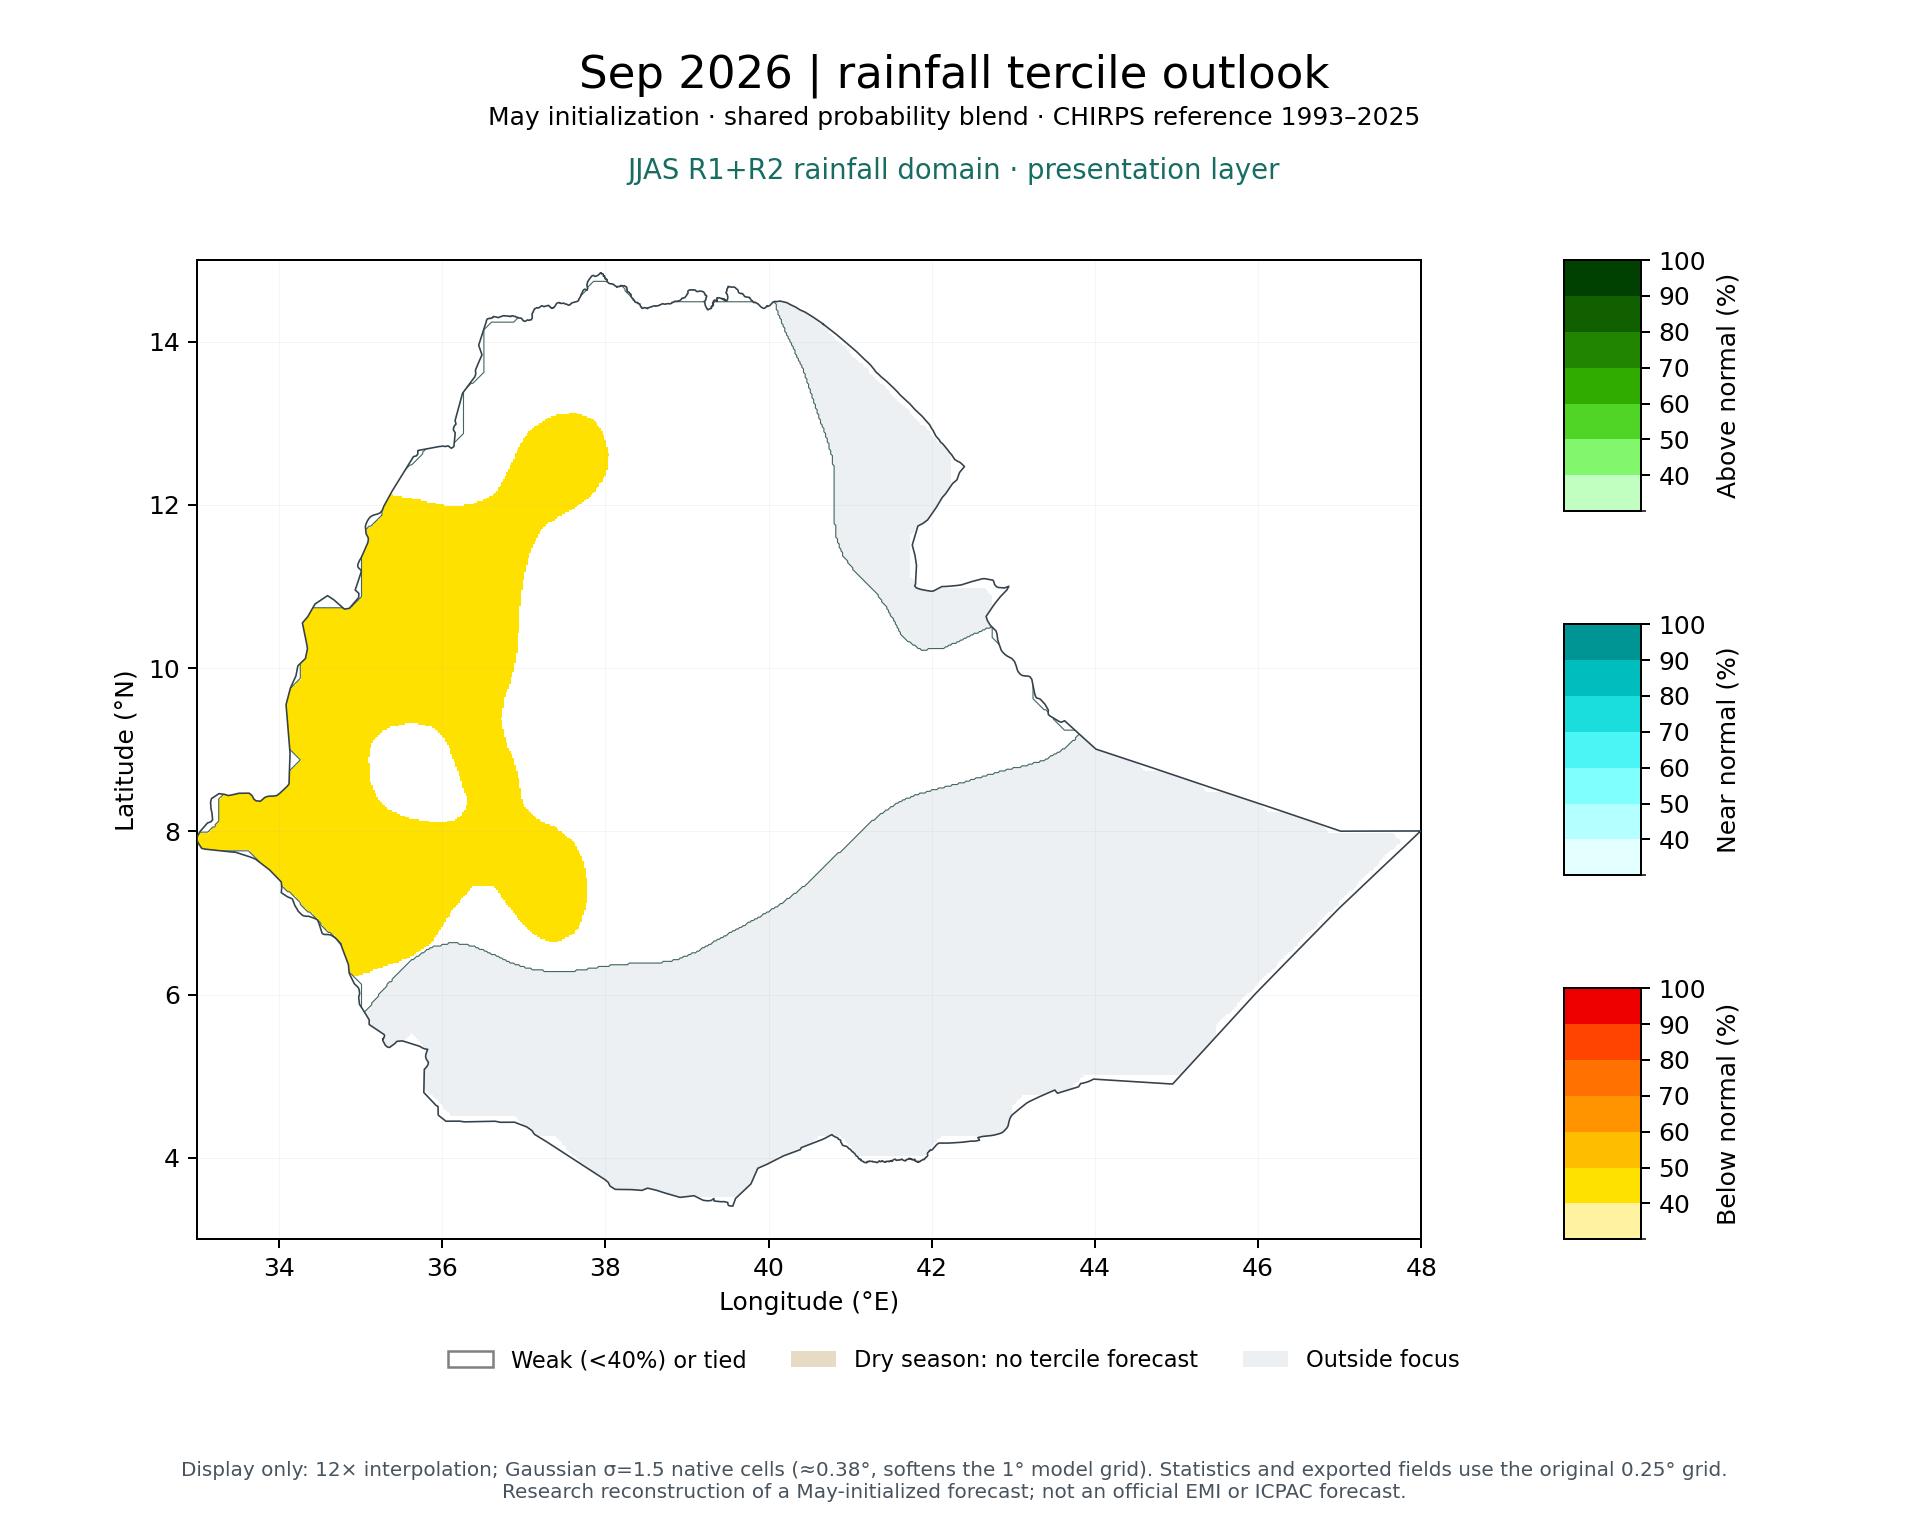
Sep 2026
What happened?
- Rainfall was drier than the reference average by 25 mm (−15%), averaged over the assessed area.
- 54% of the assessed area fell in the below normal tercile.
What did the forecast capture?
- The forecast captured the dry conditions (−31 mm forecast, −25 mm observed).
- The highest average probability (39%) was on the observed below normal category.
- Probabilities scored better than climatology (RPSS +0.086).
- Rainfall amounts scored better than climatology (CRPSS +0.164).
What did it miss?
- Forecast rainfall was 6.6 mm lower than observed, averaged over the assessed area. It overestimated the rainfall deficit by about 27%.
Probability skill (RPSS)+0.086 (8.6% lower score than climatology)
Rainfall amount skill (CRPSS)+0.164 (16.4% lower score than climatology)
Average rainfall error (bias, positive = too wet)−6.6 mm
Observed category distribution (of the assessed area)54% / 34% / 12% below / near / above
Assessed area (share of the selected area)100% probabilities · 100% amounts
Raw benchmark (uncorrected model) RPSS−0.299
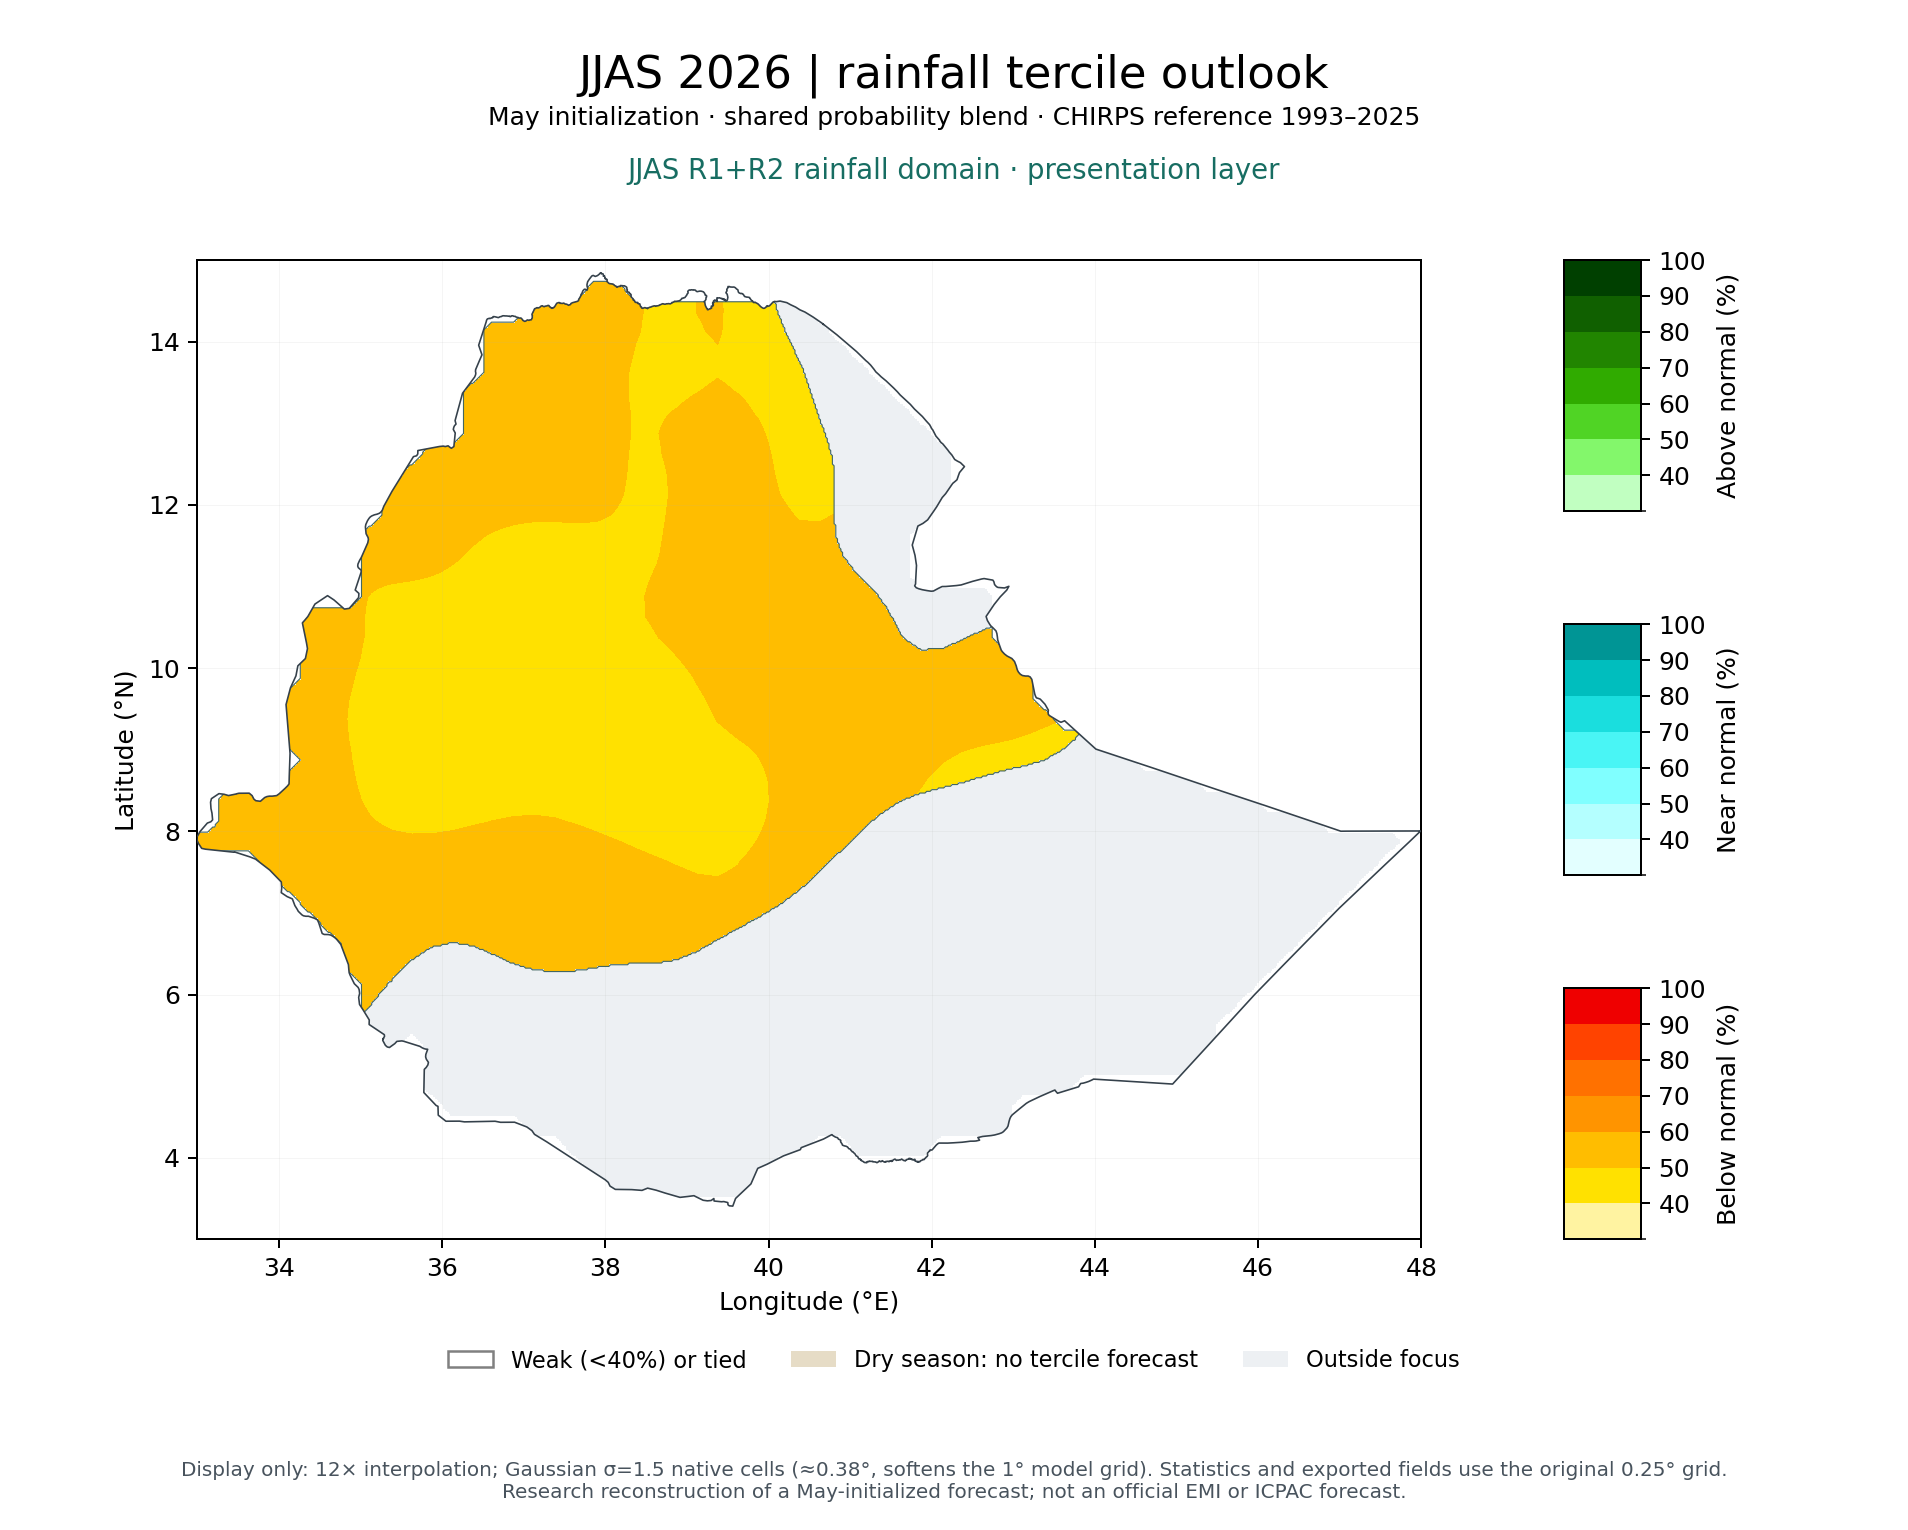 JJAS 2026
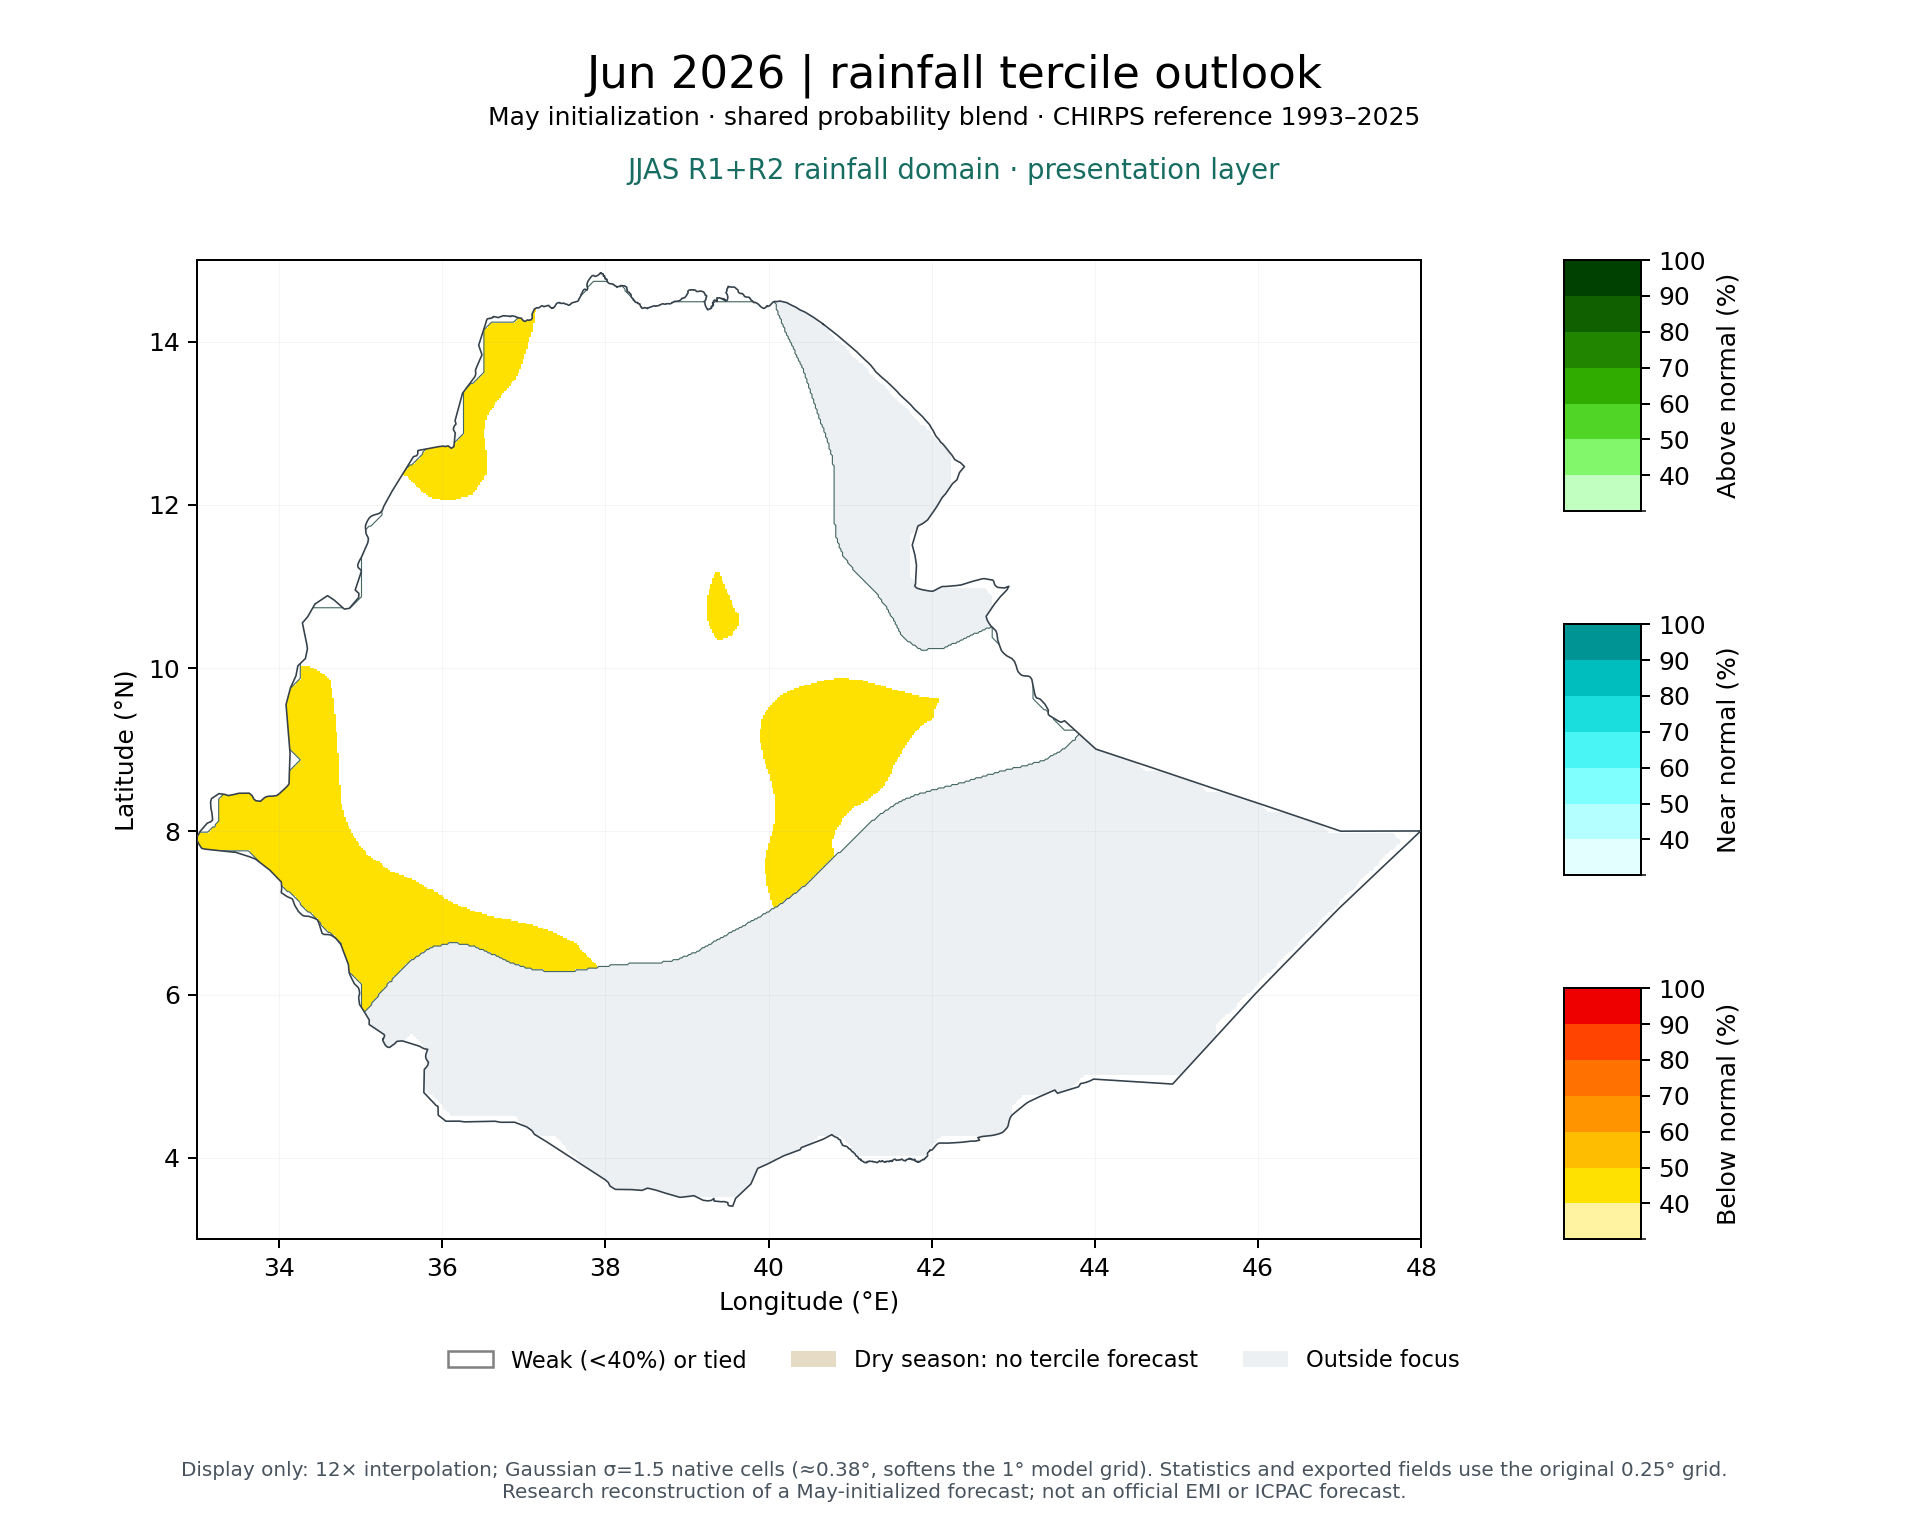 Jun 2026
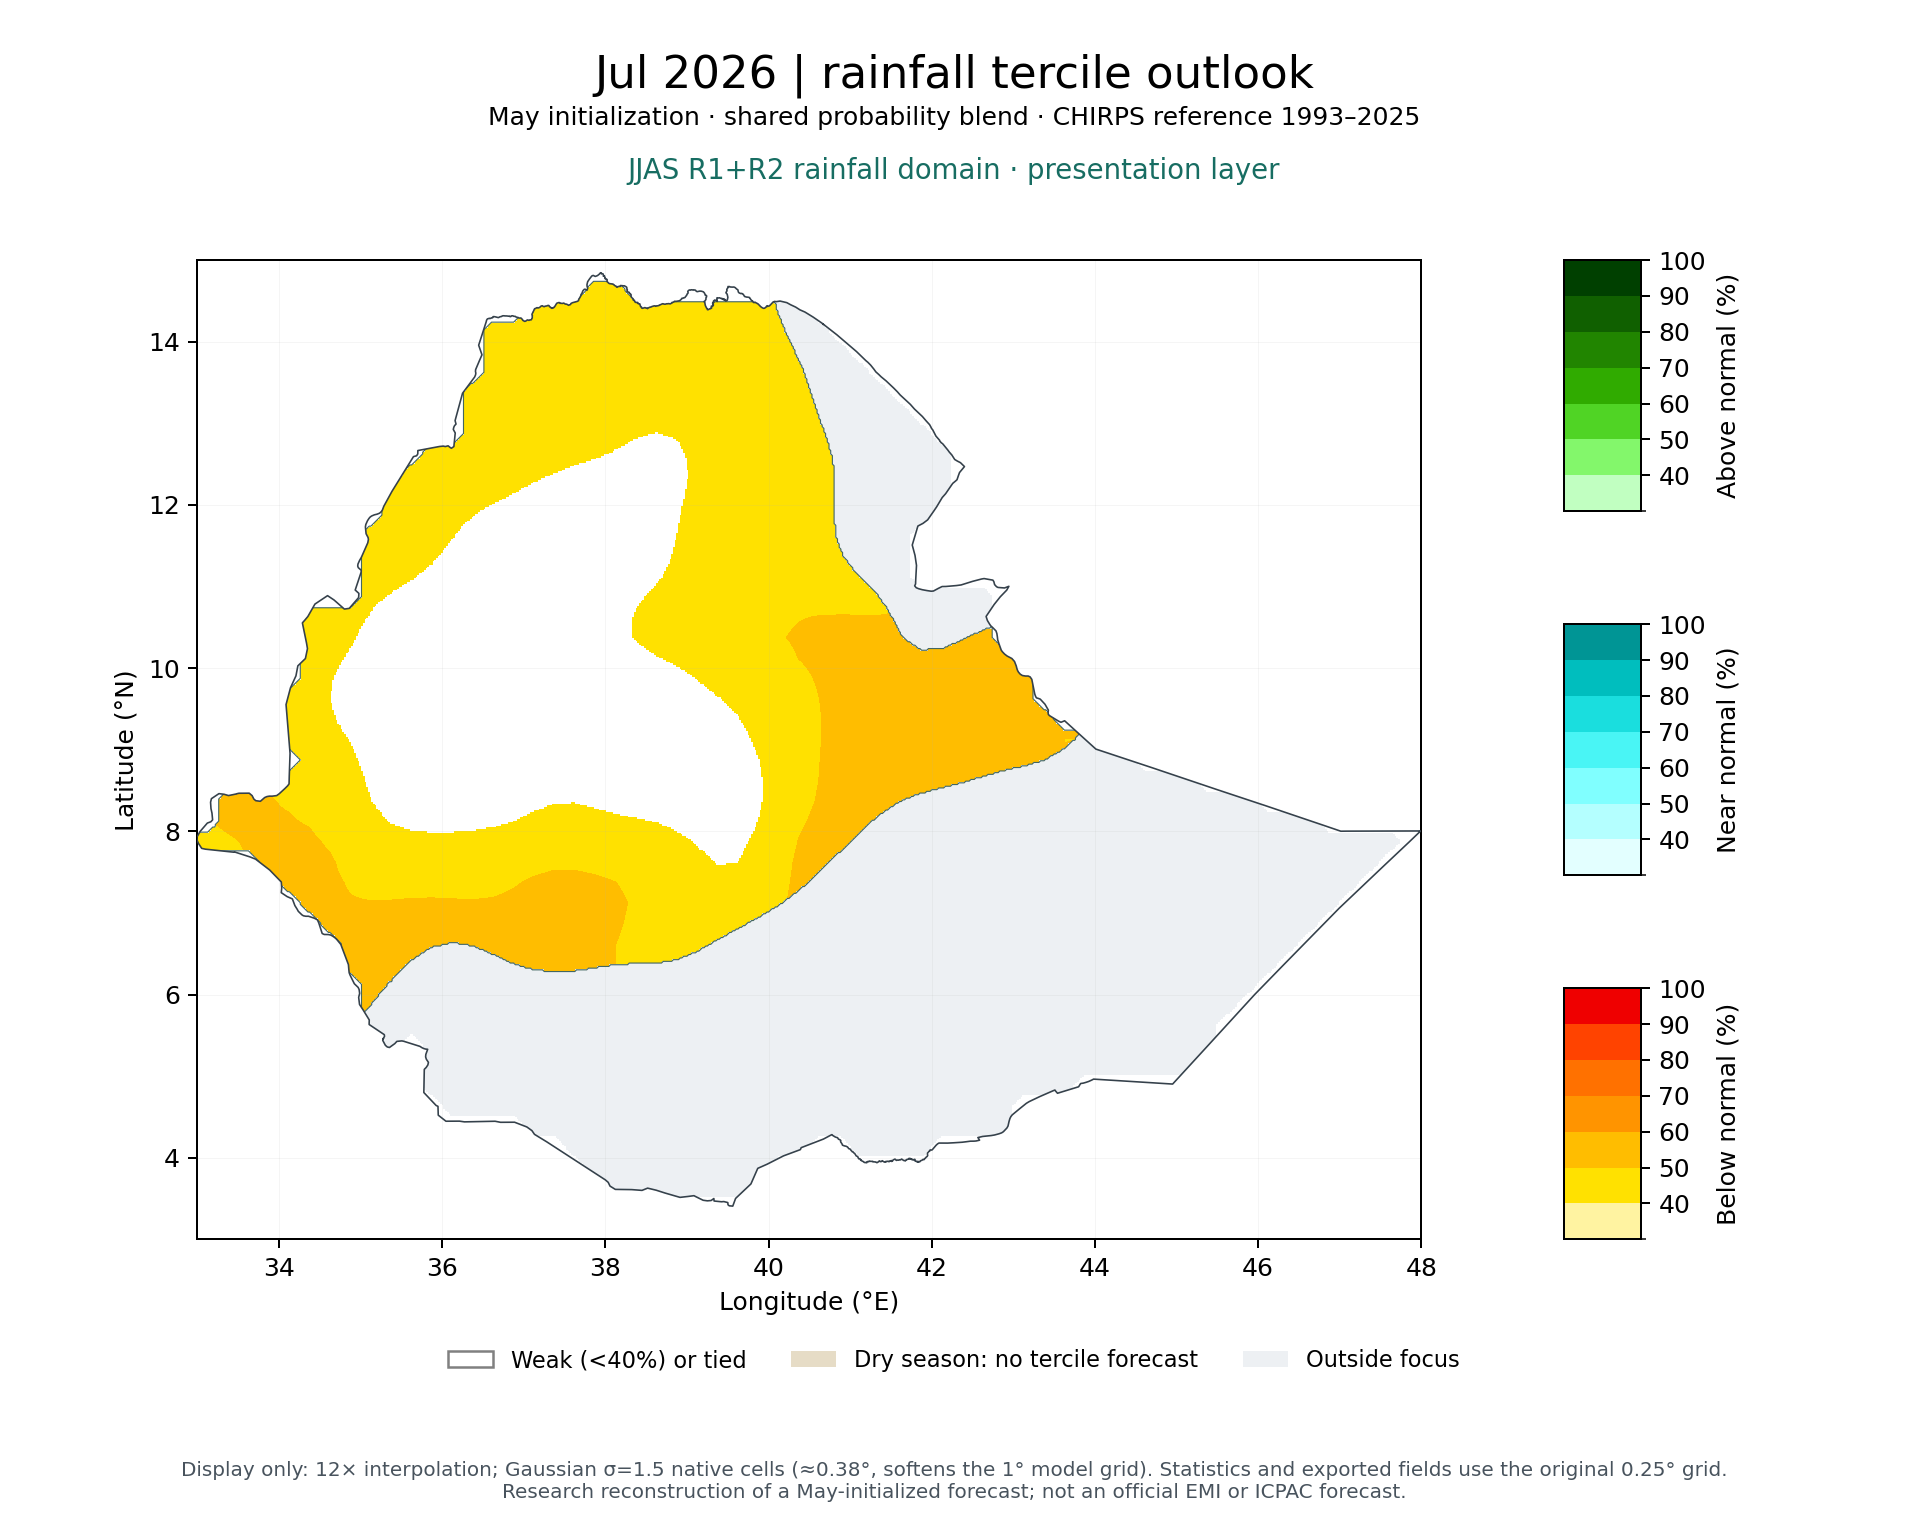 Jul 2026
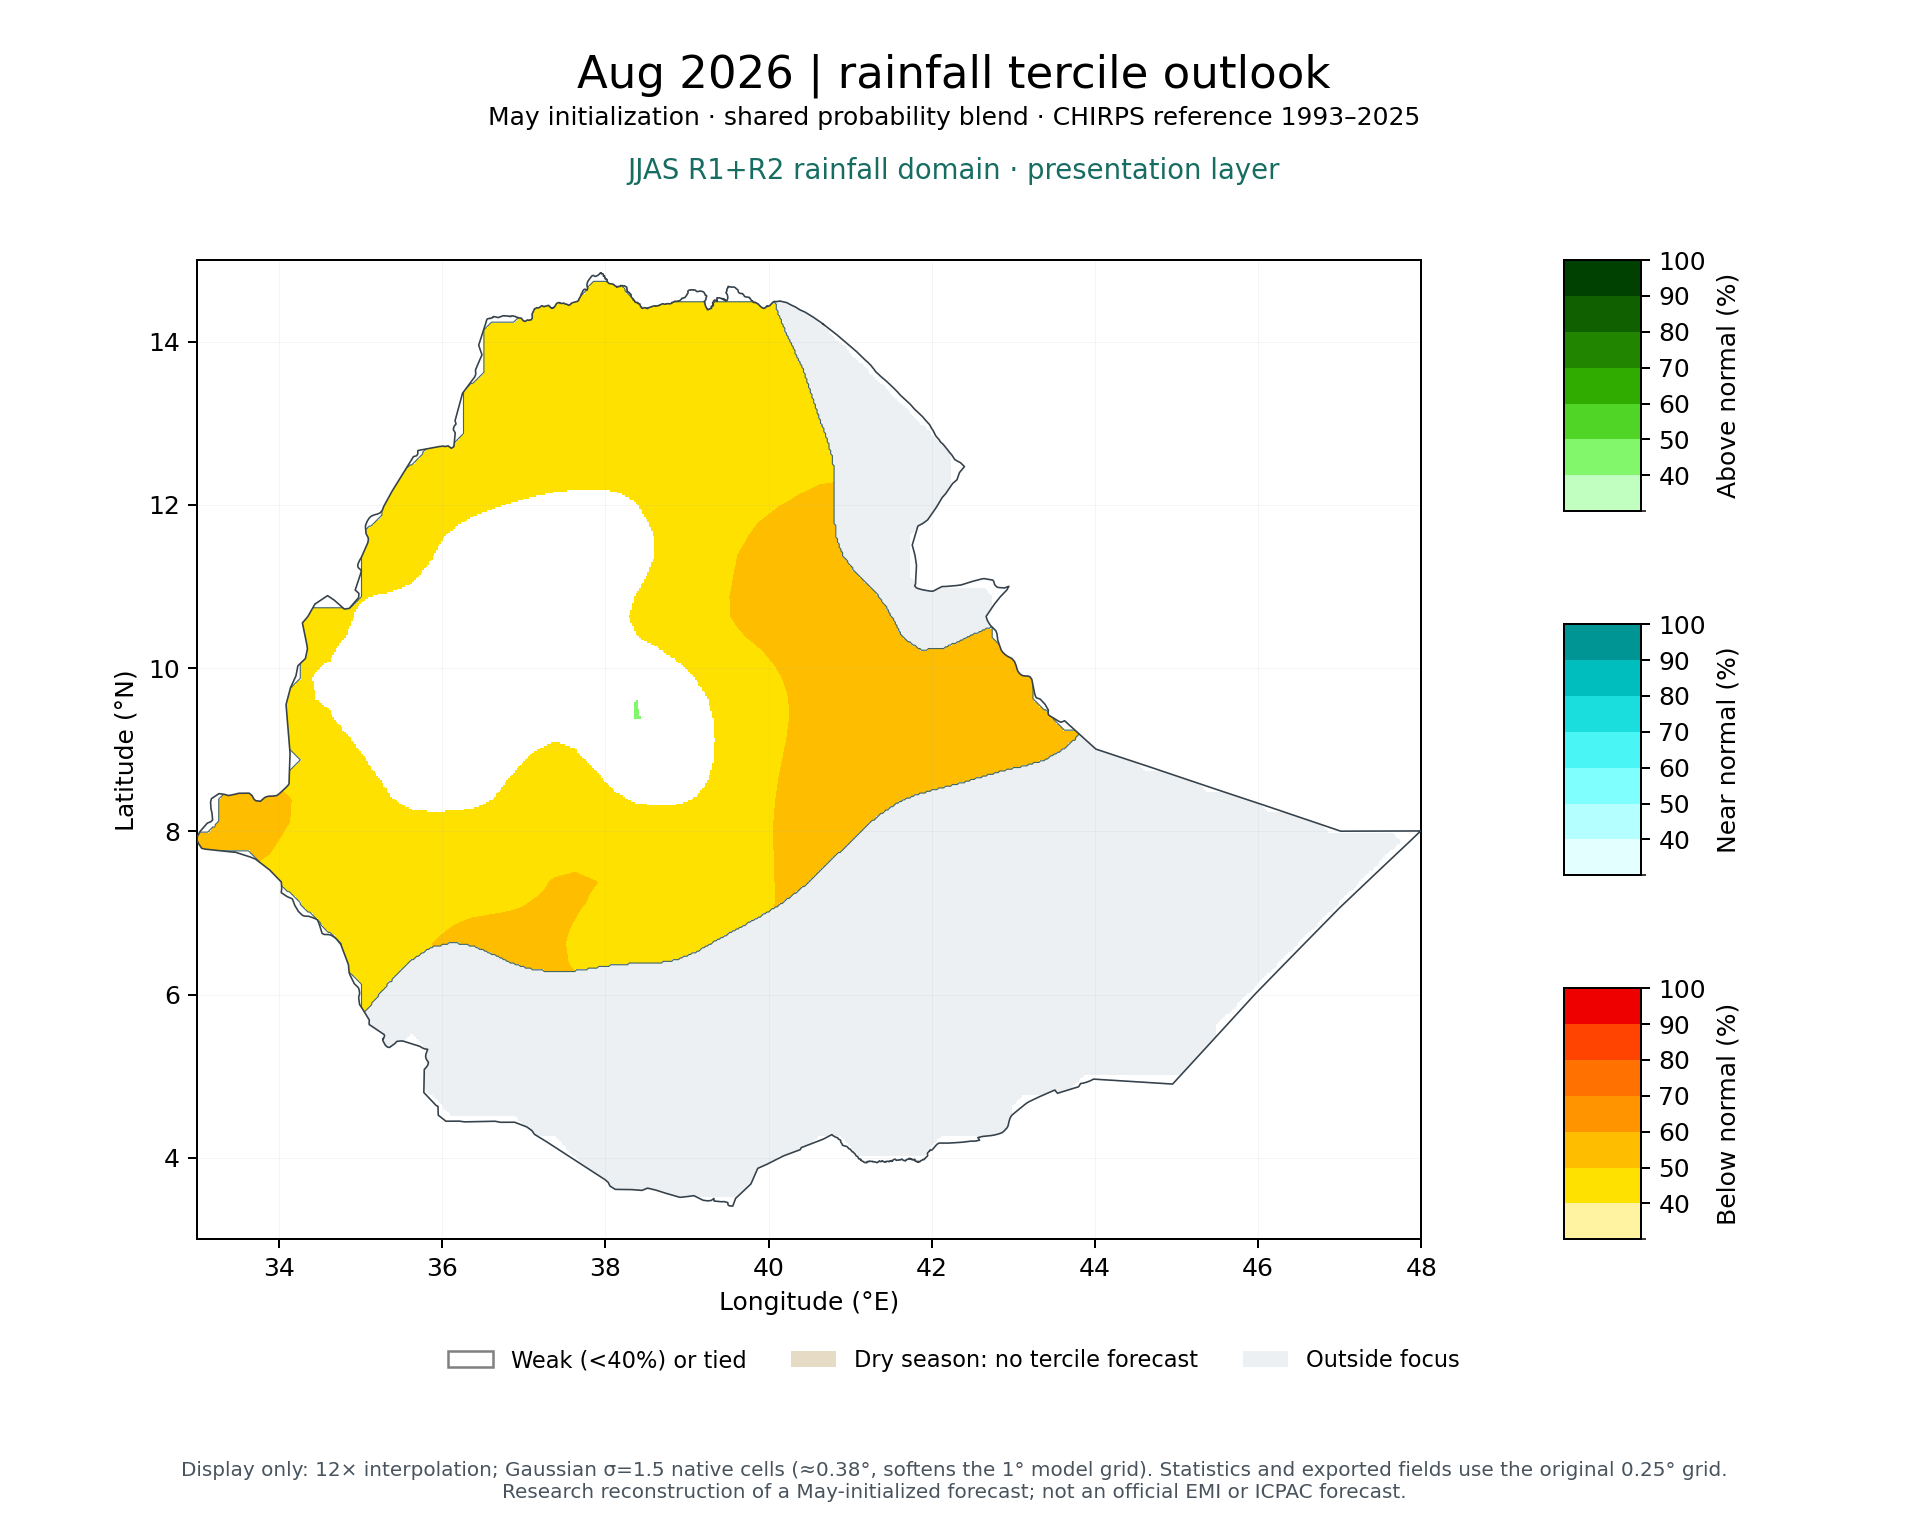 Aug 2026
 Sep 2026