Statistical downscaling (MOS)
Model output statistics as in CPT / PyCPT, the tools ICPAC and IRI use for regional seasonal outlooks: the large-scale pattern of the SEAS5 forecast is related statistically to the observed CHIRPS pattern over the training years, and the relation is applied to the new forecast. Two methods, each tested against the published pipeline with the same data, cross-validation and tests as the other benchmarks.
A comparison, not a published forecast. The published forecasts keep the published approach. A method confirmed here becomes a candidate in the method selection.
The methods
- Predictor: SEAS5 ensemble-mean rainfall over the whole model box, averaged to its 1° cells (180 predictors). Predictand: CHIRPS at every 0.25° cell of Ethiopia. Both on square-root rainfall, standardized with the training years.
- Canonical correlation analysis (CCA): EOF pre-filtering of both fields (up to 6 modes each), then up to 3 canonical modes between their leading principal components.
- Principal component regression (PCR): every CHIRPS cell regressed on the leading predictor principal components (up to 6).
- Choice of modes: inner leave-one-year-out cross-validation inside each fold (smallest mean normalized squared error over the cells).
- Probabilities and amounts: a Gaussian predictive distribution in square-root space with the cross-validated error of the chosen modes: tercile probabilities from it, amounts and 10–90% ranges from 51 of its quantiles.
How it is implemented
Every step is fitted with the training years of the fold only. The full description, with the function behind each step, is in docs/53, section 2.
- Fields. Forecast: the SEAS5 ensemble mean of the target's rainfall, square-rooted and averaged over 4 × 4 blocks of
0.25° cells (180 values). Observation: square-rooted CHIRPS at every 0.25° cell of Ethiopia. Each column is standardized with the
training years:
Xz = (X − mx)/sx,Yz = (Y − my)/sy. - EOFs. Singular value decompositions
Xz = Ux Sx VxᵀandYz = Uy Sy Vyᵀgive principal components of unit variance,Xpc = √n UxandYpc = √n Uy. A new forecast is projected on the first m predictor EOFs. - PCR. Every cell is regressed on the m predictor PCs. As the PCs are uncorrelated with unit variance, the
coefficients are
B = Xpcᵀ Yz / nand the prediction isŷz = xpc B. - CCA. The cross-covariance of m predictor PCs and l predictand PCs,
C = Xpcᵀ Ypc / n = A diag(r) Bᵀ, gives the canonical correlations r and the weights A, B. The forecast's first k canonical variates, multiplied by their correlations, are mapped back to the predictand PCs and through the predictand EOFs to every cell. - Choice of modes. PCR tries m = 1–6; CCA every m, l = 1–6 with k = 1–3 canonical modes (77 combinations). Each training year is left out in turn, everything is refitted on the others and the left-out year predicted. The combination with the smallest squared error, divided by each cell's variance and averaged over the cells that vary from year to year, wins. In practice CCA keeps one canonical mode and PCR one or two PCs.
- Forecast distribution. Gaussian in square-root space: the mean μ from the chosen model refitted on all training
years, the standard deviation σ the cell's cross-validated error. Tercile probabilities:
P(below) = Φ((√q1 − μ)/σ),P(above) = 1 − Φ((√q2 − μ)/σ), with the terciles q1, q2 of the training years' CHIRPS. Amounts: 51 quantiles of the Gaussian, set to zero below zero and squared back; the median and the 10–90% range likewise. No smoothing or climatology blend. - Evaluation. Outer leave-one-year-out over the training years (the choice of modes nested inside each fold), then fitted on all training years for the test years, with the published probabilities and the MVS-corrected ensemble computed in the same folds. One-sided paired sign-flip test over whole years for each method, target and score.
Known limitations: the ensemble mean averages 25 members in 1993–2016 and 51 from 2017; one predictor field (no sea-surface temperature); σ is the same every year; no climatology blend.
January initialization · FMAM and its months
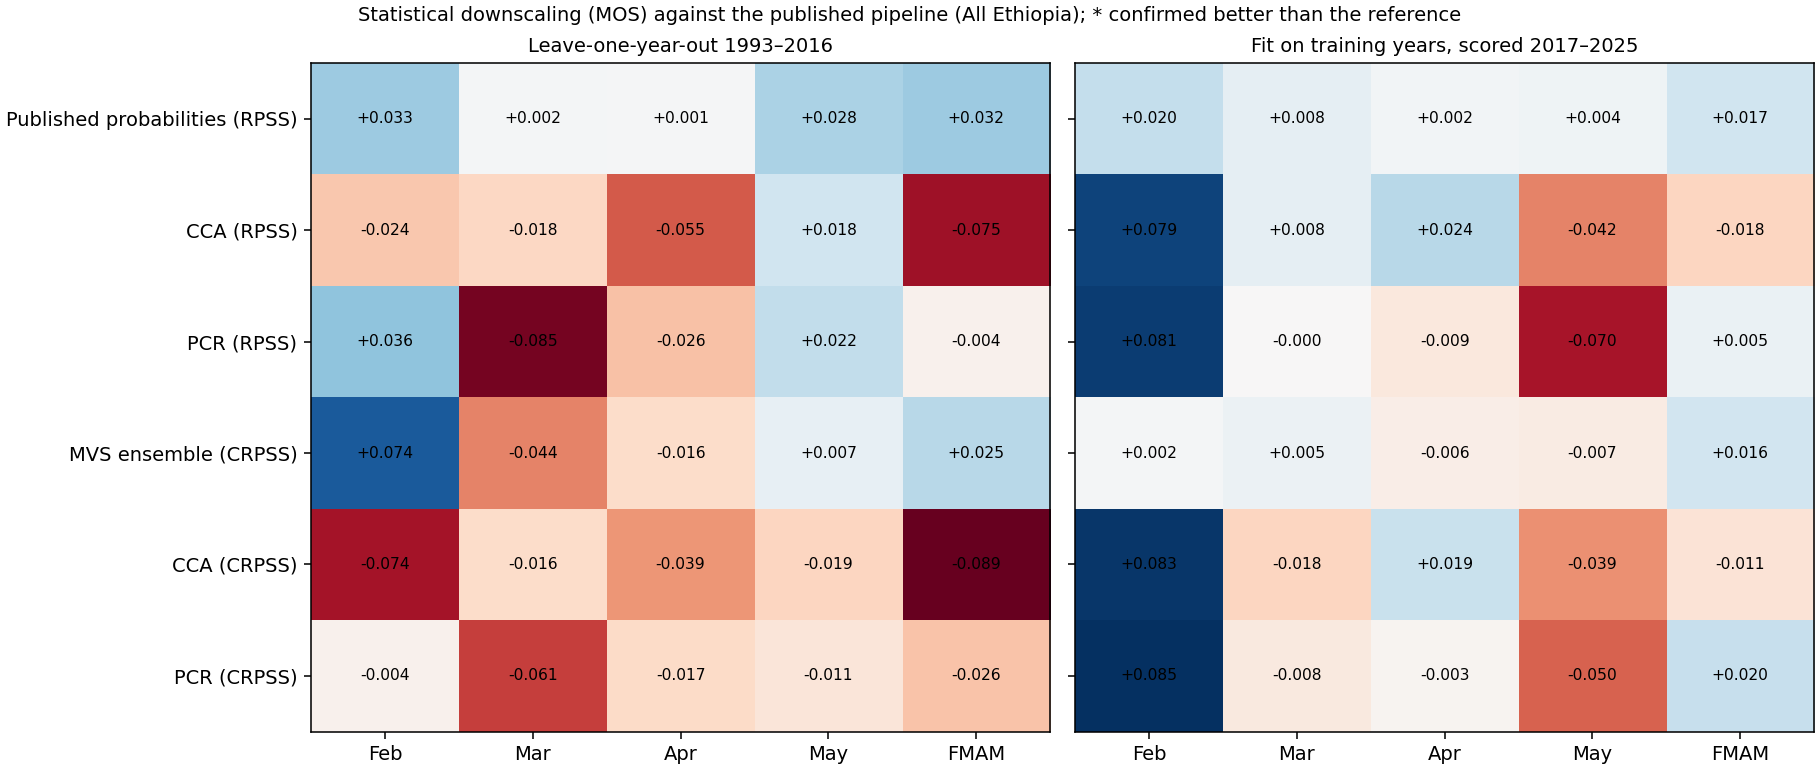
Confirmed better than the published approach under the selection rule (Benjamini–Hochberg): none. In the benchmark as run (Holm): none. Modes most often chosen (predictor EOFs / predictand EOFs / canonical modes), season target: CCA 2 / 1 / 1 (4 of 24 folds), PCR 1 (23 of 24 folds).
Tercile probabilities (RPS)
| Target | Method | RPSS 1993–2016 (LOYO) | RPSS 2017–2025 | ΔRPS vs reference | Holm p | BH p | Years better | ΔRPS (test years) | Benchmark (Holm) | Selection rule (BH) |
|---|---|---|---|---|---|---|---|---|---|---|
| Feb | Published probabilities: MVS -> smoothed counts -> climatology blend | +0.033 | +0.020 | — | — | — | — | — | reference | |
| Feb | Canonical correlation analysis (CCA) | -0.024 | +0.079 | +0.0255 | 1.000 | 0.995 | 14 of 24 | -0.0253 | not confirmed | — |
| Feb | Principal component regression (PCR) | +0.036 | +0.081 | -0.0014 | 1.000 | 0.995 | 13 of 24 | -0.0261 | not confirmed | — |
| Mar | Published probabilities: MVS -> smoothed counts -> climatology blend | +0.002 | +0.008 | — | — | — | — | — | reference | |
| Mar | Canonical correlation analysis (CCA) | -0.018 | +0.008 | +0.0091 | 1.000 | 0.995 | 11 of 24 | -0.0000 | not confirmed | — |
| Mar | Principal component regression (PCR) | -0.085 | -0.000 | +0.0393 | 1.000 | 0.995 | 5 of 24 | +0.0036 | not confirmed; worse over the test years | — |
| Apr | Published probabilities: MVS -> smoothed counts -> climatology blend | +0.001 | +0.002 | — | — | — | — | — | reference | |
| Apr | Canonical correlation analysis (CCA) | -0.055 | +0.024 | +0.0253 | 1.000 | 0.995 | 10 of 24 | -0.0098 | not confirmed | — |
| Apr | Principal component regression (PCR) | -0.026 | -0.009 | +0.0124 | 1.000 | 0.995 | 9 of 24 | +0.0049 | not confirmed; worse over the test years | — |
| May | Published probabilities: MVS -> smoothed counts -> climatology blend | +0.028 | +0.004 | — | — | — | — | — | reference | |
| May | Canonical correlation analysis (CCA) | +0.018 | -0.042 | +0.0048 | 1.000 | 0.995 | 12 of 24 | +0.0198 | not confirmed; worse over the test years | — |
| May | Principal component regression (PCR) | +0.022 | -0.070 | +0.0028 | 1.000 | 0.995 | 14 of 24 | +0.0317 | not confirmed; worse over the test years | — |
| FMAM | Published probabilities: MVS -> smoothed counts -> climatology blend | +0.032 | +0.017 | — | — | — | — | — | reference | |
| FMAM | Canonical correlation analysis (CCA) | -0.075 | -0.018 | +0.0487 | 1.000 | 0.995 | 9 of 24 | +0.0163 | not confirmed; worse over the test years | — |
| FMAM | Principal component regression (PCR) | -0.004 | +0.005 | +0.0163 | 1.000 | 0.995 | 10 of 24 | +0.0053 | not confirmed; worse over the test years | — |
Rainfall amounts (CRPS)
| Target | Method | CRPSS 1993–2016 (LOYO) | CRPSS 2017–2025 | ΔCRPS vs reference | Holm p | BH p | Years better | ΔCRPS (test years) | Benchmark (Holm) | Selection rule (BH) |
|---|---|---|---|---|---|---|---|---|---|---|
| Feb | MVS-corrected ensemble (published amount correction) | +0.074 | +0.002 | — | — | — | — | — | reference | |
| Feb | Canonical correlation analysis (CCA) | -0.074 | +0.083 | +1.2334 | 1.000 | 0.995 | 13 of 24 | -0.7057 | not confirmed | — |
| Feb | Principal component regression (PCR) | -0.004 | +0.085 | +0.6492 | 1.000 | 0.995 | 14 of 24 | -0.7271 | not confirmed | — |
| Mar | MVS-corrected ensemble (published amount correction) | -0.044 | +0.005 | — | — | — | — | — | reference | |
| Mar | Canonical correlation analysis (CCA) | -0.016 | -0.018 | -0.5596 | 1.000 | 0.995 | 14 of 24 | +0.5484 | not confirmed; worse over the test years | — |
| Mar | Principal component regression (PCR) | -0.061 | -0.008 | +0.3557 | 1.000 | 0.995 | 13 of 24 | +0.3137 | not confirmed; worse over the test years | — |
| Apr | MVS-corrected ensemble (published amount correction) | -0.016 | -0.006 | — | — | — | — | — | reference | |
| Apr | Canonical correlation analysis (CCA) | -0.039 | +0.019 | +0.6431 | 1.000 | 0.995 | 11 of 24 | -0.7606 | not confirmed | — |
| Apr | Principal component regression (PCR) | -0.017 | -0.003 | +0.0074 | 1.000 | 0.995 | 12 of 24 | -0.0935 | not confirmed | — |
| May | MVS-corrected ensemble (published amount correction) | +0.007 | -0.007 | — | — | — | — | — | reference | |
| May | Canonical correlation analysis (CCA) | -0.019 | -0.039 | +0.7562 | 1.000 | 0.995 | 14 of 24 | +0.8101 | not confirmed; worse over the test years | — |
| May | Principal component regression (PCR) | -0.011 | -0.050 | +0.5226 | 1.000 | 0.995 | 14 of 24 | +1.0994 | not confirmed; worse over the test years | — |
| FMAM | MVS-corrected ensemble (published amount correction) | +0.025 | +0.016 | — | — | — | — | — | reference | |
| FMAM | Canonical correlation analysis (CCA) | -0.089 | -0.011 | +5.6776 | 1.000 | 0.995 | 8 of 24 | +1.6177 | not confirmed; worse over the test years | — |
| FMAM | Principal component regression (PCR) | -0.026 | +0.020 | +2.5174 | 1.000 | 0.995 | 11 of 24 | -0.2247 | not confirmed | — |
Negative Δ favours the method. Skill against the observed climatology over All Ethiopia; Holm and Benjamini–Hochberg (BH) across both methods and the five targets. The benchmark’s own decision, as run, uses Holm; the method selection applies BH to the same p-values (since 17 October 2026), and a method confirmed under BH is a candidate there.
Independent season 2026
| Target | RPSS published | RPSS CCA | RPSS PCR | CRPSS MVS ensemble | CRPSS CCA | CRPSS PCR |
|---|---|---|---|---|---|---|
| Feb | -0.037 | -0.655 | -0.315 | -0.209 | -0.471 | -0.176 |
| Mar | +0.049 | +0.231 | +0.196 | +0.101 | +0.075 | +0.056 |
| Apr | +0.010 | +0.015 | +0.014 | +0.014 | +0.014 | +0.010 |
| May | +0.028 | +0.028 | +0.034 | +0.032 | +0.020 | +0.019 |
| FMAM | -0.026 | -0.062 | +0.006 | -0.066 | -0.044 | +0.005 |
The forecast year fitted on the reference years, scored against CHIRPS once observed. One season is one validation season, not a verdict.
Download: benchmark.json
February initialization · FMAM and its months
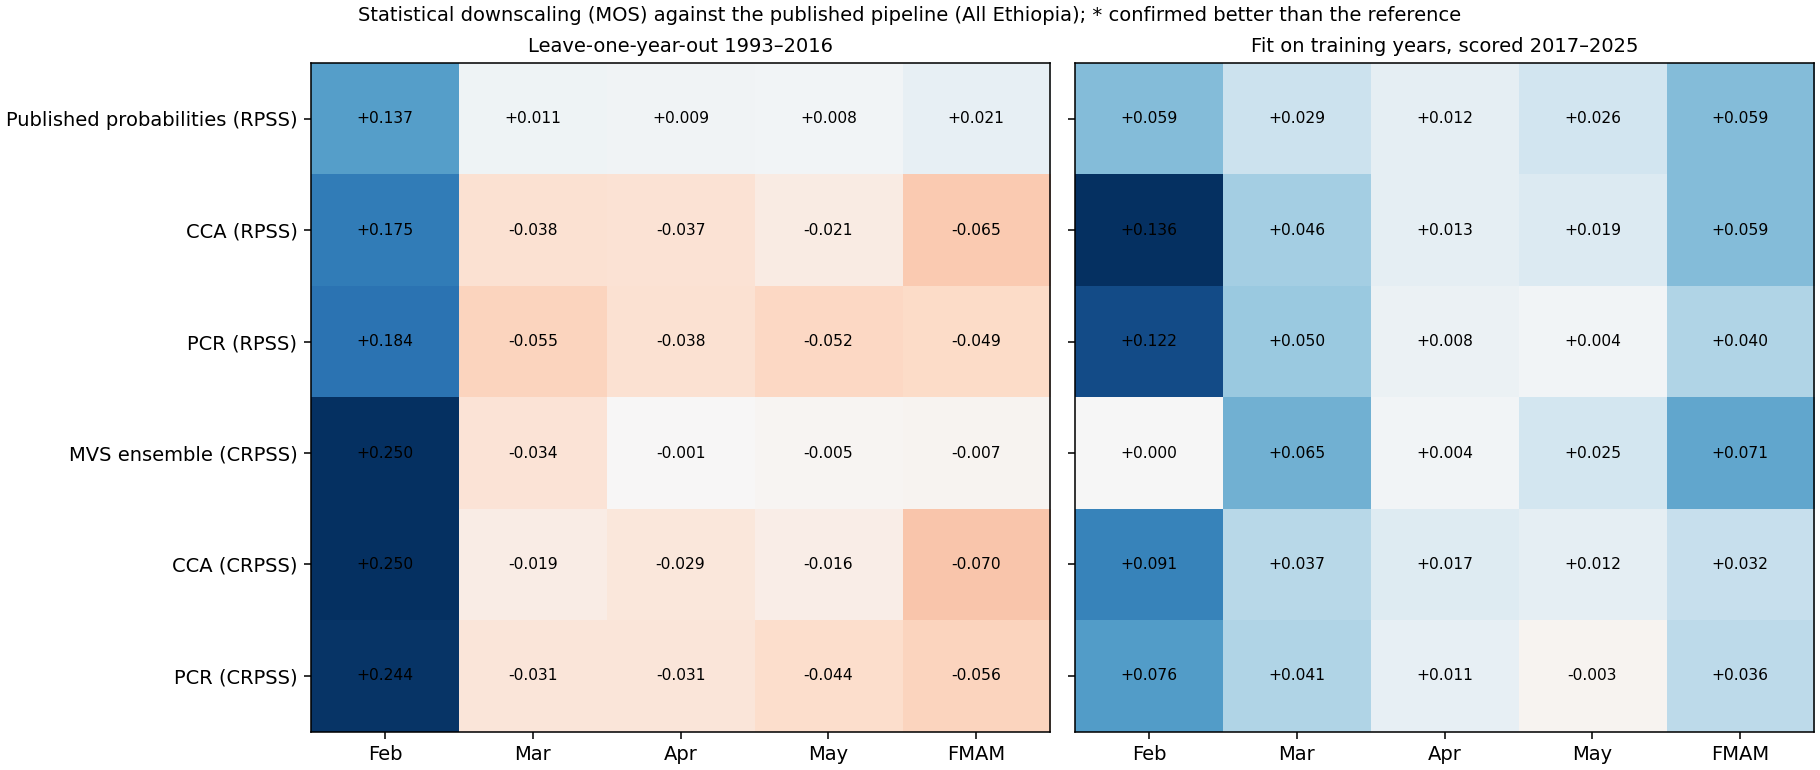
Confirmed better than the published approach under the selection rule (Benjamini–Hochberg): none. In the benchmark as run (Holm): none. Modes most often chosen (predictor EOFs / predictand EOFs / canonical modes), season target: CCA 4 / 1 / 1 (8 of 24 folds), PCR 1 (14 of 24 folds).
Tercile probabilities (RPS)
| Target | Method | RPSS 1993–2016 (LOYO) | RPSS 2017–2025 | ΔRPS vs reference | Holm p | BH p | Years better | ΔRPS (test years) | Benchmark (Holm) | Selection rule (BH) |
|---|---|---|---|---|---|---|---|---|---|---|
| Feb | Published probabilities: MVS -> smoothed counts -> climatology blend | +0.137 | +0.059 | — | — | — | — | — | reference | |
| Feb | Canonical correlation analysis (CCA) | +0.175 | +0.136 | -0.0169 | 1.000 | 0.994 | 13 of 24 | -0.0329 | not confirmed | — |
| Feb | Principal component regression (PCR) | +0.184 | +0.122 | -0.0212 | 1.000 | 0.994 | 12 of 24 | -0.0268 | not confirmed | — |
| Mar | Published probabilities: MVS -> smoothed counts -> climatology blend | +0.011 | +0.029 | — | — | — | — | — | reference | |
| Mar | Canonical correlation analysis (CCA) | -0.038 | +0.046 | +0.0224 | 1.000 | 0.999 | 9 of 24 | -0.0077 | not confirmed | — |
| Mar | Principal component regression (PCR) | -0.055 | +0.050 | +0.0300 | 1.000 | 0.999 | 7 of 24 | -0.0094 | not confirmed | — |
| Apr | Published probabilities: MVS -> smoothed counts -> climatology blend | +0.009 | +0.012 | — | — | — | — | — | reference | |
| Apr | Canonical correlation analysis (CCA) | -0.037 | +0.013 | +0.0209 | 1.000 | 0.999 | 10 of 24 | -0.0002 | not confirmed | — |
| Apr | Principal component regression (PCR) | -0.038 | +0.008 | +0.0213 | 1.000 | 0.999 | 9 of 24 | +0.0019 | not confirmed; worse over the test years | — |
| May | Published probabilities: MVS -> smoothed counts -> climatology blend | +0.008 | +0.026 | — | — | — | — | — | reference | |
| May | Canonical correlation analysis (CCA) | -0.021 | +0.019 | +0.0132 | 1.000 | 0.999 | 13 of 24 | +0.0030 | not confirmed; worse over the test years | — |
| May | Principal component regression (PCR) | -0.052 | +0.004 | +0.0271 | 1.000 | 0.999 | 9 of 24 | +0.0095 | not confirmed; worse over the test years | — |
| FMAM | Published probabilities: MVS -> smoothed counts -> climatology blend | +0.021 | +0.059 | — | — | — | — | — | reference | |
| FMAM | Canonical correlation analysis (CCA) | -0.065 | +0.059 | +0.0389 | 1.000 | 0.999 | 7 of 24 | +0.0001 | not confirmed; worse over the test years | — |
| FMAM | Principal component regression (PCR) | -0.049 | +0.040 | +0.0316 | 1.000 | 0.999 | 7 of 24 | +0.0084 | not confirmed; worse over the test years | — |
Rainfall amounts (CRPS)
| Target | Method | CRPSS 1993–2016 (LOYO) | CRPSS 2017–2025 | ΔCRPS vs reference | Holm p | BH p | Years better | ΔCRPS (test years) | Benchmark (Holm) | Selection rule (BH) |
|---|---|---|---|---|---|---|---|---|---|---|
| Feb | MVS-corrected ensemble (published amount correction) | +0.250 | +0.000 | — | — | — | — | — | reference | |
| Feb | Canonical correlation analysis (CCA) | +0.250 | +0.091 | -0.0006 | 1.000 | 0.934 | 12 of 24 | -0.7610 | not confirmed | — |
| Feb | Principal component regression (PCR) | +0.244 | +0.076 | +0.0457 | 1.000 | 0.934 | 14 of 24 | -0.6371 | not confirmed | — |
| Mar | MVS-corrected ensemble (published amount correction) | -0.034 | +0.065 | — | — | — | — | — | reference | |
| Mar | Canonical correlation analysis (CCA) | -0.019 | +0.037 | -0.3004 | 1.000 | 0.934 | 13 of 24 | +0.6596 | not confirmed; worse over the test years | — |
| Mar | Principal component regression (PCR) | -0.031 | +0.041 | -0.0569 | 1.000 | 0.934 | 11 of 24 | +0.5771 | not confirmed; worse over the test years | — |
| Apr | MVS-corrected ensemble (published amount correction) | -0.001 | +0.004 | — | — | — | — | — | reference | |
| Apr | Canonical correlation analysis (CCA) | -0.029 | +0.017 | +0.8044 | 1.000 | 0.934 | 10 of 24 | -0.4091 | not confirmed | — |
| Apr | Principal component regression (PCR) | -0.031 | +0.011 | +0.8798 | 1.000 | 0.934 | 11 of 24 | -0.2365 | not confirmed | — |
| May | MVS-corrected ensemble (published amount correction) | -0.005 | +0.025 | — | — | — | — | — | reference | |
| May | Canonical correlation analysis (CCA) | -0.016 | +0.012 | +0.3435 | 1.000 | 0.934 | 16 of 24 | +0.3146 | not confirmed; worse over the test years | — |
| May | Principal component regression (PCR) | -0.044 | -0.003 | +1.1445 | 1.000 | 0.934 | 11 of 24 | +0.7146 | not confirmed; worse over the test years | — |
| FMAM | MVS-corrected ensemble (published amount correction) | -0.007 | +0.071 | — | — | — | — | — | reference | |
| FMAM | Canonical correlation analysis (CCA) | -0.070 | +0.032 | +3.1915 | 1.000 | 0.934 | 9 of 24 | +2.2904 | not confirmed; worse over the test years | — |
| FMAM | Principal component regression (PCR) | -0.056 | +0.036 | +2.4653 | 1.000 | 0.934 | 12 of 24 | +2.0570 | not confirmed; worse over the test years | — |
Negative Δ favours the method. Skill against the observed climatology over All Ethiopia; Holm and Benjamini–Hochberg (BH) across both methods and the five targets. The benchmark’s own decision, as run, uses Holm; the method selection applies BH to the same p-values (since 17 October 2026), and a method confirmed under BH is a candidate there.
Independent season 2026
| Target | RPSS published | RPSS CCA | RPSS PCR | CRPSS MVS ensemble | CRPSS CCA | CRPSS PCR |
|---|---|---|---|---|---|---|
| Feb | -0.012 | -0.121 | -0.093 | +0.015 | -0.089 | -0.085 |
| Mar | +0.057 | +0.237 | +0.250 | +0.067 | +0.084 | +0.093 |
| Apr | -0.134 | -0.079 | -0.229 | -0.486 | -0.065 | -0.196 |
| May | +0.002 | -0.159 | -0.163 | -0.032 | -0.179 | -0.190 |
| FMAM | -0.013 | -0.058 | +0.112 | -0.091 | -0.055 | +0.058 |
The forecast year fitted on the reference years, scored against CHIRPS once observed. One season is one validation season, not a verdict.
Download: benchmark.json
May initialization · JJAS and its months
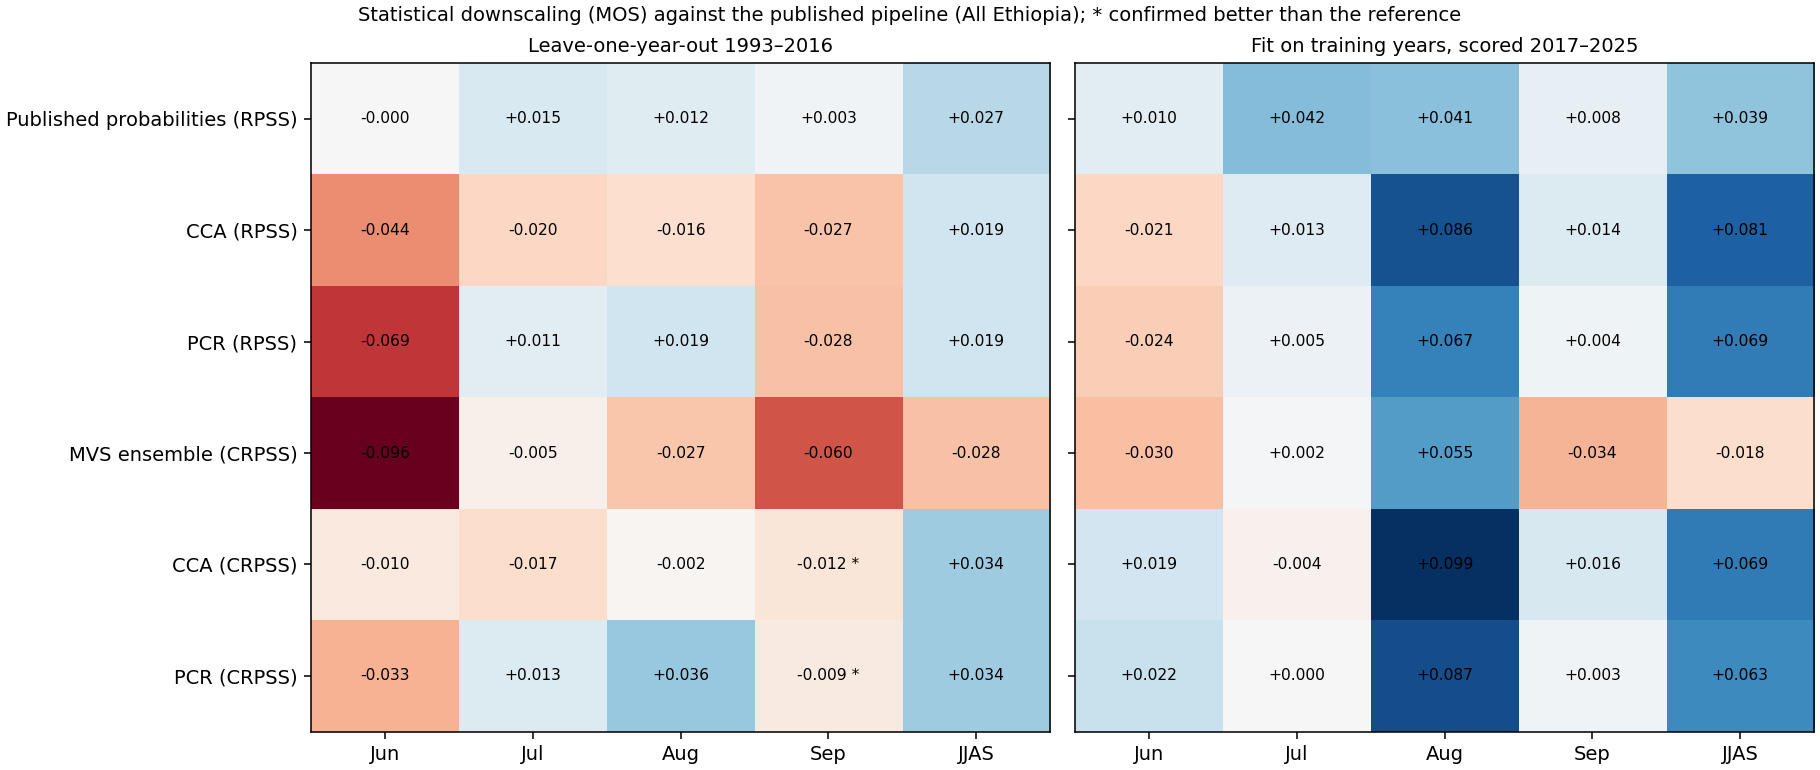
Confirmed better than the published approach under the selection rule (Benjamini–Hochberg): Principal component regression (PCR) for JJAS (CRPS); Principal component regression (PCR) for Aug (CRPS); Canonical correlation analysis (CCA) for Sep (CRPS); Principal component regression (PCR) for Sep (CRPS). In the benchmark as run (Holm): Canonical correlation analysis (CCA) for Sep (CRPS); Principal component regression (PCR) for Sep (CRPS). Modes most often chosen (predictor EOFs / predictand EOFs / canonical modes), season target: CCA 1 / 2 / 1 (21 of 24 folds), PCR 1 (24 of 24 folds).
Tercile probabilities (RPS)
| Target | Method | RPSS 1993–2016 (LOYO) | RPSS 2017–2025 | ΔRPS vs reference | Holm p | BH p | Years better | ΔRPS (test years) | Benchmark (Holm) | Selection rule (BH) |
|---|---|---|---|---|---|---|---|---|---|---|
| Jun | Published probabilities: MVS -> smoothed counts -> climatology blend | -0.000 | +0.010 | — | — | — | — | — | reference | |
| Jun | Canonical correlation analysis (CCA) | -0.044 | -0.021 | +0.0200 | 1.000 | 0.999 | 6 of 24 | +0.0144 | not confirmed; worse over the test years | — |
| Jun | Principal component regression (PCR) | -0.069 | -0.024 | +0.0309 | 1.000 | 0.999 | 6 of 24 | +0.0160 | not confirmed; worse over the test years | — |
| Jul | Published probabilities: MVS -> smoothed counts -> climatology blend | +0.015 | +0.042 | — | — | — | — | — | reference | |
| Jul | Canonical correlation analysis (CCA) | -0.020 | +0.013 | +0.0157 | 1.000 | 0.999 | 10 of 24 | +0.0138 | not confirmed; worse over the test years | — |
| Jul | Principal component regression (PCR) | +0.011 | +0.005 | +0.0017 | 1.000 | 0.999 | 13 of 24 | +0.0172 | not confirmed; worse over the test years | — |
| Aug | Published probabilities: MVS -> smoothed counts -> climatology blend | +0.012 | +0.041 | — | — | — | — | — | reference | |
| Aug | Canonical correlation analysis (CCA) | -0.016 | +0.086 | +0.0125 | 1.000 | 0.999 | 12 of 24 | -0.0203 | not confirmed | — |
| Aug | Principal component regression (PCR) | +0.019 | +0.067 | -0.0033 | 1.000 | 0.999 | 9 of 24 | -0.0117 | not confirmed | — |
| Sep | Published probabilities: MVS -> smoothed counts -> climatology blend | +0.003 | +0.008 | — | — | — | — | — | reference | |
| Sep | Canonical correlation analysis (CCA) | -0.027 | +0.014 | +0.0137 | 1.000 | 0.999 | 9 of 24 | -0.0025 | not confirmed | — |
| Sep | Principal component regression (PCR) | -0.028 | +0.004 | +0.0140 | 1.000 | 0.999 | 12 of 24 | +0.0019 | not confirmed; worse over the test years | — |
| JJAS | Published probabilities: MVS -> smoothed counts -> climatology blend | +0.027 | +0.039 | — | — | — | — | — | reference | |
| JJAS | Canonical correlation analysis (CCA) | +0.019 | +0.081 | +0.0034 | 1.000 | 0.999 | 11 of 24 | -0.0189 | not confirmed | — |
| JJAS | Principal component regression (PCR) | +0.019 | +0.069 | +0.0036 | 1.000 | 0.999 | 10 of 24 | -0.0135 | not confirmed | — |
Rainfall amounts (CRPS)
| Target | Method | CRPSS 1993–2016 (LOYO) | CRPSS 2017–2025 | ΔCRPS vs reference | Holm p | BH p | Years better | ΔCRPS (test years) | Benchmark (Holm) | Selection rule (BH) |
|---|---|---|---|---|---|---|---|---|---|---|
| Jun | MVS-corrected ensemble (published amount correction) | -0.096 | -0.030 | — | — | — | — | — | reference | |
| Jun | Canonical correlation analysis (CCA) | -0.010 | +0.019 | -1.4204 | 0.253 | 0.084 | 19 of 24 | -0.9272 | not confirmed | — |
| Jun | Principal component regression (PCR) | -0.033 | +0.022 | -1.0337 | 0.267 | 0.095 | 19 of 24 | -0.9787 | not confirmed | — |
| Jul | MVS-corrected ensemble (published amount correction) | -0.005 | +0.002 | — | — | — | — | — | reference | |
| Jul | Canonical correlation analysis (CCA) | -0.017 | -0.004 | +0.3016 | 0.689 | 0.689 | 12 of 24 | +0.1424 | not confirmed; worse over the test years | — |
| Jul | Principal component regression (PCR) | +0.013 | +0.000 | -0.4247 | 0.497 | 0.266 | 15 of 24 | +0.0375 | not confirmed; worse over the test years | — |
| Aug | MVS-corrected ensemble (published amount correction) | -0.027 | +0.055 | — | — | — | — | — | reference | |
| Aug | Canonical correlation analysis (CCA) | -0.002 | +0.099 | -0.5148 | 0.497 | 0.207 | 15 of 24 | -1.0149 | not confirmed | — |
| Aug | Principal component regression (PCR) | +0.036 | +0.087 | -1.3089 | 0.059 | 0.025 | 16 of 24 | -0.7517 | not confirmed | ✓ candidate |
| Sep | MVS-corrected ensemble (published amount correction) | -0.060 | -0.034 | — | — | — | — | — | reference | |
| Sep | Canonical correlation analysis (CCA) | -0.012 | +0.016 | -0.8847 | 0.036 | 0.020 | 17 of 24 | -0.9786 | ✓ confirmed better | ✓ candidate |
| Sep | Principal component regression (PCR) | -0.009 | +0.003 | -0.9359 | 0.023 | 0.020 | 18 of 24 | -0.7307 | ✓ confirmed better | ✓ candidate |
| JJAS | MVS-corrected ensemble (published amount correction) | -0.028 | -0.018 | — | — | — | — | — | reference | |
| JJAS | Canonical correlation analysis (CCA) | +0.034 | +0.069 | -2.9100 | 0.190 | 0.063 | 17 of 24 | -3.9423 | not confirmed | — |
| JJAS | Principal component regression (PCR) | +0.034 | +0.063 | -2.9036 | 0.124 | 0.044 | 17 of 24 | -3.6391 | not confirmed | ✓ candidate |
Negative Δ favours the method. Skill against the observed climatology over All Ethiopia; Holm and Benjamini–Hochberg (BH) across both methods and the five targets. The benchmark’s own decision, as run, uses Holm; the method selection applies BH to the same p-values (since 17 October 2026), and a method confirmed under BH is a candidate there.
Independent season 2026
| Target | RPSS published | RPSS CCA | RPSS PCR | CRPSS MVS ensemble | CRPSS CCA | CRPSS PCR |
|---|---|---|---|---|---|---|
| Jun | +0.125 | +0.298 | +0.127 | +0.404 | +0.290 | +0.252 |
| Jul | +0.198 | +0.412 | +0.288 | +0.227 | +0.380 | +0.384 |
| Aug | +0.277 | +0.464 | +0.324 | +0.430 | +0.429 | +0.310 |
| Sep | +0.107 | +0.155 | +0.238 | +0.182 | +0.081 | +0.117 |
| JJAS | +0.352 | +0.521 | +0.465 | +0.532 | +0.411 | +0.408 |
The forecast year fitted on the reference years, scored against CHIRPS once observed. One season is one validation season, not a verdict.
Download: benchmark.json
September initialization · ONDJ and its months
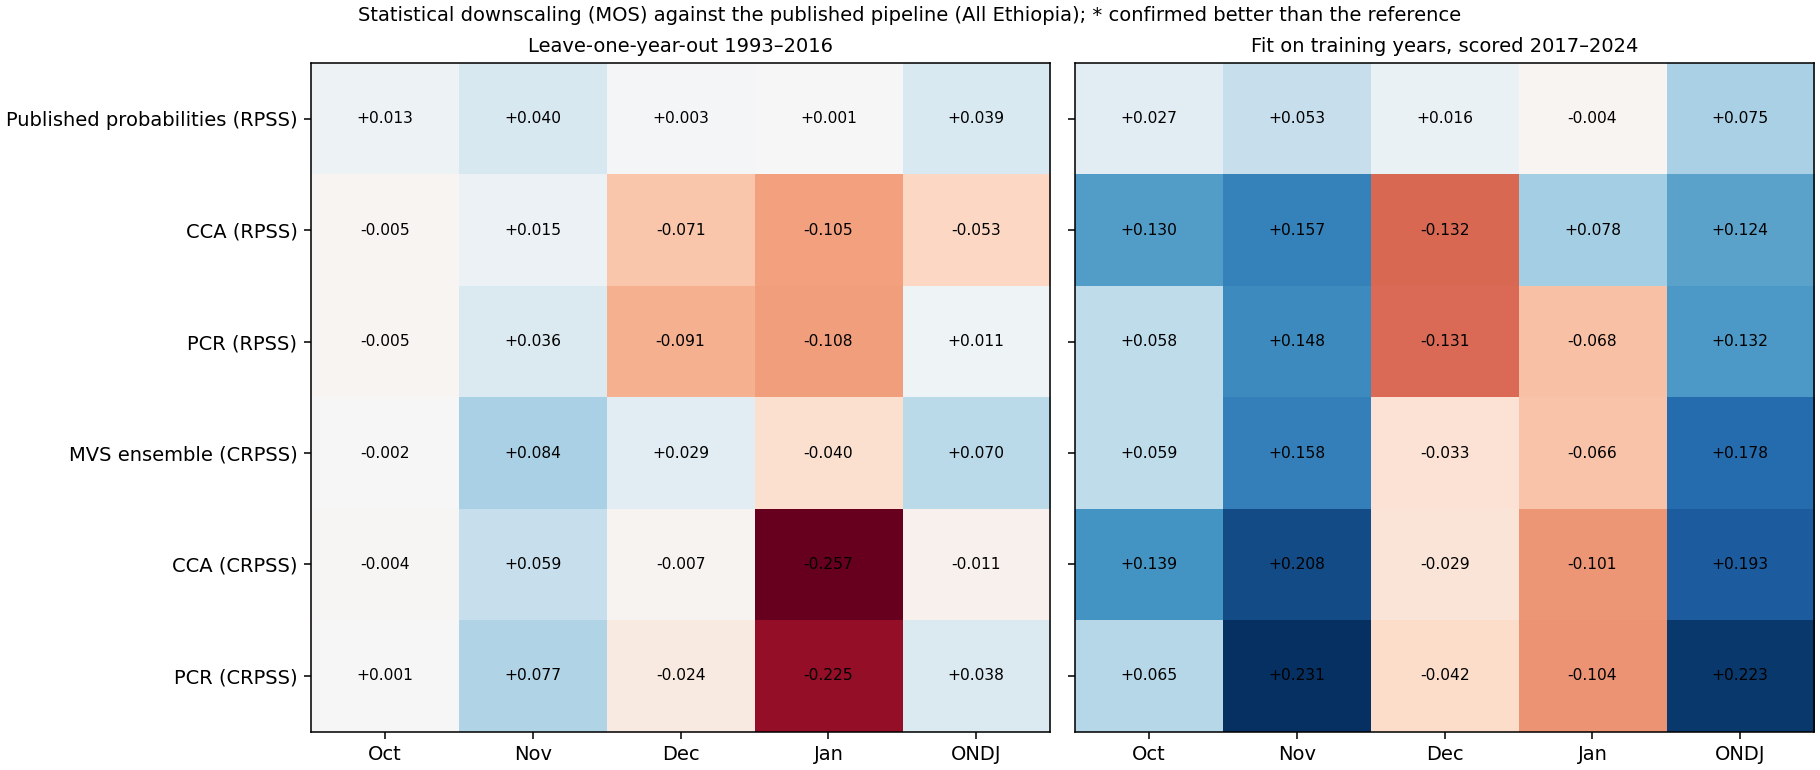
Confirmed better than the published approach under the selection rule (Benjamini–Hochberg): none. In the benchmark as run (Holm): none. Modes most often chosen (predictor EOFs / predictand EOFs / canonical modes), season target: CCA 1 / 1 / 1 (11 of 24 folds), PCR 1 (24 of 24 folds).
Tercile probabilities (RPS)
| Target | Method | RPSS 1993–2016 (LOYO) | RPSS 2017–2024 | ΔRPS vs reference | Holm p | BH p | Years better | ΔRPS (test years) | Benchmark (Holm) | Selection rule (BH) |
|---|---|---|---|---|---|---|---|---|---|---|
| Oct | Published probabilities: MVS -> smoothed counts -> climatology blend | +0.013 | +0.027 | — | — | — | — | — | reference | |
| Oct | Canonical correlation analysis (CCA) | -0.005 | +0.130 | +0.0079 | 1.000 | 0.992 | 12 of 24 | -0.0445 | not confirmed | — |
| Oct | Principal component regression (PCR) | -0.005 | +0.058 | +0.0080 | 1.000 | 0.992 | 13 of 24 | -0.0134 | not confirmed | — |
| Nov | Published probabilities: MVS -> smoothed counts -> climatology blend | +0.040 | +0.053 | — | — | — | — | — | reference | |
| Nov | Canonical correlation analysis (CCA) | +0.015 | +0.157 | +0.0116 | 1.000 | 0.992 | 12 of 24 | -0.0456 | not confirmed | — |
| Nov | Principal component regression (PCR) | +0.036 | +0.148 | +0.0018 | 1.000 | 0.992 | 12 of 24 | -0.0418 | not confirmed | — |
| Dec | Published probabilities: MVS -> smoothed counts -> climatology blend | +0.003 | +0.016 | — | — | — | — | — | reference | |
| Dec | Canonical correlation analysis (CCA) | -0.071 | -0.132 | +0.0336 | 1.000 | 0.992 | 10 of 24 | +0.0683 | not confirmed; worse over the test years | — |
| Dec | Principal component regression (PCR) | -0.091 | -0.131 | +0.0428 | 1.000 | 0.992 | 9 of 24 | +0.0678 | not confirmed; worse over the test years | — |
| Jan | Published probabilities: MVS -> smoothed counts -> climatology blend | +0.001 | -0.004 | — | — | — | — | — | reference | |
| Jan | Canonical correlation analysis (CCA) | -0.105 | +0.078 | +0.0482 | 1.000 | 0.992 | 14 of 24 | -0.0375 | not confirmed | — |
| Jan | Principal component regression (PCR) | -0.108 | -0.068 | +0.0496 | 1.000 | 0.992 | 10 of 24 | +0.0287 | not confirmed; worse over the test years | — |
| ONDJ | Published probabilities: MVS -> smoothed counts -> climatology blend | +0.039 | +0.075 | — | — | — | — | — | reference | |
| ONDJ | Canonical correlation analysis (CCA) | -0.053 | +0.124 | +0.0418 | 1.000 | 0.992 | 7 of 24 | -0.0227 | not confirmed | — |
| ONDJ | Principal component regression (PCR) | +0.011 | +0.132 | +0.0131 | 1.000 | 0.992 | 14 of 24 | -0.0263 | not confirmed | — |
Rainfall amounts (CRPS)
| Target | Method | CRPSS 1993–2016 (LOYO) | CRPSS 2017–2024 | ΔCRPS vs reference | Holm p | BH p | Years better | ΔCRPS (test years) | Benchmark (Holm) | Selection rule (BH) |
|---|---|---|---|---|---|---|---|---|---|---|
| Oct | MVS-corrected ensemble (published amount correction) | -0.002 | +0.059 | — | — | — | — | — | reference | |
| Oct | Canonical correlation analysis (CCA) | -0.004 | +0.139 | +0.0535 | 1.000 | 0.991 | 13 of 24 | -2.4358 | not confirmed | — |
| Oct | Principal component regression (PCR) | +0.001 | +0.065 | -0.0734 | 1.000 | 0.991 | 14 of 24 | -0.1923 | not confirmed | — |
| Nov | MVS-corrected ensemble (published amount correction) | +0.084 | +0.158 | — | — | — | — | — | reference | |
| Nov | Canonical correlation analysis (CCA) | +0.059 | +0.208 | +0.4868 | 1.000 | 0.991 | 11 of 24 | -1.1601 | not confirmed | — |
| Nov | Principal component regression (PCR) | +0.077 | +0.231 | +0.1393 | 1.000 | 0.991 | 11 of 24 | -1.7099 | not confirmed | — |
| Dec | MVS-corrected ensemble (published amount correction) | +0.029 | -0.033 | — | — | — | — | — | reference | |
| Dec | Canonical correlation analysis (CCA) | -0.007 | -0.029 | +0.2848 | 1.000 | 0.991 | 9 of 24 | -0.0170 | not confirmed | — |
| Dec | Principal component regression (PCR) | -0.024 | -0.042 | +0.4192 | 1.000 | 0.991 | 9 of 24 | +0.0484 | not confirmed; worse over the test years | — |
| Jan | MVS-corrected ensemble (published amount correction) | -0.040 | -0.066 | — | — | — | — | — | reference | |
| Jan | Canonical correlation analysis (CCA) | -0.257 | -0.101 | +1.7553 | 1.000 | 0.991 | 16 of 24 | +0.1981 | not confirmed; worse over the test years | — |
| Jan | Principal component regression (PCR) | -0.225 | -0.104 | +1.4996 | 1.000 | 0.991 | 15 of 24 | +0.2111 | not confirmed; worse over the test years | — |
| ONDJ | MVS-corrected ensemble (published amount correction) | +0.070 | +0.178 | — | — | — | — | — | reference | |
| ONDJ | Canonical correlation analysis (CCA) | -0.011 | +0.193 | +3.6671 | 1.000 | 0.991 | 9 of 24 | -0.7363 | not confirmed | — |
| ONDJ | Principal component regression (PCR) | +0.038 | +0.223 | +1.4488 | 1.000 | 0.991 | 13 of 24 | -2.2574 | not confirmed | — |
Negative Δ favours the method. Skill against the observed climatology over All Ethiopia; Holm and Benjamini–Hochberg (BH) across both methods and the five targets. The benchmark’s own decision, as run, uses Holm; the method selection applies BH to the same p-values (since 17 October 2026), and a method confirmed under BH is a candidate there.
Download: benchmark.json
Code: scripts/mos_benchmark.py · write-up: docs/53.