Verification · Feb 2026
Frozen forecasts compared with official CHIRPS v3.0 observations once a target period is complete. Each result is one season or month, so it shows what happened this time, not long-term reliability.
The selected target comes first; the other verified targets of the cycle follow. Maps: forecast and observed anomaly side by side.
Forecast vs observed rainfall anomaly, FMAM rainfall contribution domain (mm)
Forecast anomalyObserved anomaly
Area-mean anomalies against the 1993–2025 CHIRPS average. Probability skill (RPSS) refers to the blended probabilities; rainfall amount skill (CRPSS) and bias to the amount-corrected ensemble. Skill scores are decimals: +0.193 means a 19.3% lower score than climatology.
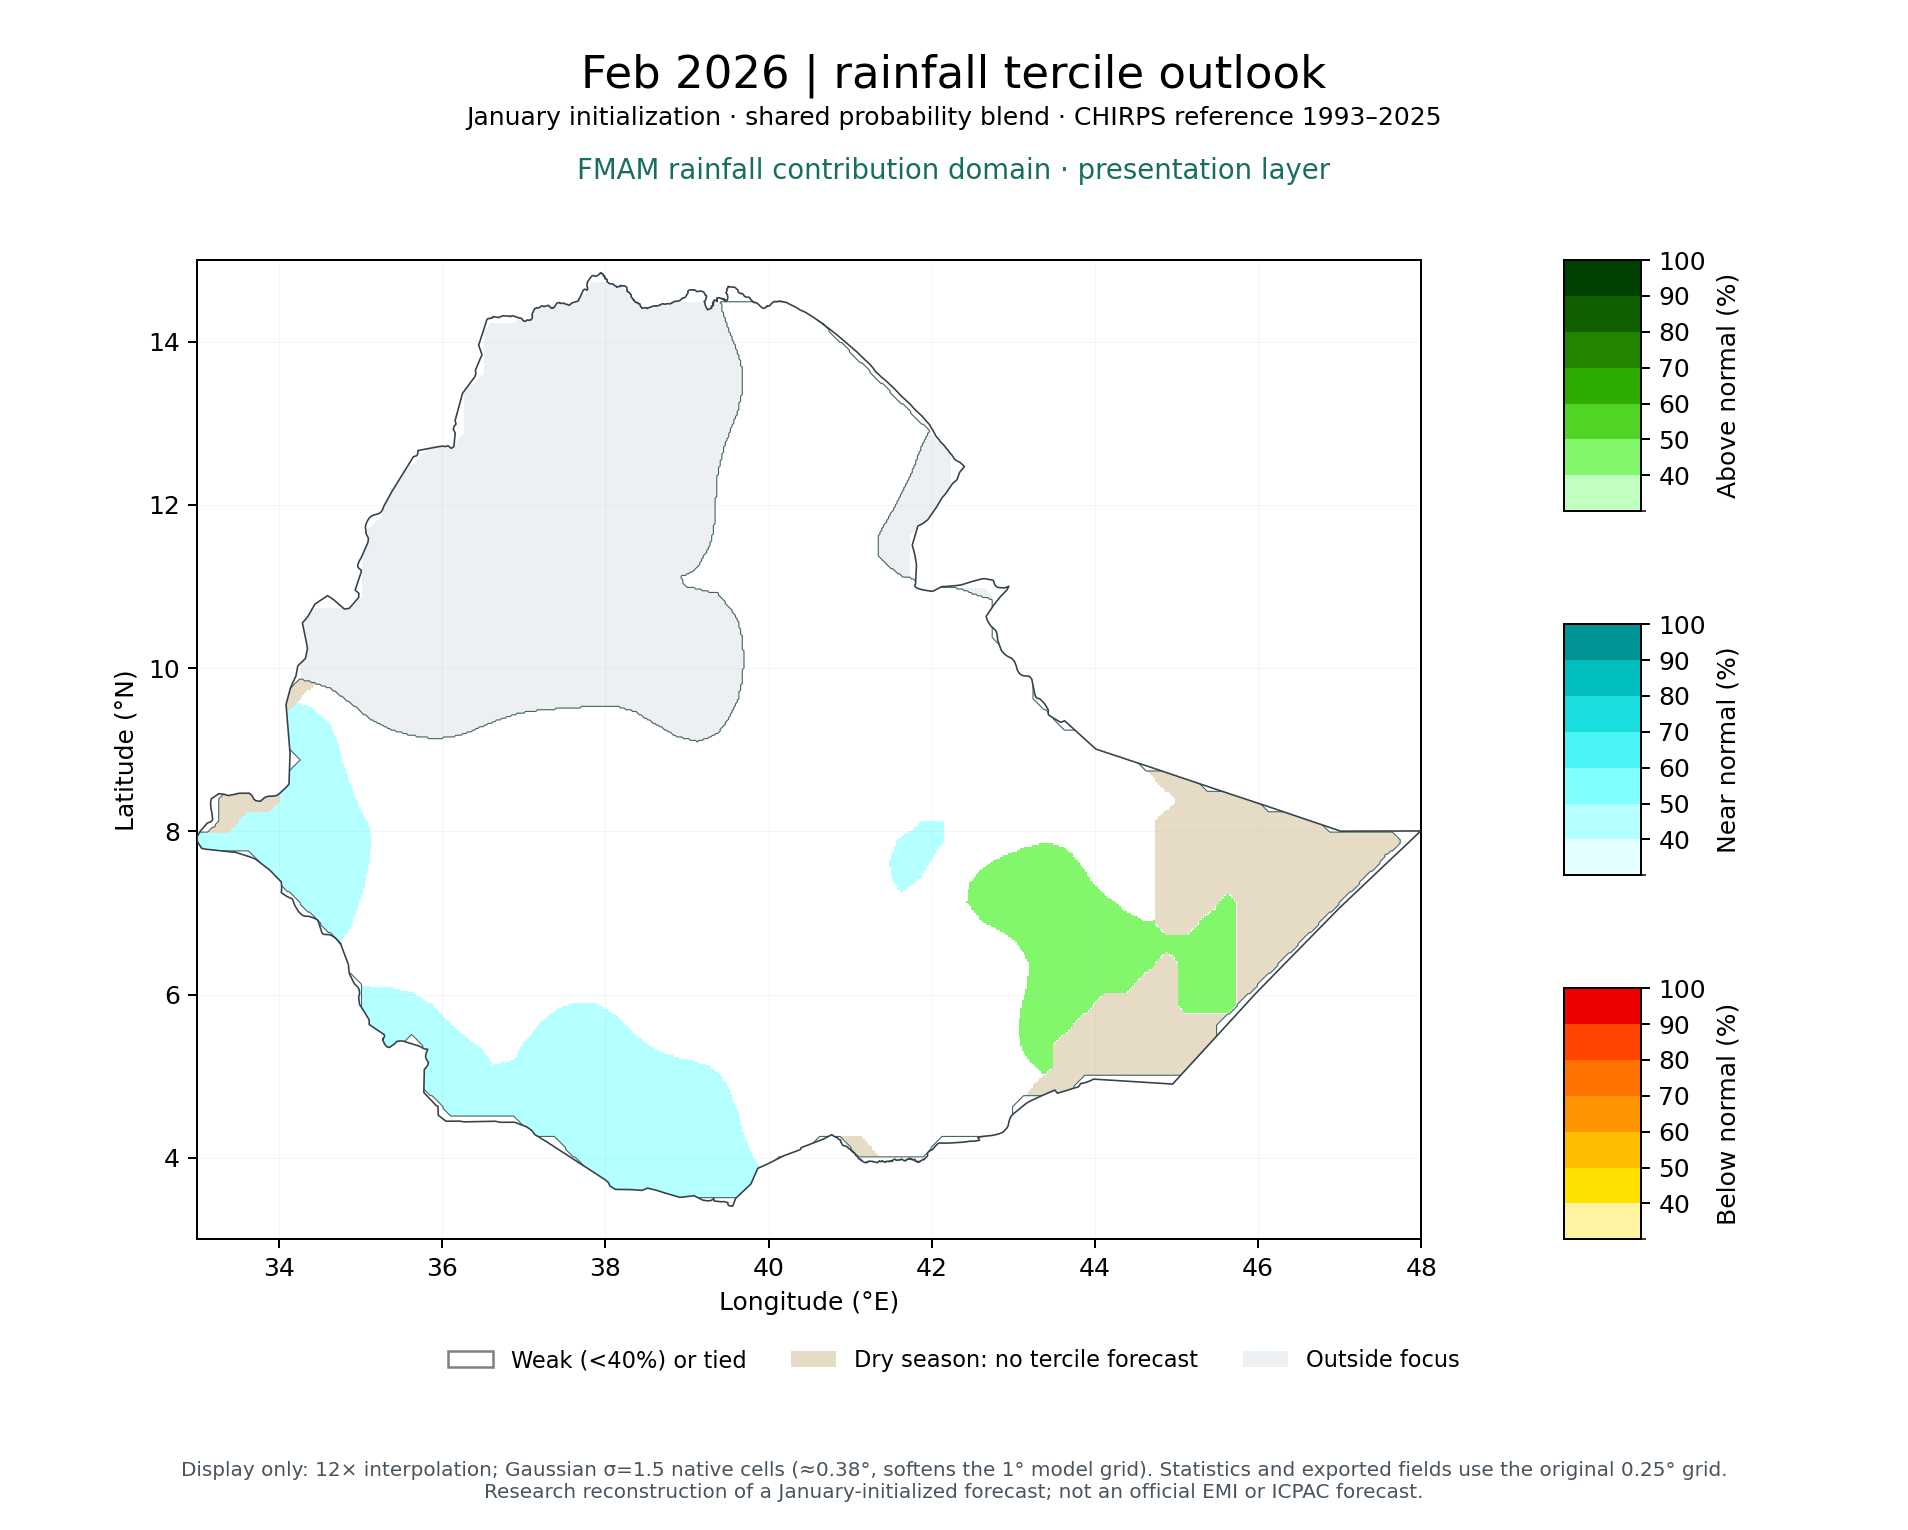
Feb 2026
What happened?
- Rainfall was drier than the reference average by 1 mm (−7%), averaged over the assessed area.
- 45% of the assessed area fell in the near normal tercile.
What did the forecast capture?
- Observed rainfall was close to average (−1 mm); the forecast anomaly was +1 mm.
- The highest average probability (36%) was on the observed near normal category.
What did it miss?
- Forecast rainfall was 2.2 mm higher than observed, averaged over the assessed area.
- Probabilities scored worse than climatology (RPSS −0.036).
- Rainfall amounts scored worse than climatology (CRPSS −0.187).
Probability skill (RPSS)−0.036 (3.6% higher score than climatology)
Rainfall amount skill (CRPSS)−0.187 (18.7% higher score than climatology)
Average rainfall error (bias, positive = too wet)+2.2 mm
Observed category distribution (of the assessed area)33% / 45% / 22% below / near / above
Assessed area (share of the selected area)91% probabilities · 100% amounts
Raw benchmark (uncorrected model) RPSS−0.593
Other verified targets (Mar, Apr, May, FMAM)
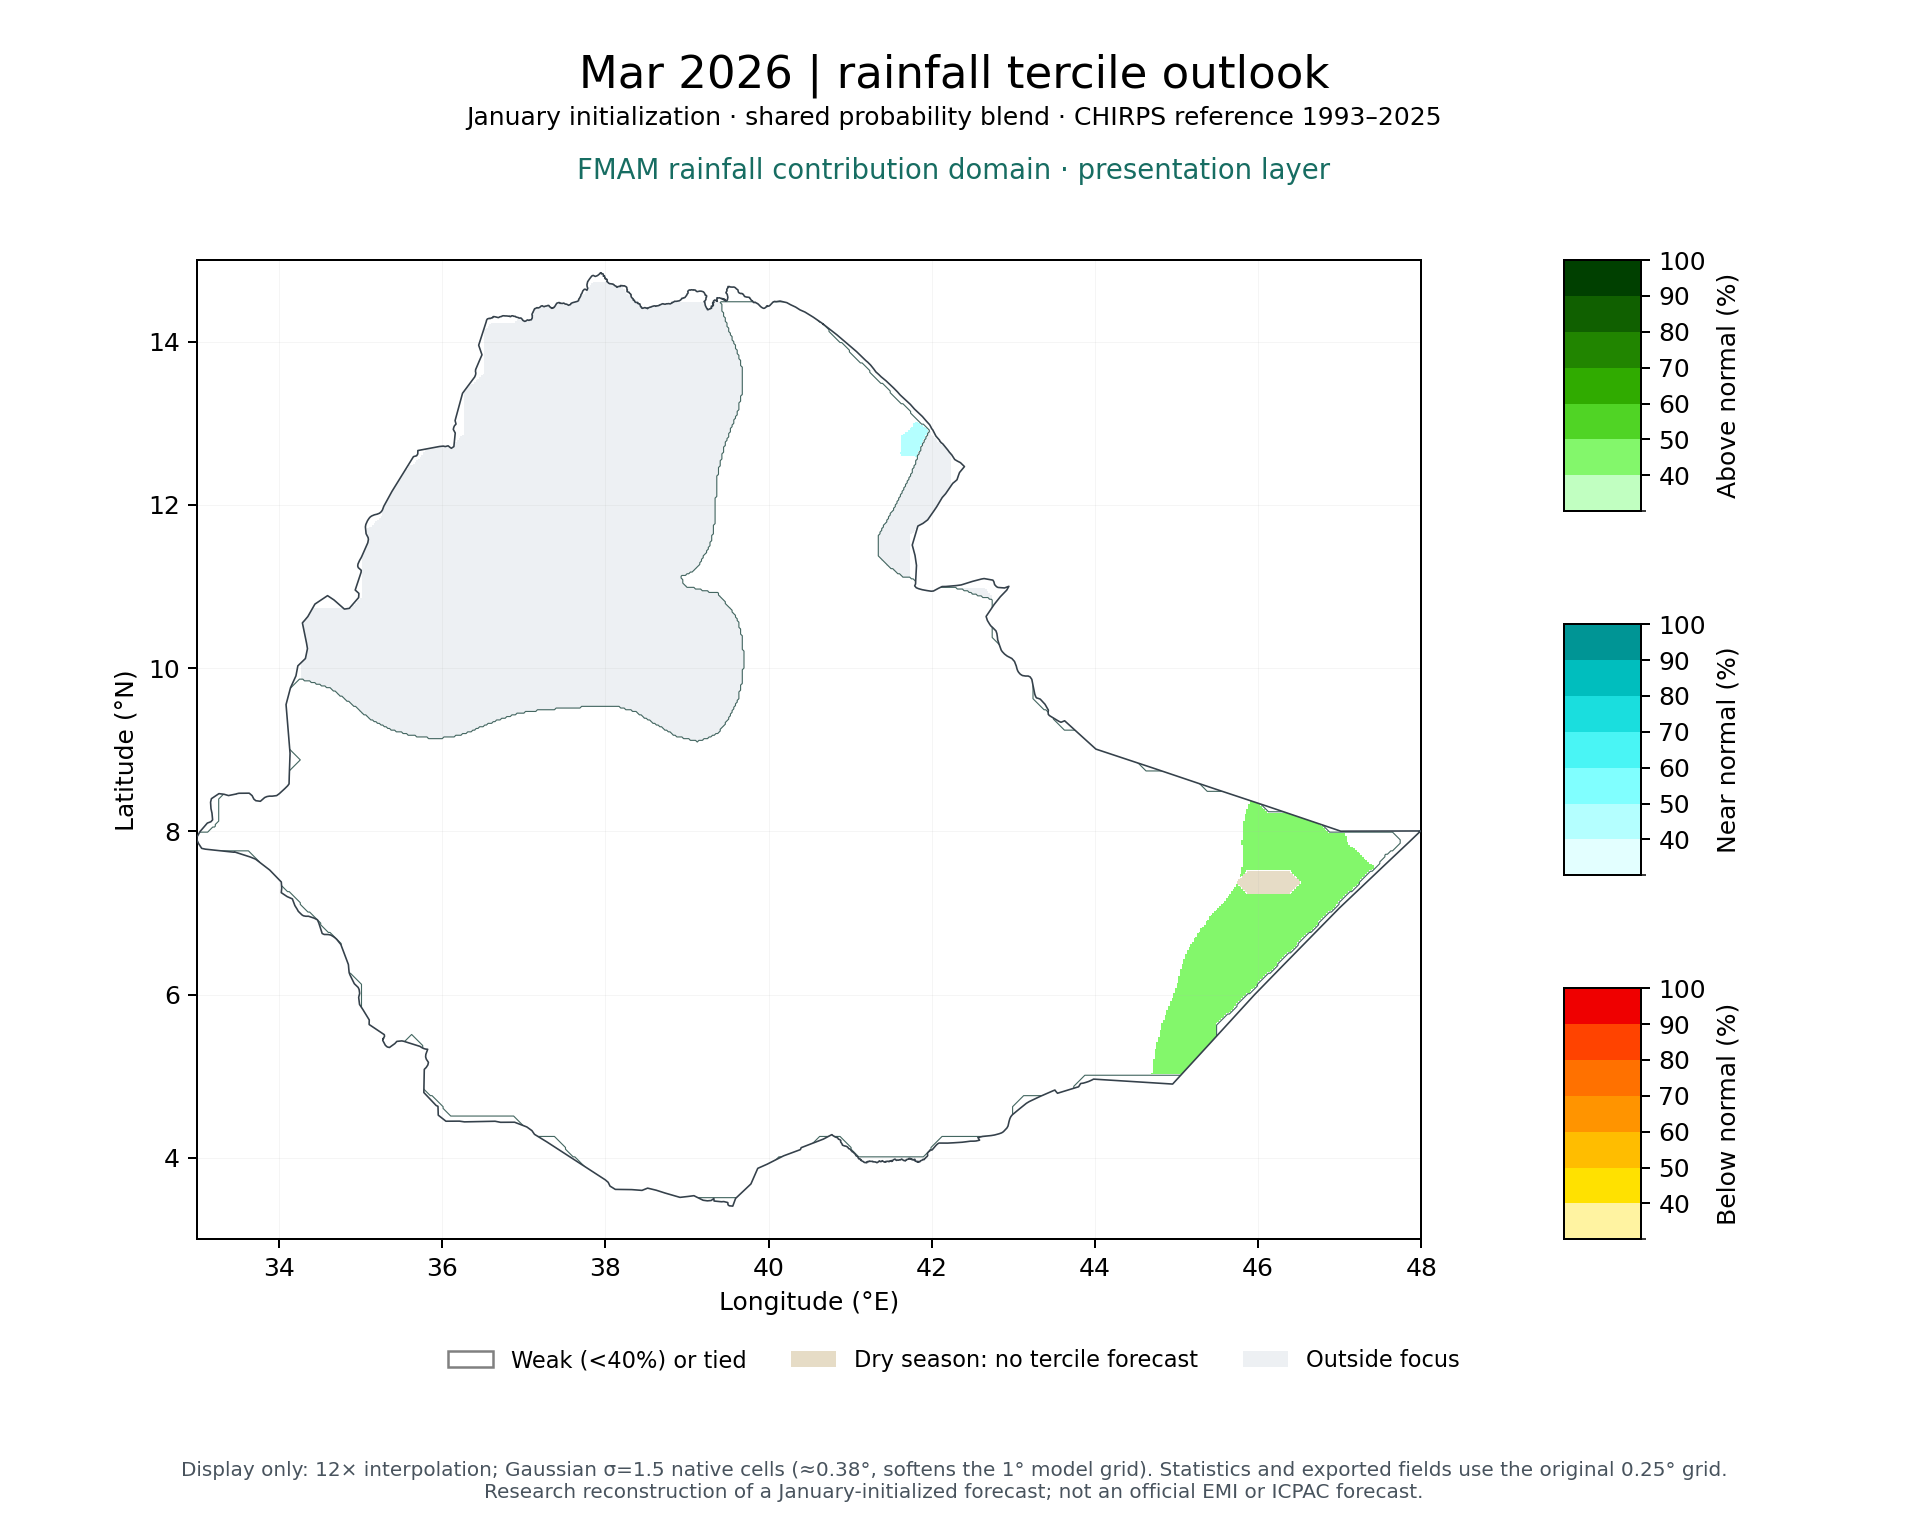
Mar 2026
What happened?
- Rainfall was wetter than the reference average by 69 mm (+112%), averaged over the assessed area.
- 96% of the assessed area fell in the above normal tercile.
What did the forecast capture?
- The forecast captured the wet conditions (+10 mm forecast, +69 mm observed).
- Probabilities scored better than climatology (RPSS +0.049).
- Rainfall amounts scored better than climatology (CRPSS +0.101).
What did it miss?
- Forecast rainfall was 59.0 mm lower than observed, averaged over the assessed area. It underestimated the rainfall surplus by about 85%.
- Probabilities stayed close to climatology (largest 35%).
Probability skill (RPSS)+0.049 (4.9% lower score than climatology)
Rainfall amount skill (CRPSS)+0.101 (10.1% lower score than climatology)
Average rainfall error (bias, positive = too wet)−59.0 mm
Observed category distribution (of the assessed area)0% / 4% / 96% below / near / above
Assessed area (share of the selected area)100% probabilities · 100% amounts
Raw benchmark (uncorrected model) RPSS−1.002
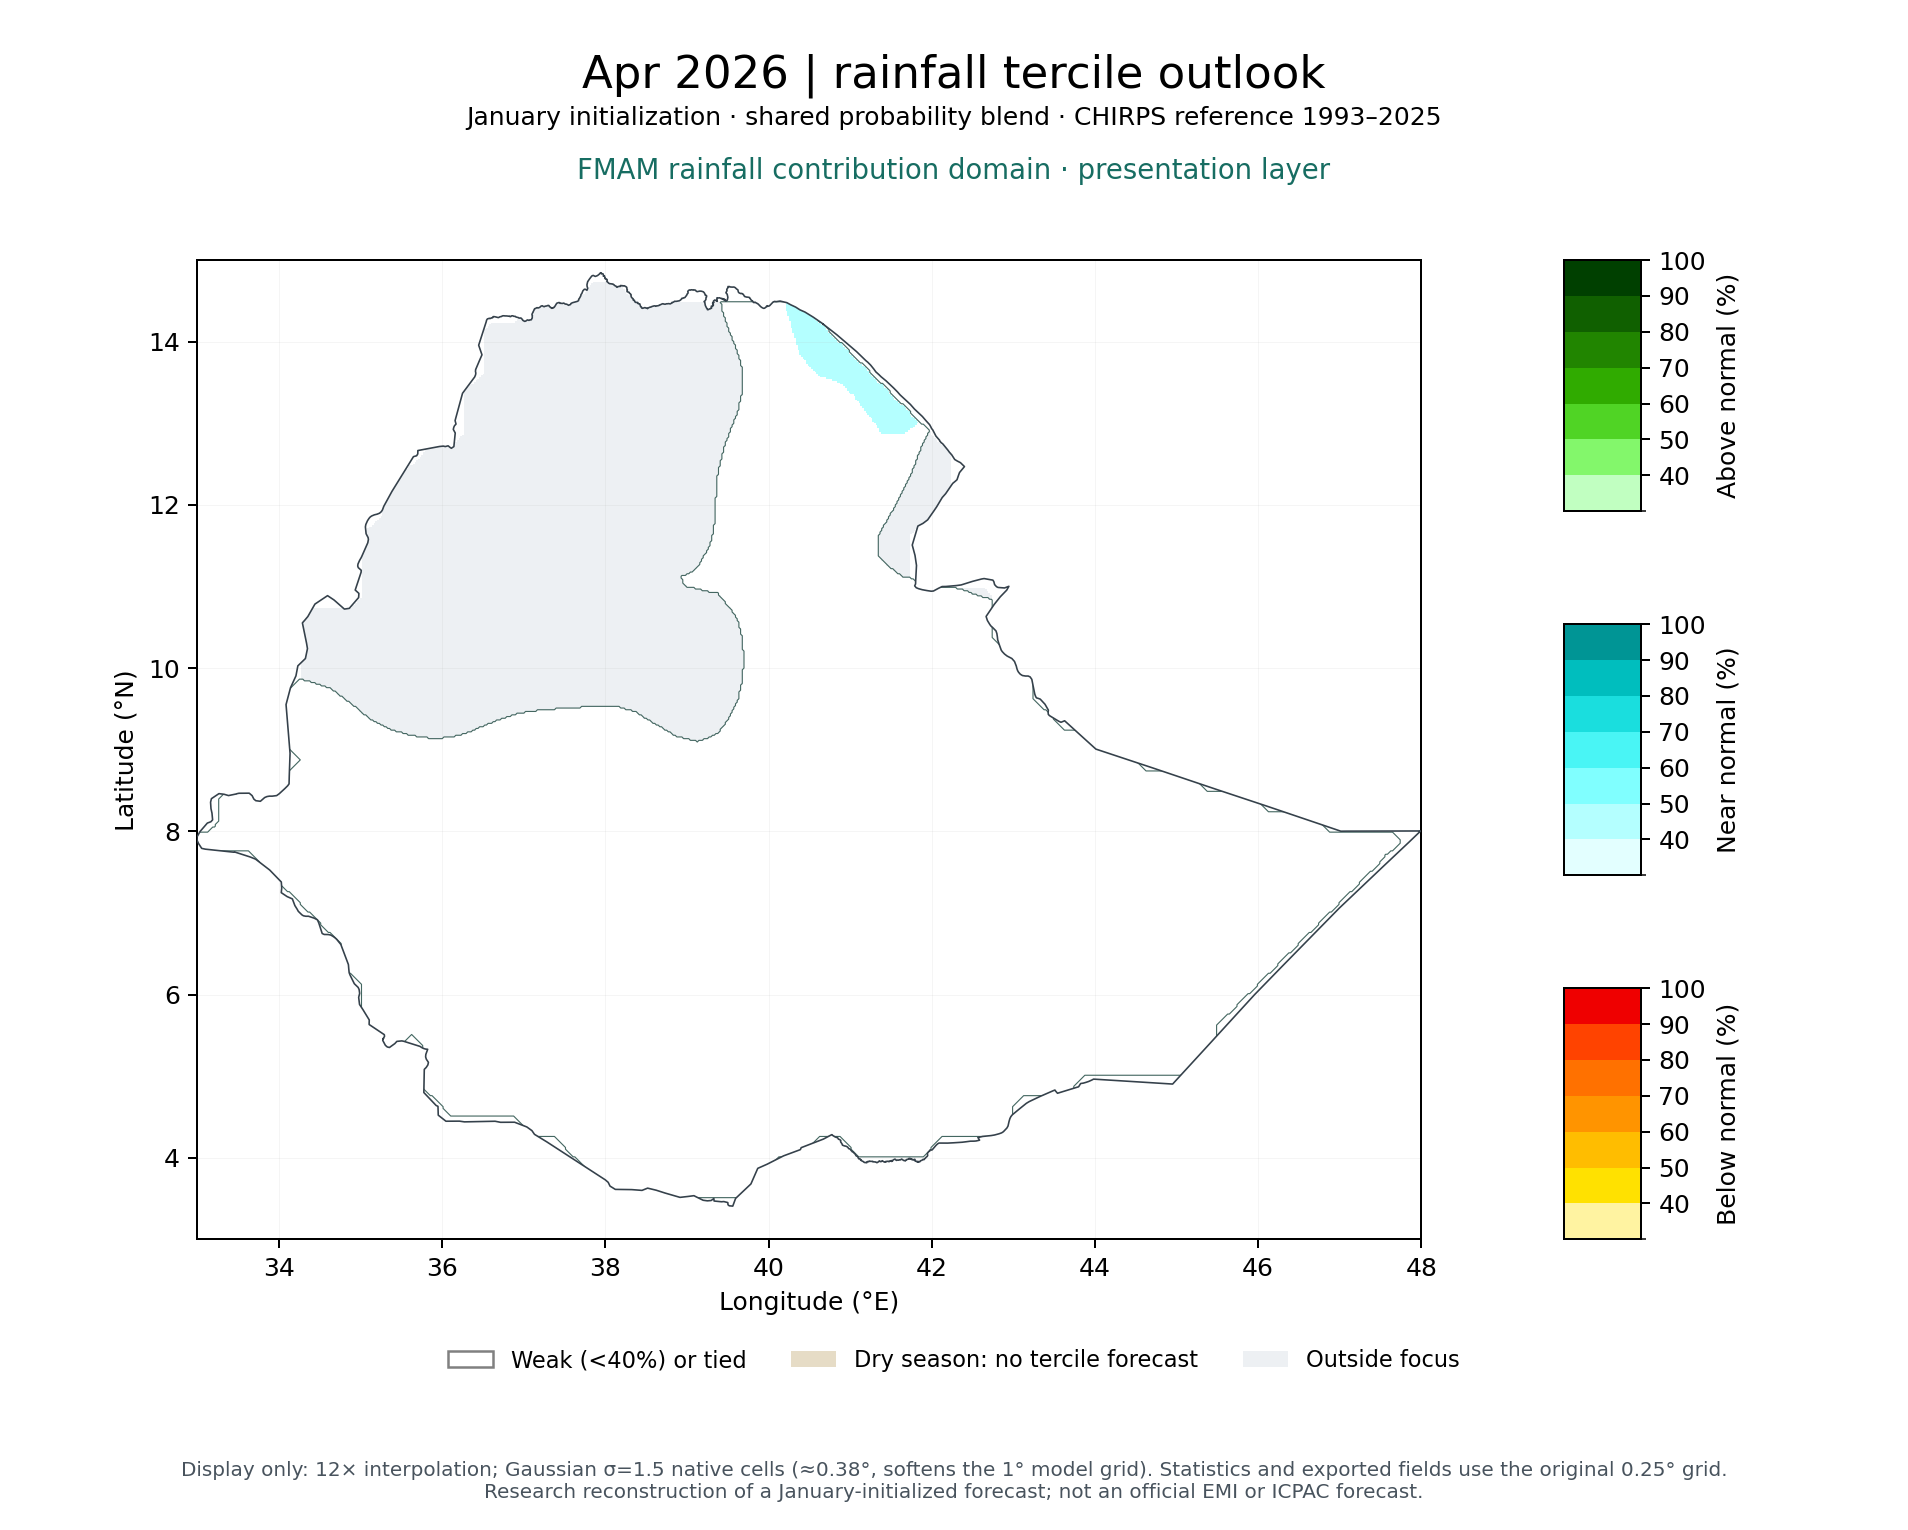
Apr 2026
What happened?
- Rainfall was drier than the reference average by 22 mm (−19%), averaged over the assessed area.
- 45% of the assessed area fell in the below normal tercile.
What did the forecast capture?
- The forecast captured the dry conditions (−4 mm forecast, −22 mm observed).
- Probabilities scored better than climatology (RPSS +0.015).
- Rainfall amounts scored better than climatology (CRPSS +0.024).
What did it miss?
- Forecast rainfall was 17.7 mm higher than observed, averaged over the assessed area. It underestimated the rainfall deficit by about 81%.
- Probabilities stayed close to climatology (largest 35%).
Probability skill (RPSS)+0.015 (1.5% lower score than climatology)
Rainfall amount skill (CRPSS)+0.024 (2.4% lower score than climatology)
Average rainfall error (bias, positive = too wet)+17.7 mm
Observed category distribution (of the assessed area)45% / 39% / 16% below / near / above
Assessed area (share of the selected area)100% probabilities · 100% amounts
Raw benchmark (uncorrected model) RPSS+0.048
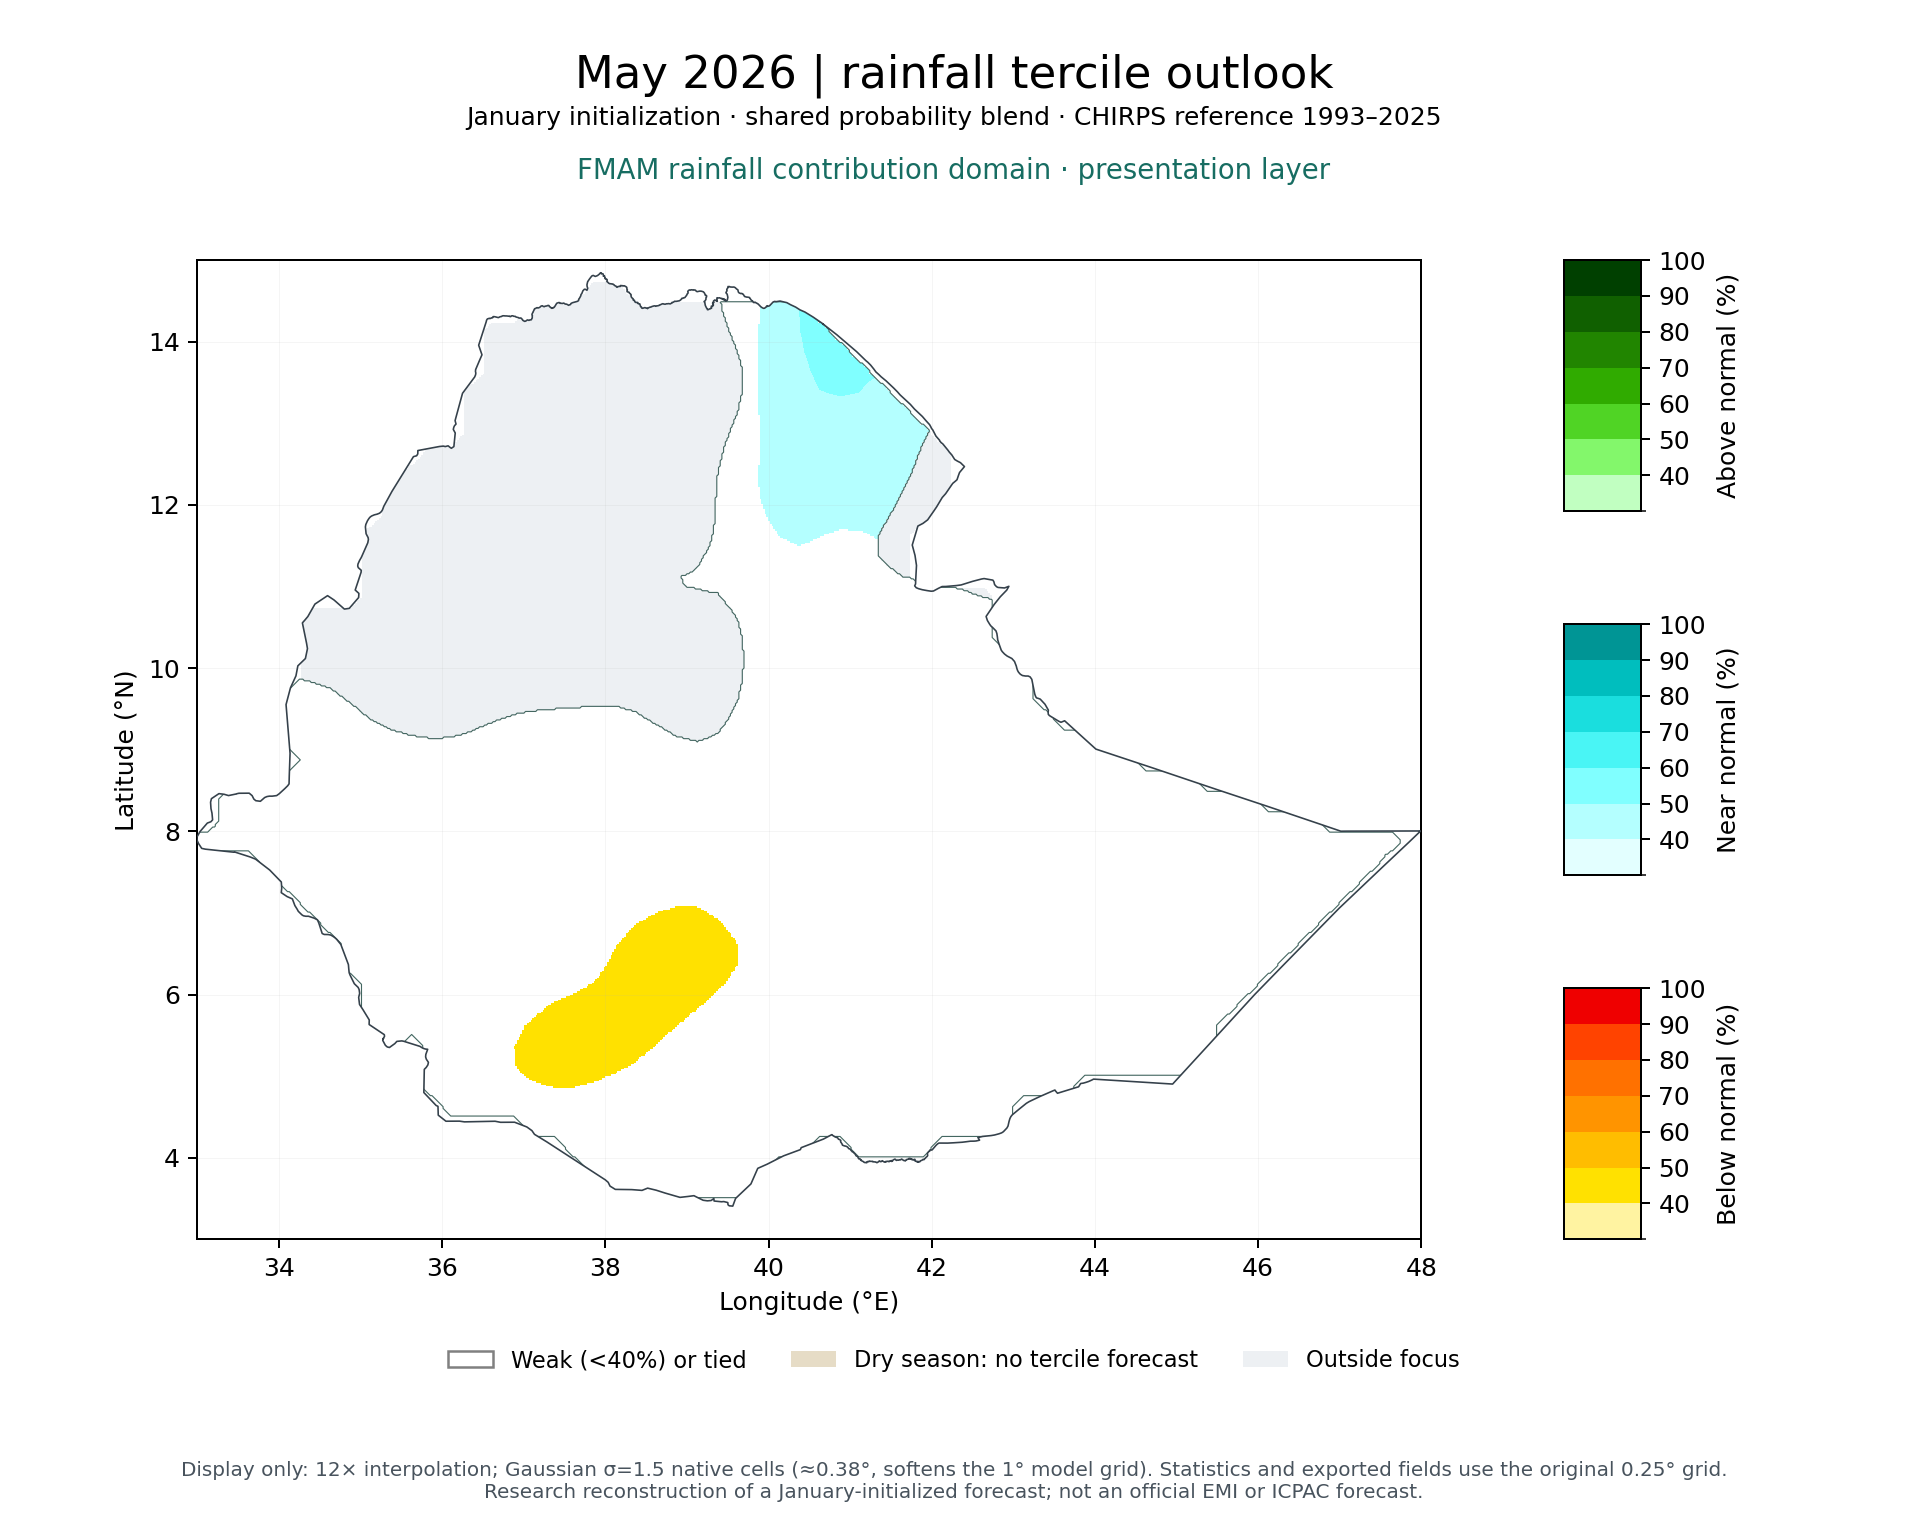
May 2026
What happened?
- Rainfall was drier than the reference average by 11 mm (−10%), averaged over the assessed area.
- 46% of the assessed area fell in the near normal tercile.
What did the forecast capture?
- The forecast captured the dry conditions (−8 mm forecast, −11 mm observed).
- Probabilities scored better than climatology (RPSS +0.033).
- Rainfall amounts scored better than climatology (CRPSS +0.031).
What did it miss?
- Forecast rainfall was 3.1 mm higher than observed, averaged over the assessed area. It underestimated the rainfall deficit by about 28%.
- Probabilities favoured below normal (36%) while most of the area was near normal.
Probability skill (RPSS)+0.033 (3.3% lower score than climatology)
Rainfall amount skill (CRPSS)+0.031 (3.1% lower score than climatology)
Average rainfall error (bias, positive = too wet)+3.1 mm
Observed category distribution (of the assessed area)37% / 46% / 17% below / near / above
Assessed area (share of the selected area)100% probabilities · 100% amounts
Raw benchmark (uncorrected model) RPSS−0.278
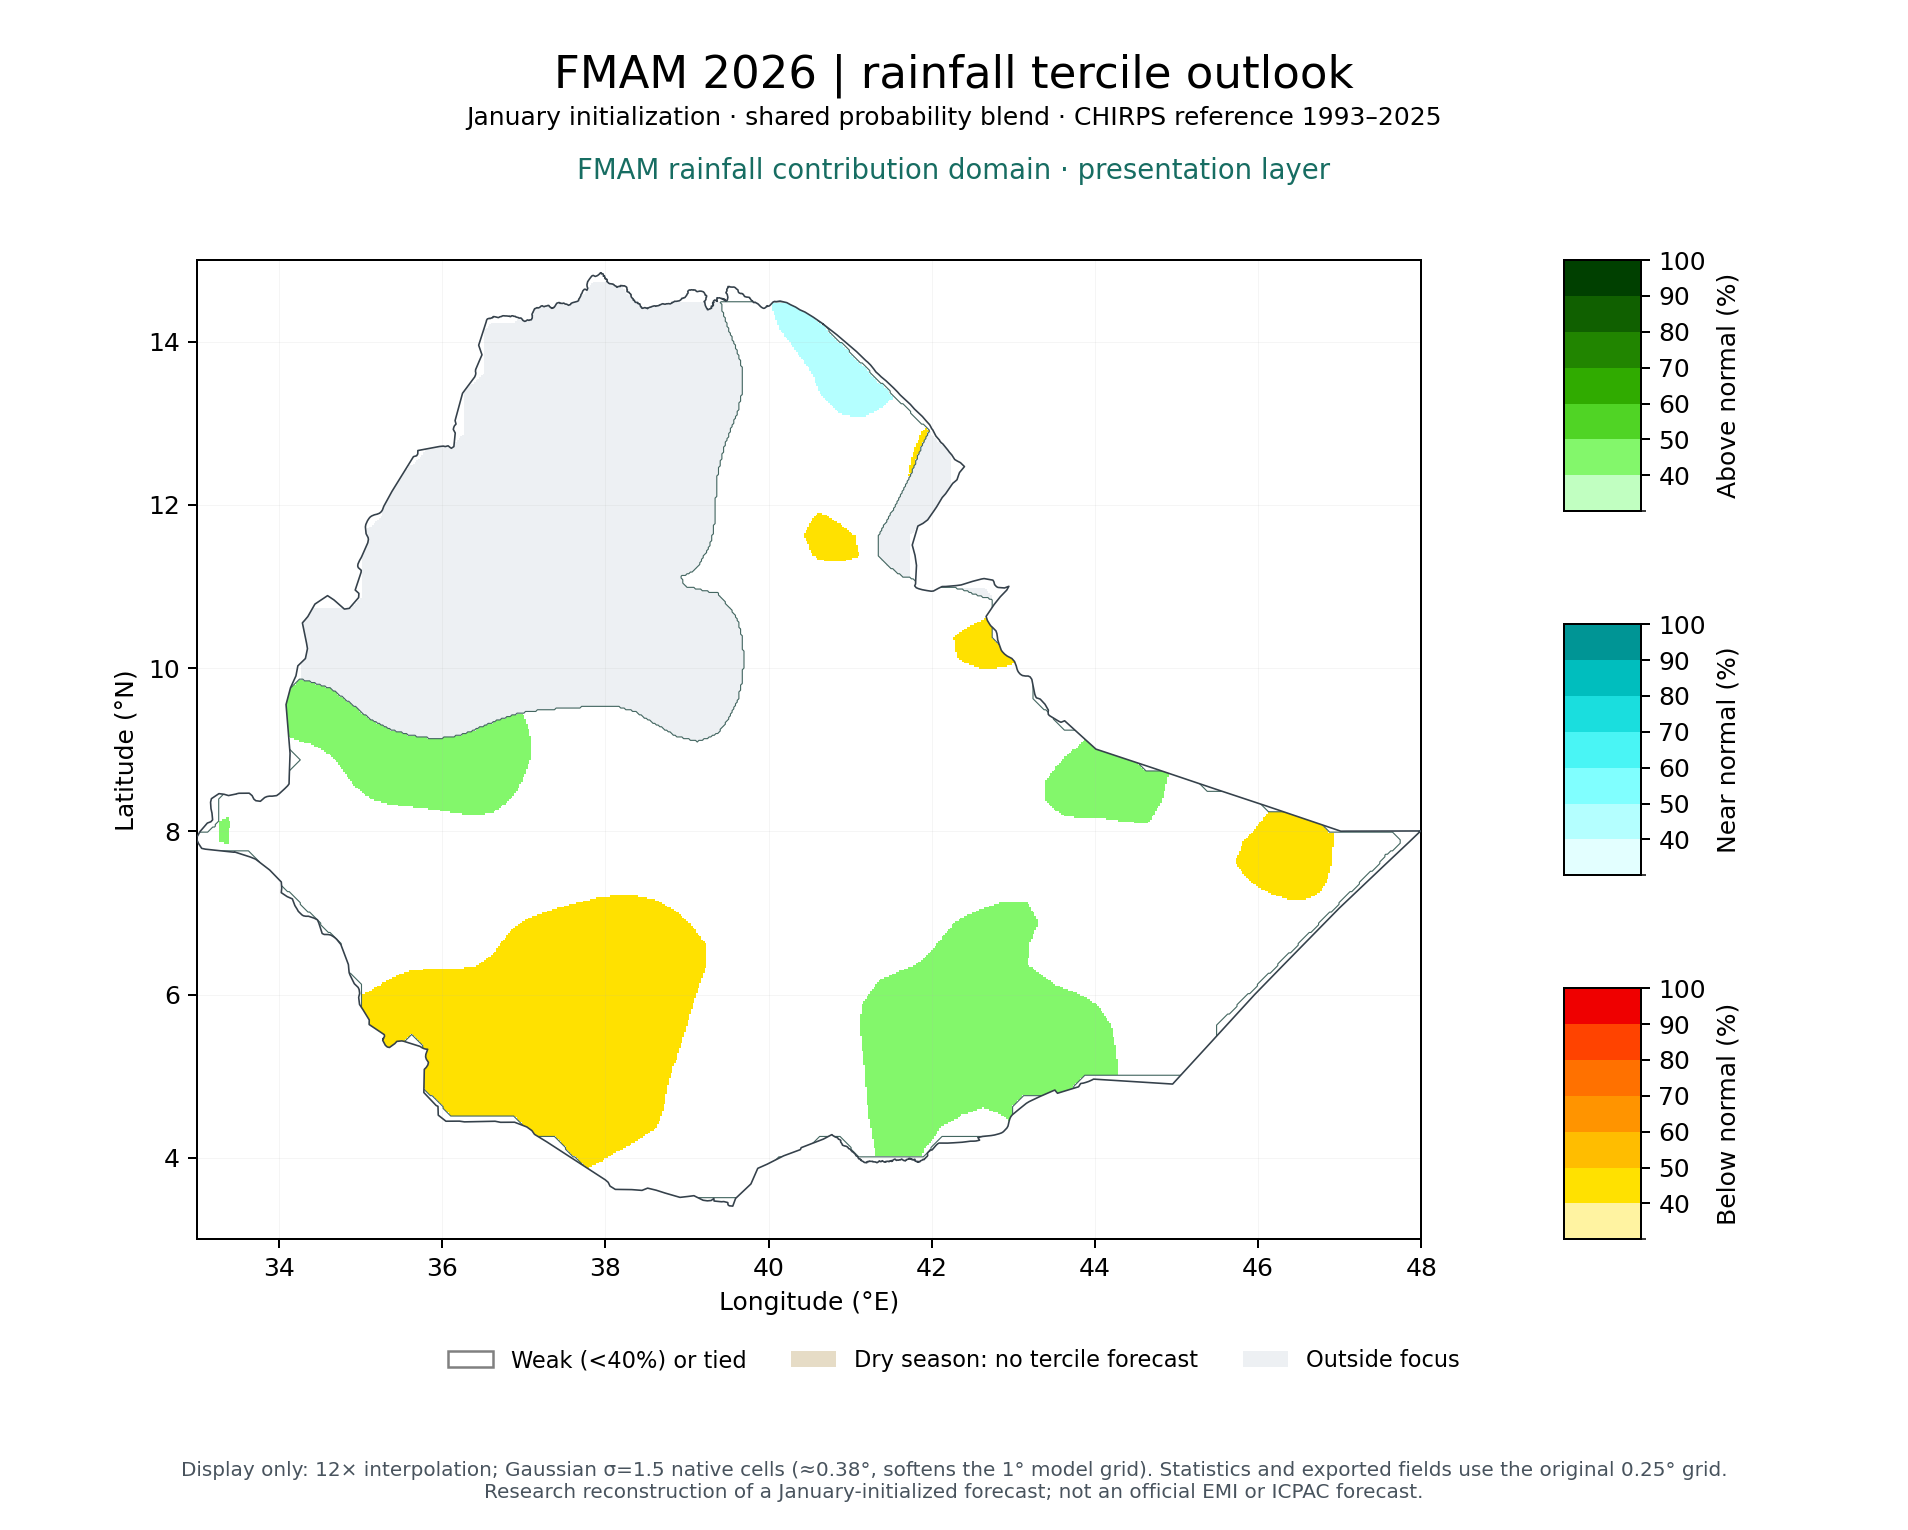
FMAM 2026
What happened?
- Rainfall was wetter than the reference average by 35 mm (+11%), averaged over the assessed area.
- 47% of the assessed area fell in the above normal tercile.
What did the forecast capture?
None of the checked aspects (sign of the anomaly, leading category, scores against climatology).
What did it miss?
- The forecast mean was close to average (−3 mm), so it gave little indication of the observed wet anomaly (+35 mm).
- Forecast rainfall was 38.1 mm lower than observed, averaged over the assessed area.
- Probabilities stayed close to climatology (largest 35%).
- Probabilities scored worse than climatology (RPSS −0.054).
- Rainfall amounts scored worse than climatology (CRPSS −0.097).
Probability skill (RPSS)−0.054 (5.4% higher score than climatology)
Rainfall amount skill (CRPSS)−0.097 (9.7% higher score than climatology)
Average rainfall error (bias, positive = too wet)−38.1 mm
Observed category distribution (of the assessed area)13% / 40% / 47% below / near / above
Assessed area (share of the selected area)100% probabilities · 100% amounts
Raw benchmark (uncorrected model) RPSS−1.257
 FMAM 2026
 Feb 2026
 Mar 2026
 Apr 2026
 May 2026