Phase 3 · Probability calibration · February initialization · FMAM and its months
Phase 3 · February initialization · FMAM and its months
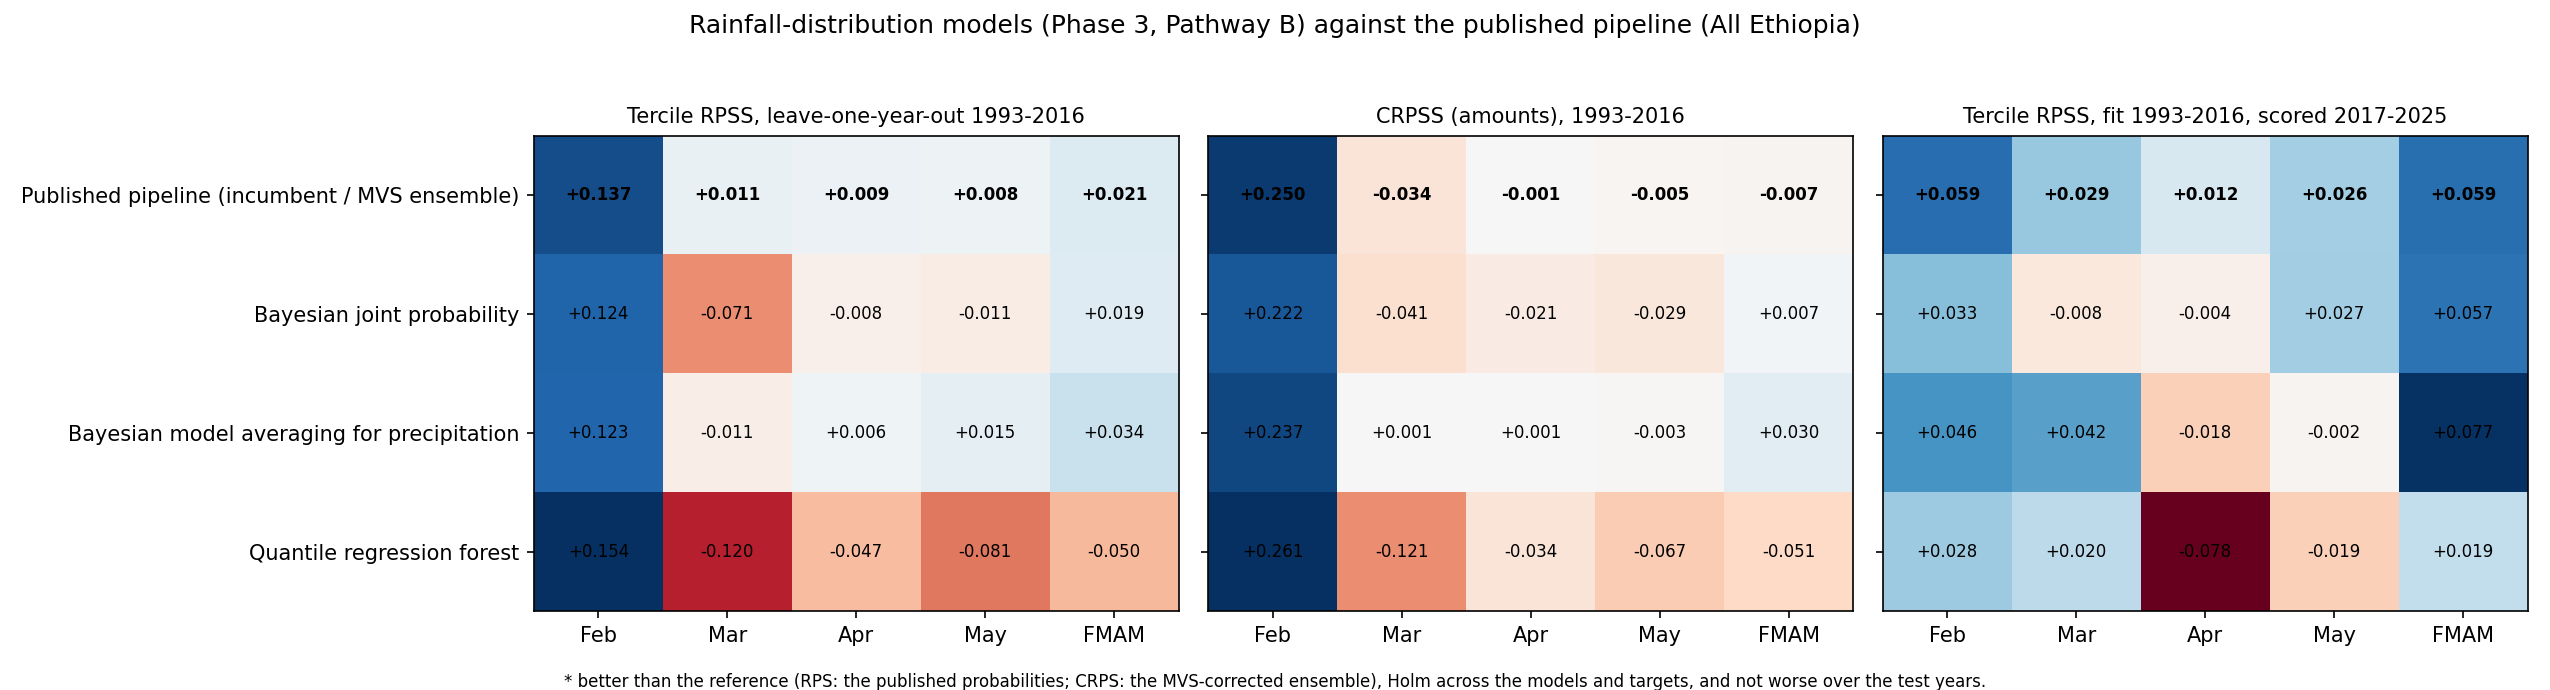
Rainfall-distribution models (Pathway B)
Each model predicts a full rainfall distribution from the raw ensemble (pooled over cells in units relative to each cell's
climatology); terciles at the training CHIRPS boundaries, quantiles and intervals come from it. References, in the same folds:
the published probabilities (tercile RPS) and the MVS-corrected ensemble (CRPS, quantiles). ✓ = better than the reference with
Holm-adjusted p < 0.05 across the models and targets, and not worse over 2017–2025. Confirmed better — tercile probabilities:
none; rainfall amounts (CRPS): none.
Tercile probabilities
Tercile RPSS, outer leave-one-year-out 1993–2016
Method
Feb
Mar
Apr
May
FMAM
Published probabilities (incumbent)
+0.137
+0.011
+0.009
+0.008
+0.021
Bayesian joint probability
+0.124
-0.071
-0.008
-0.011
+0.019
Bayesian model averaging for precipitation
+0.123
-0.011
+0.006
+0.015
+0.034
Quantile regression forest
+0.154
-0.120
-0.047
-0.081
-0.050
Rainfall amounts
Amount CRPSS against the CHIRPS climatology, 1993–2016
Method
Feb
Mar
Apr
May
FMAM
MVS-corrected ensemble
+0.250
-0.034
-0.001
-0.005
-0.007
Bayesian joint probability
+0.222
-0.041
-0.021
-0.029
+0.007
Bayesian model averaging for precipitation
+0.237
+0.001
+0.001
-0.003
+0.030
Quantile regression forest
+0.261
-0.121
-0.034
-0.067
-0.051
Intervals and quantiles
Share of observations inside the 10–90% interval, 1993–2016 (80% is calibrated)
Method
Feb
Mar
Apr
May
FMAM
MVS-corrected ensemble
55%
59%
68%
67%
70%
Bayesian joint probability
85%
82%
80%
81%
82%
Bayesian model averaging for precipitation
84%
81%
82%
83%
79%
Quantile regression forest
76%
71%
72%
71%
71%
Pinball loss of the median (mm), 1993–2016 (lower is better)
Method
Feb
Mar
Apr
May
FMAM
MVS-corrected ensemble
3.94
13.85
20.01
20.42
34.86
Bayesian joint probability
4.23
14.55
20.20
20.68
34.20
Bayesian model averaging for precipitation
4.18
13.80
20.17
20.45
33.89
Quantile regression forest
3.95
15.61
20.93
21.96
36.63
Test years
Fit 1993–2016, scored 2017–2025 (exploratory)
Method
Feb
Mar
Apr
May
FMAM
Published probabilities / MVS ensemble
+0.059 / +0.000
+0.029 / +0.065
+0.012 / +0.004
+0.026 / +0.025
+0.059 / +0.071
Bayesian joint probability (RPSS / CRPSS)
+0.033 / +0.056
-0.008 / -0.001
-0.004 / -0.007
+0.027 / -0.040
+0.057 / +0.041
Bayesian model averaging for precipitation (RPSS / CRPSS)
+0.046 / +0.067
+0.042 / +0.054
-0.018 / -0.011
-0.002 / -0.020
+0.077 / +0.063
Quantile regression forest (RPSS / CRPSS)
+0.028 / -0.064
+0.020 / +0.010
-0.078 / -0.071
-0.019 / -0.021
+0.019 / +0.020
Fits and model definitions
Bayesian joint probability: did not converge in every fold.
Bayesian model averaging for precipitation: converged in every fold.
Quantile regression forest: converged in every fold.
Models
Model
Estimates
Predictors
Fitting
Outputs
Bayesian joint probability
rainfall distribution (log-sinh normal, censored at zero, Student-t predictive)
ensemble mean m' (relative)
censored maximum likelihood of the transforms and the joint normal; parameter uncertainty integrated with the number of training years as the effective sample
CDF, quantiles, tercile probabilities
Bayesian model averaging for precipitation
mixture over members: probability of zero and a gamma for the cube root of the amount
each member's amount f' (relative), equal weights for exchangeable members
maximum likelihood of the mixture, pooled
CDF, quantiles, tercile probabilities
Quantile regression forest
conditional distribution as leaf-weighted training amounts; quantiles at 39 levels (2.5–97.5%)
m', s', md', ensemble 10% and 90% quantiles (relative), log climatological mean, CHIRPS coefficient of variation
200 trees, at least 40 samples per leaf, half the predictors per split, pooled
CDF, quantiles, tercile probabilities
Tercile RPSS and amount CRPSS of the Phase 3 distribution models against the published pipeline.