February initialization · ECMWF SEAS5 calibrated with CHIRPS · FMAM rainfall contribution domain
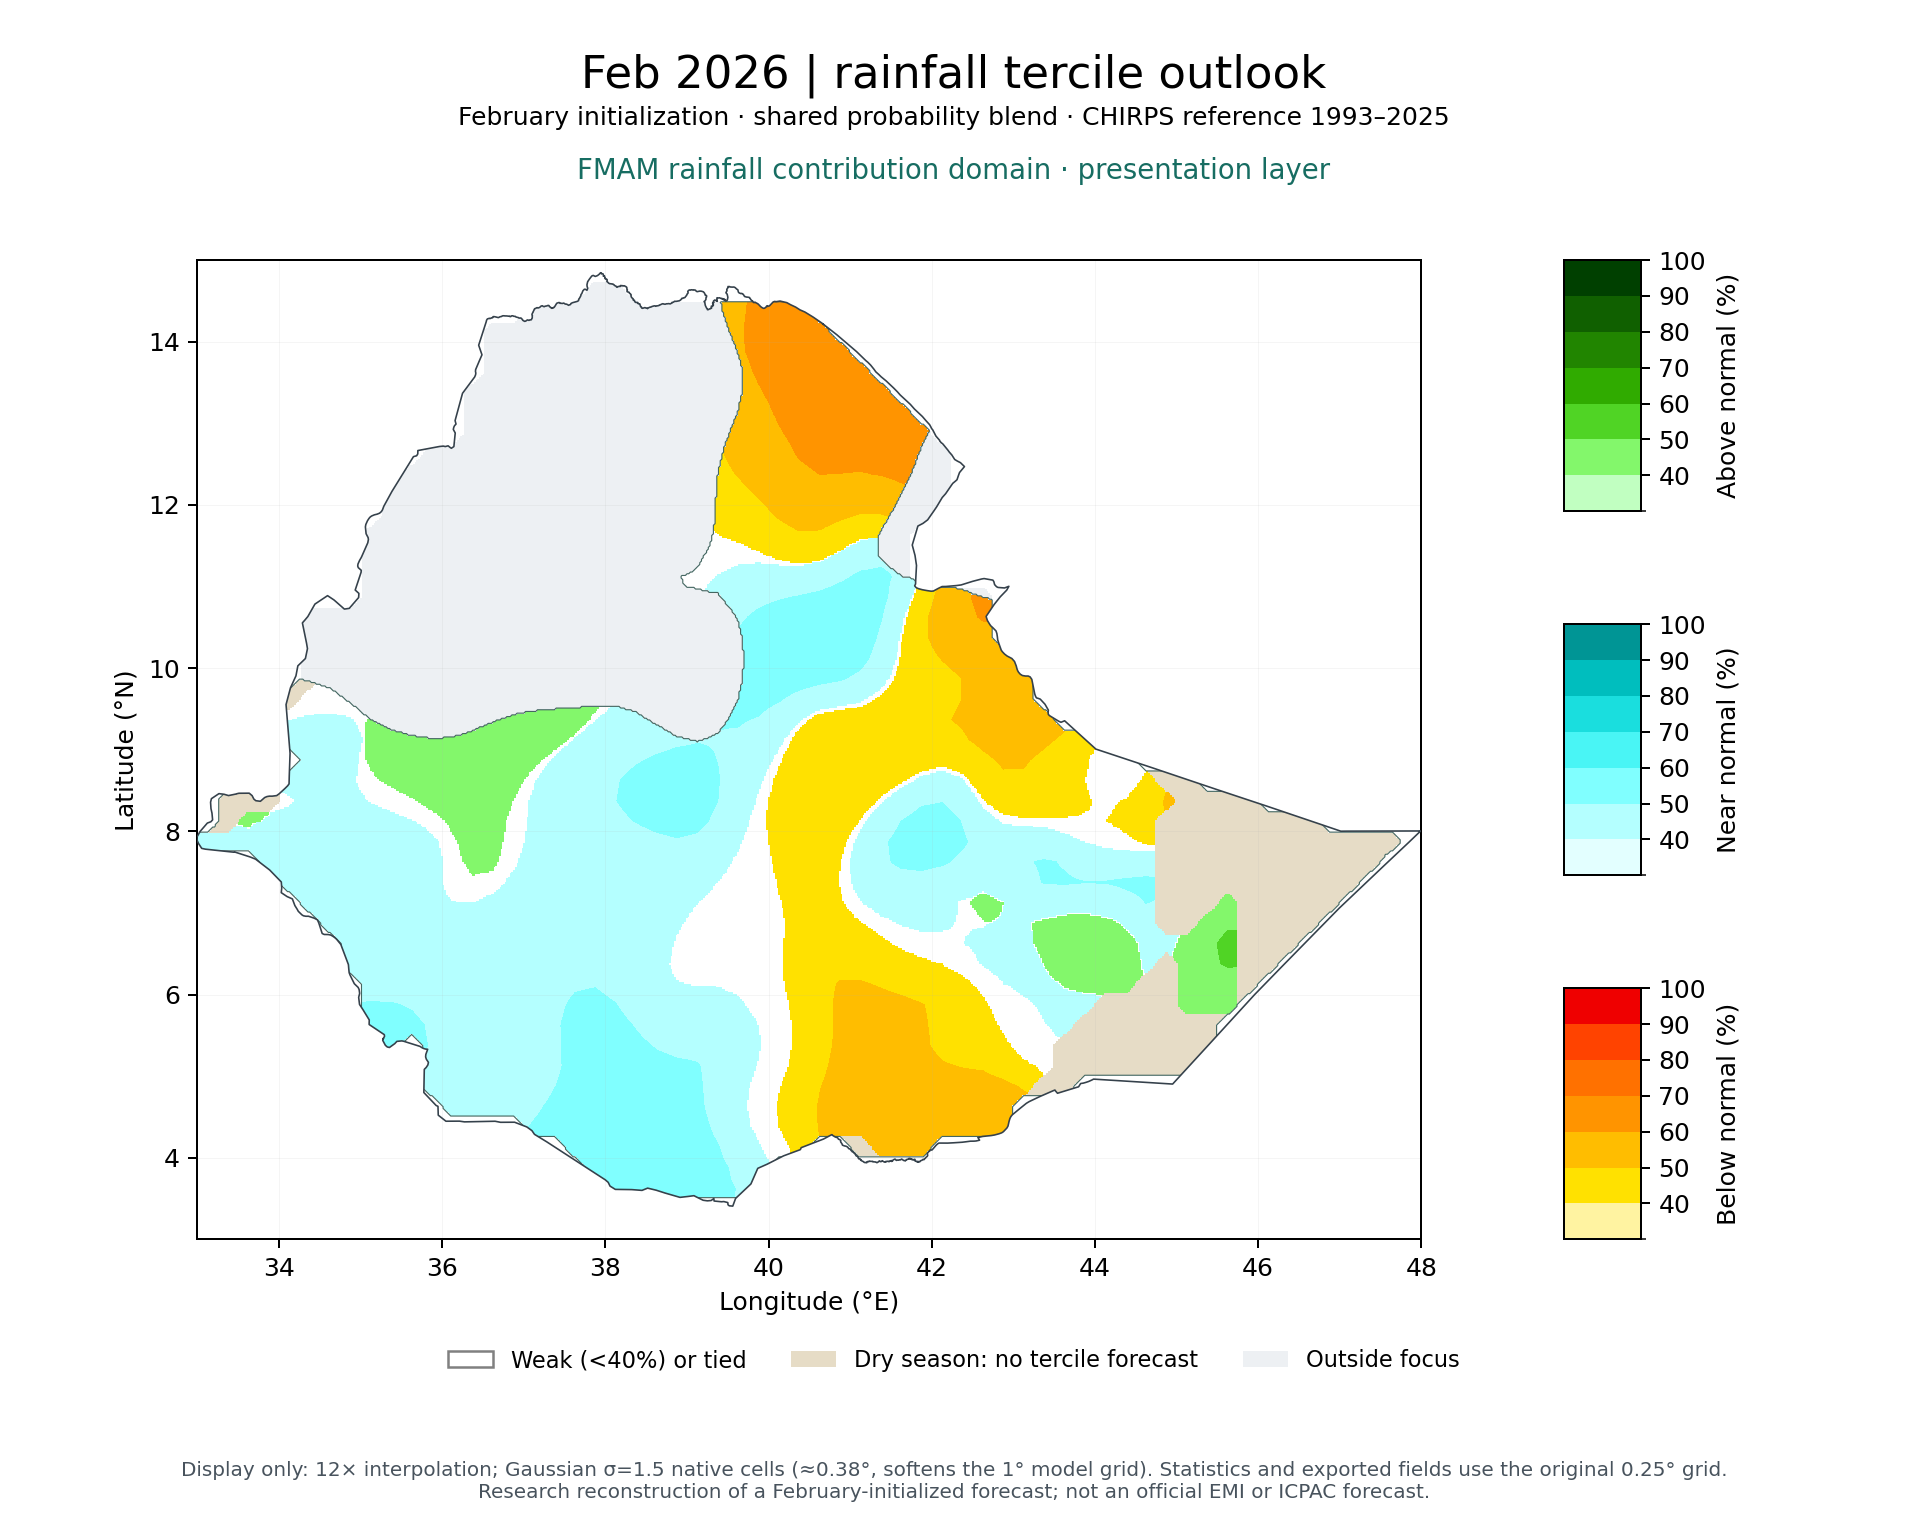
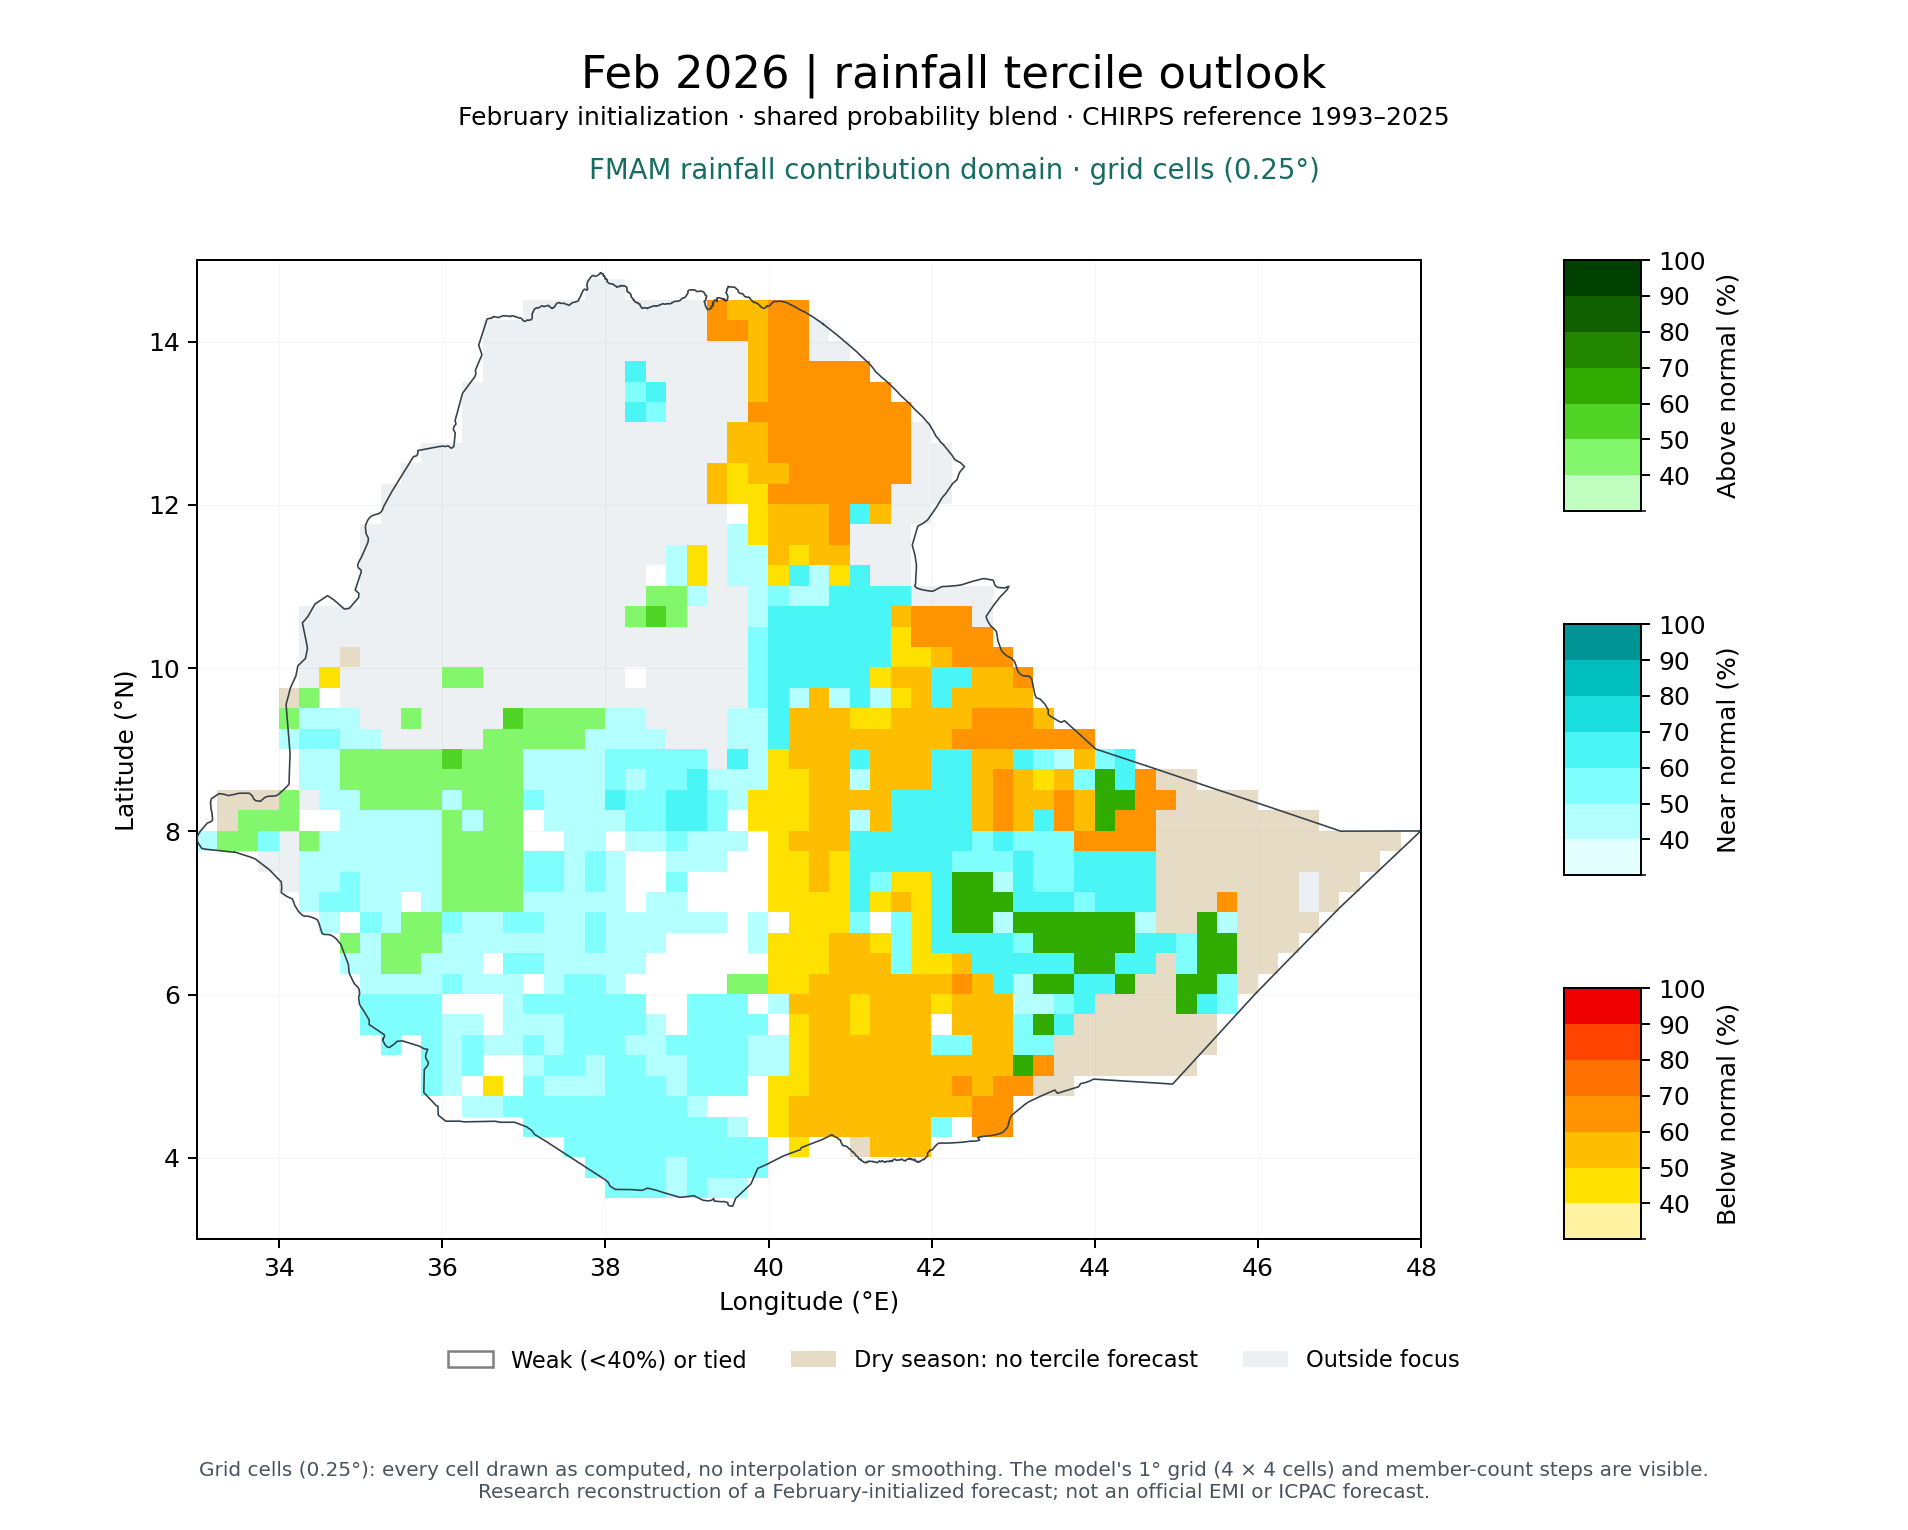
Feb 2026 rainfall outlook
Research reconstruction · not an official EMI or ICPAC forecastVerification published
The forecast leans toward near normal rainfall in the FMAM rainfall contribution domain: averaged over the area, the local probability of near normal is 39%, against about 33% for climatology. Mean forecast rainfall is 17 mm against a 1993–2025 average of 20 mm (−3 mm, −13%).
Average local probability
Each grid cell has its own tercile probabilities; these are their averages over the 91% of the area that has probabilities. They are not the probability that the area-total rainfall falls in a category.
Rainfall amount
Amounts cover 100% of the area. They come from the amount-corrected ensemble, calibrated separately from the probabilities, so the two can differ slightly.
Forecast signal
Weak tilt toward near normal
Largest area-average probability 39%, compared with a one-third reference. The local climatological probabilities (observed tercile frequencies in the training years) are close to, but not exactly, one-third. Based on probabilities only.
Historical skill — FMAM rainfall contribution domain
Moderate improvement over climatology (interval above zero)
Probability skill (RPSS) +0.137 for Feb, cross-validated 1993–2016 (95% interval +0.050 to +0.234); better than climatology in 16 of 24 years. One-target p = 0.002; adjusted for testing 5 targets (Holm), p = 0.012 (still significant). Details
Signal strength describes how far this forecast's probabilities depart from climatology. Historical skill describes how forecasts made the same way scored in past years. A strong signal is not a confidence rating.
All targets in this cycle
-
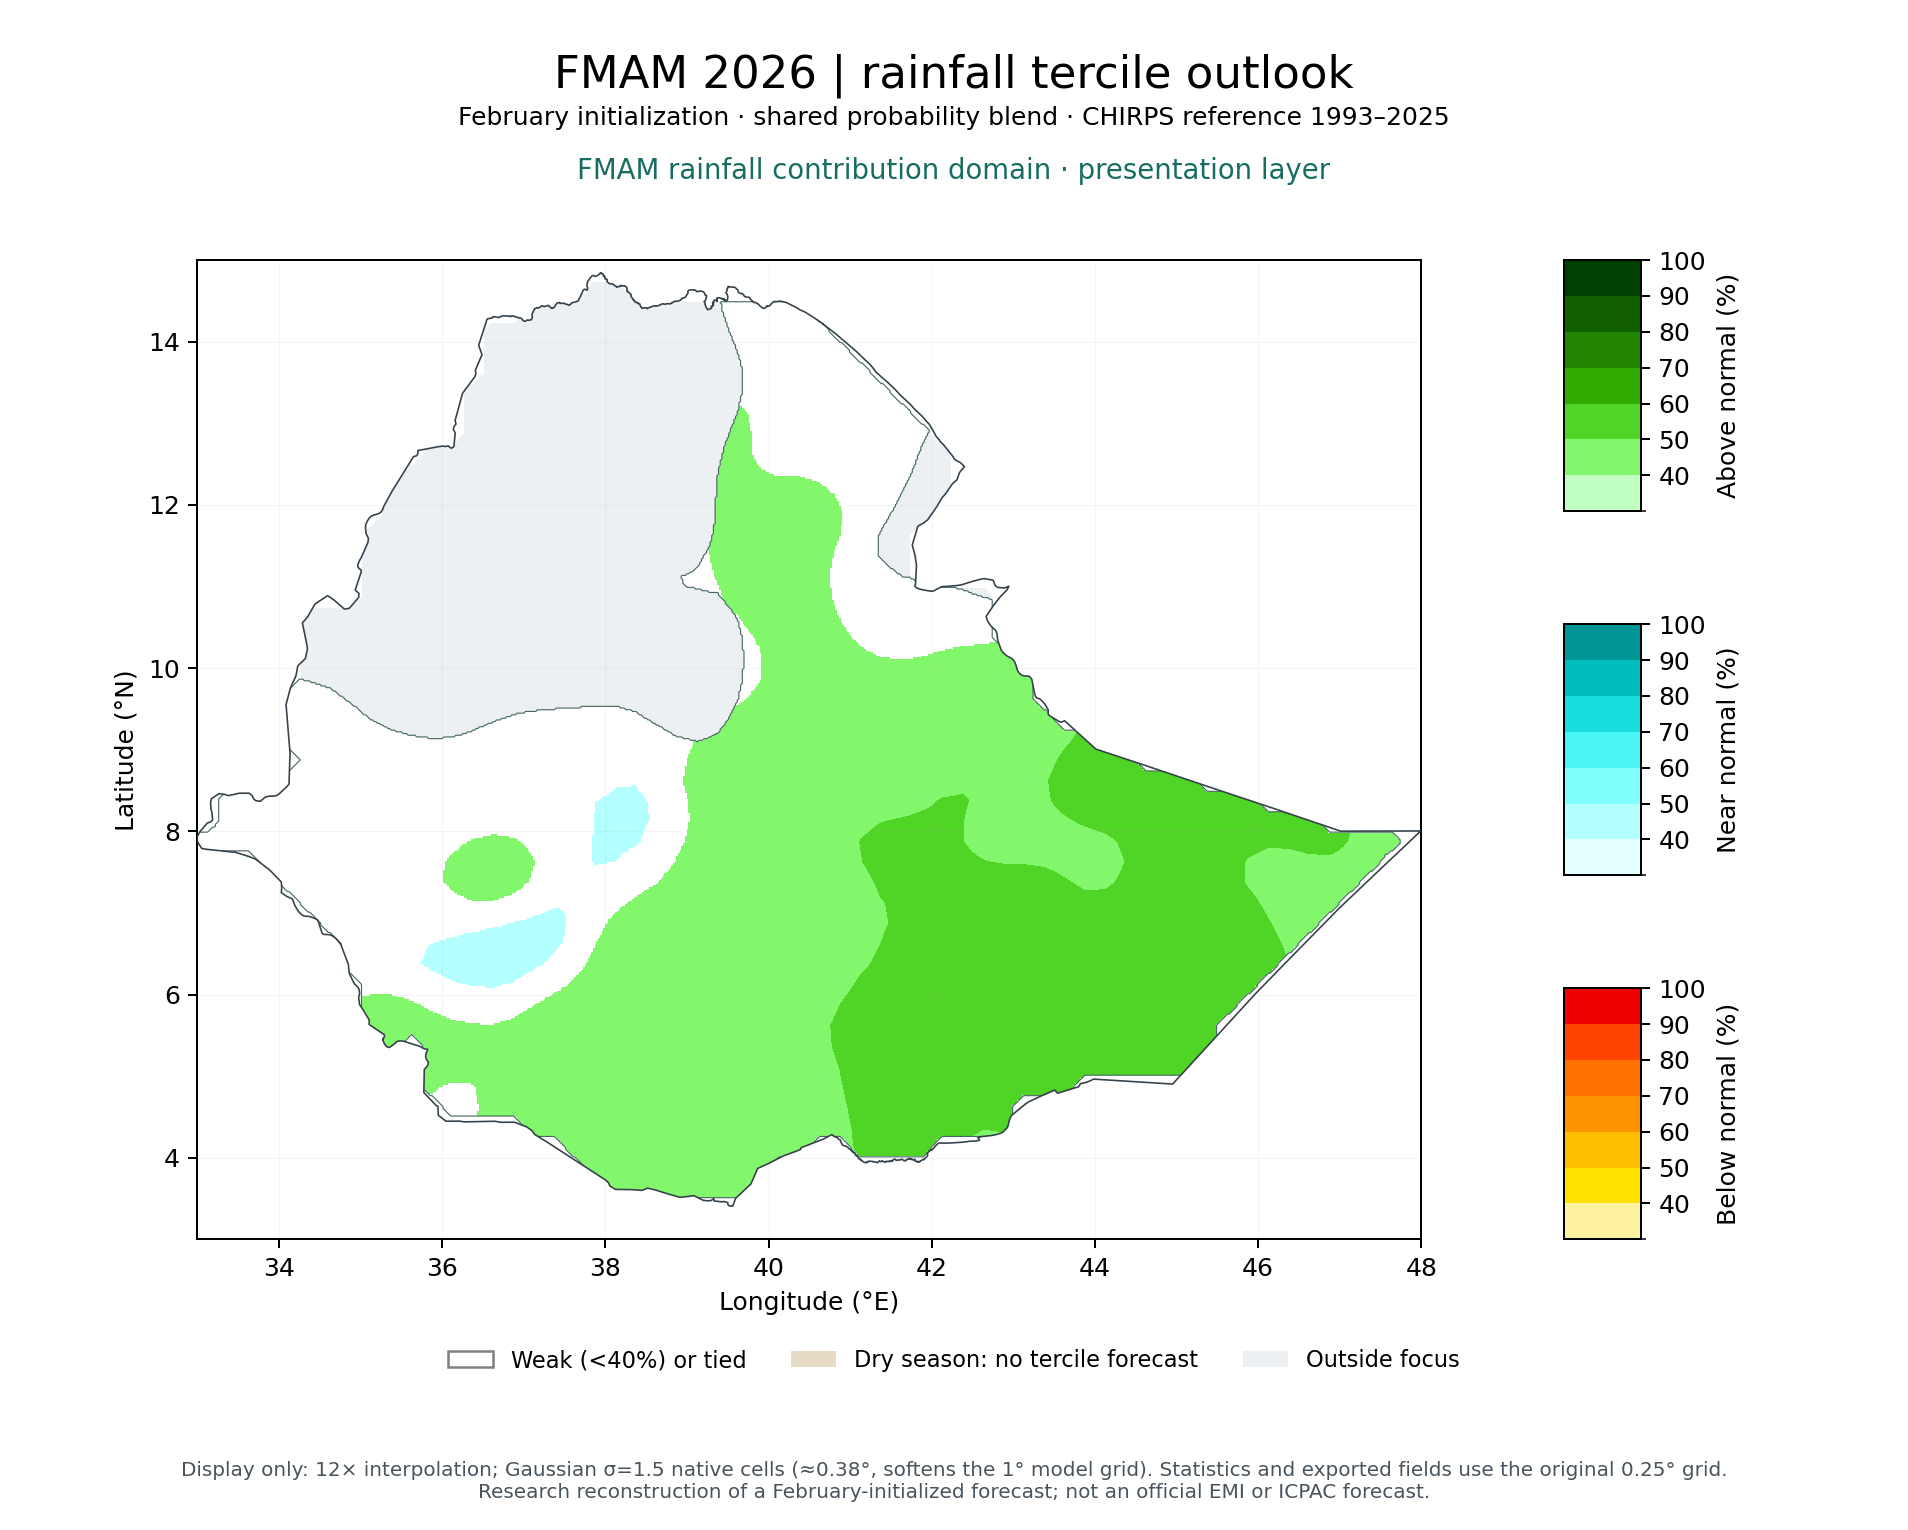 FMAM 2026
B 23% · N 32% · A 44%
Verification published
-
Feb 2026
B 33% · N 39% · A 29%
Verification published
-
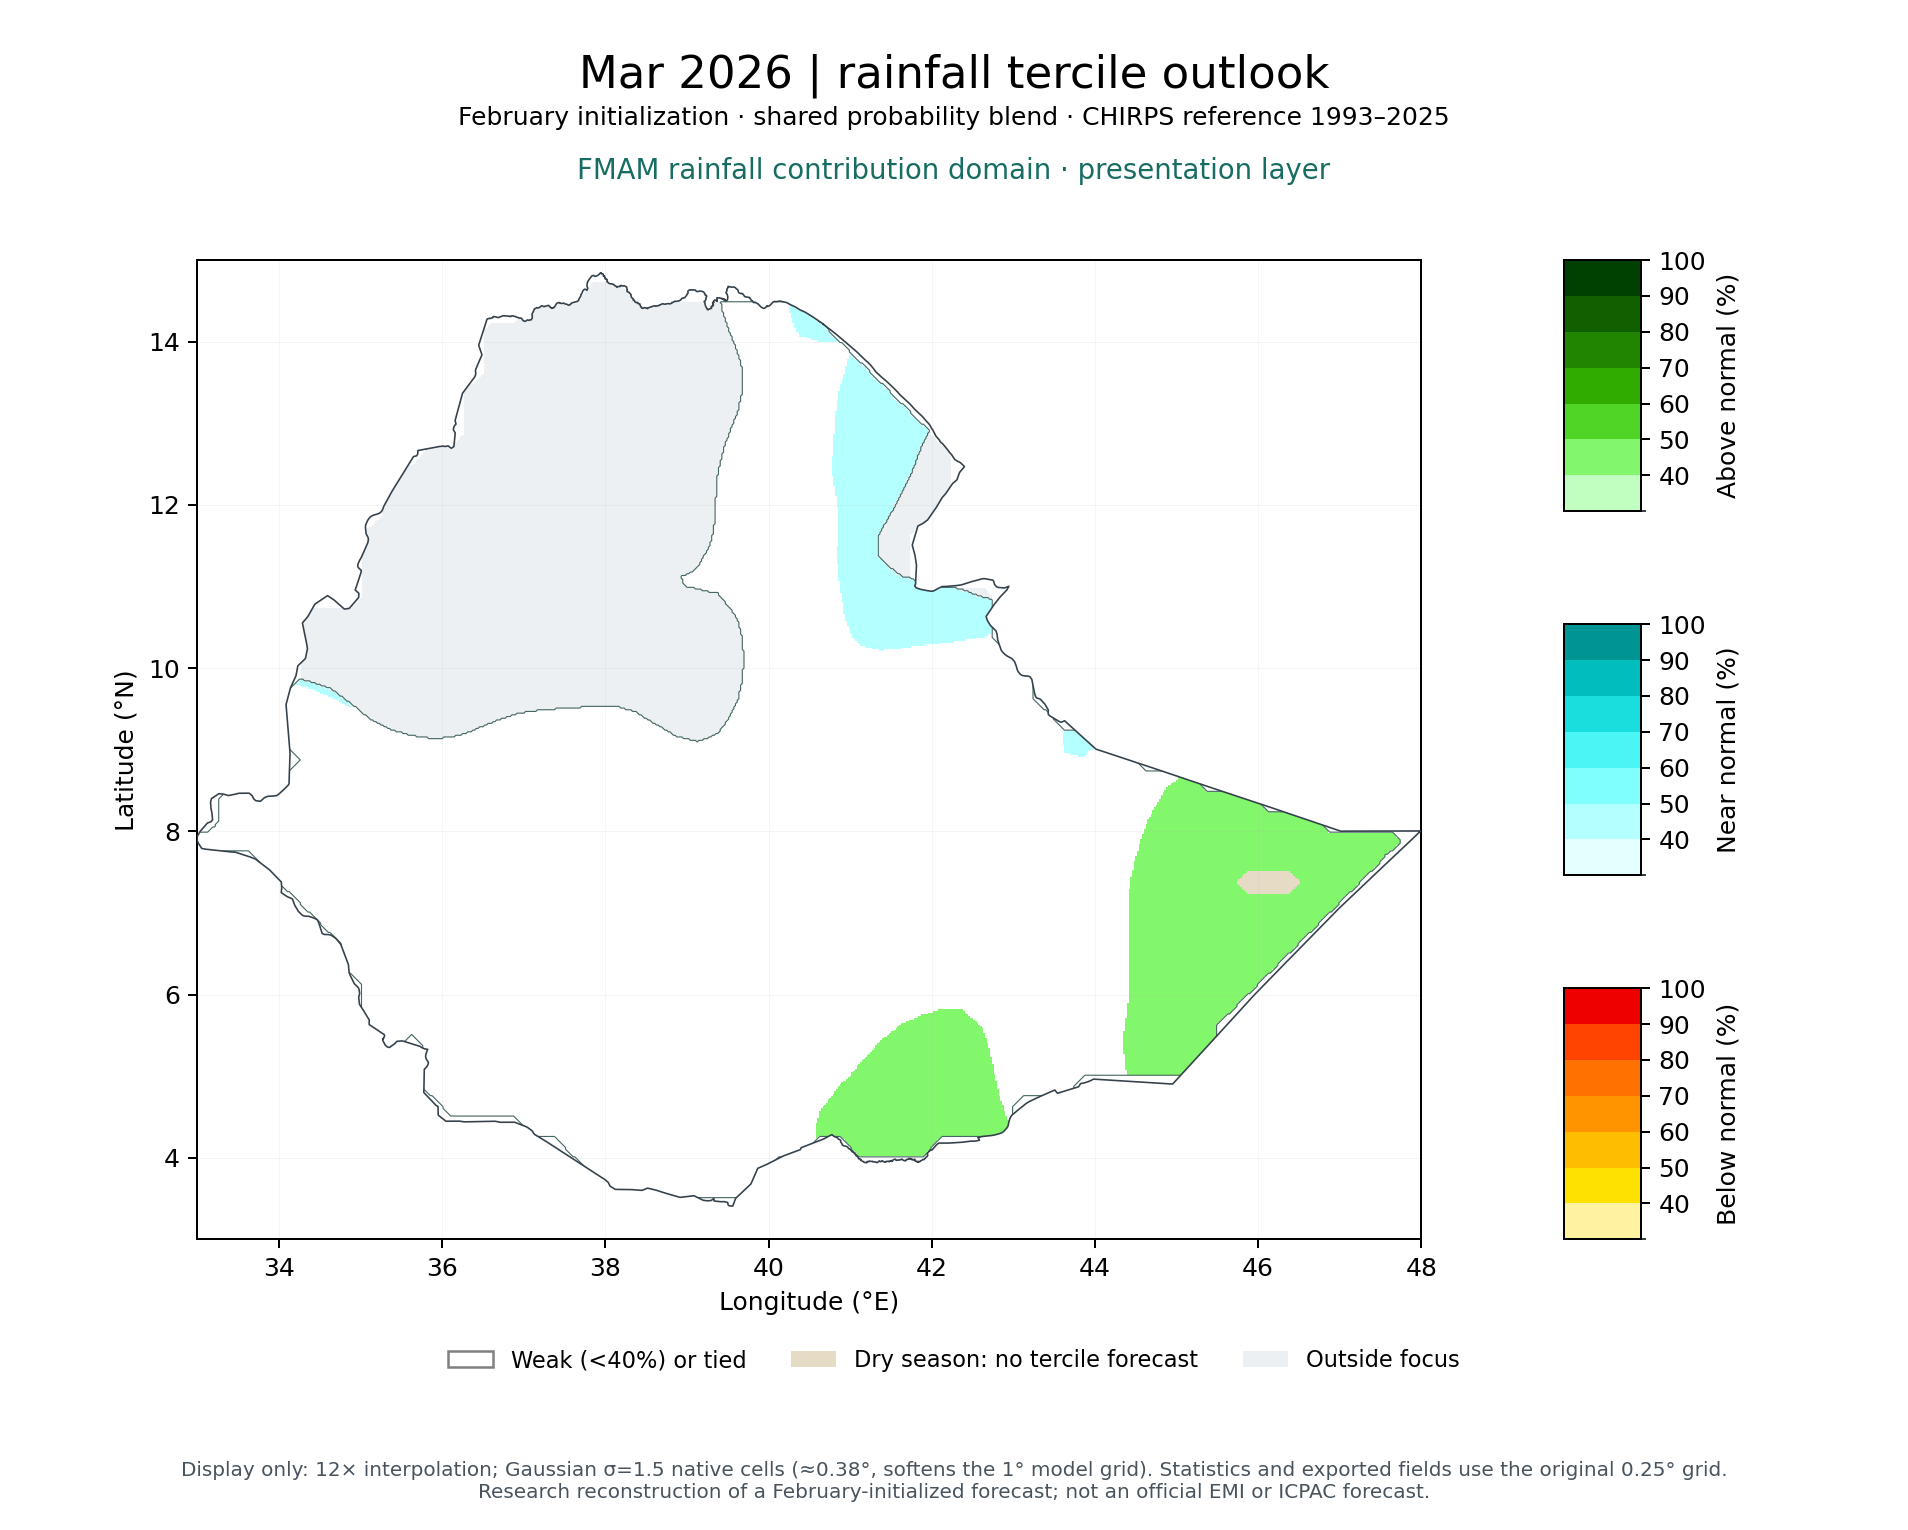 Mar 2026
B 31% · N 34% · A 36%
Verification published
-
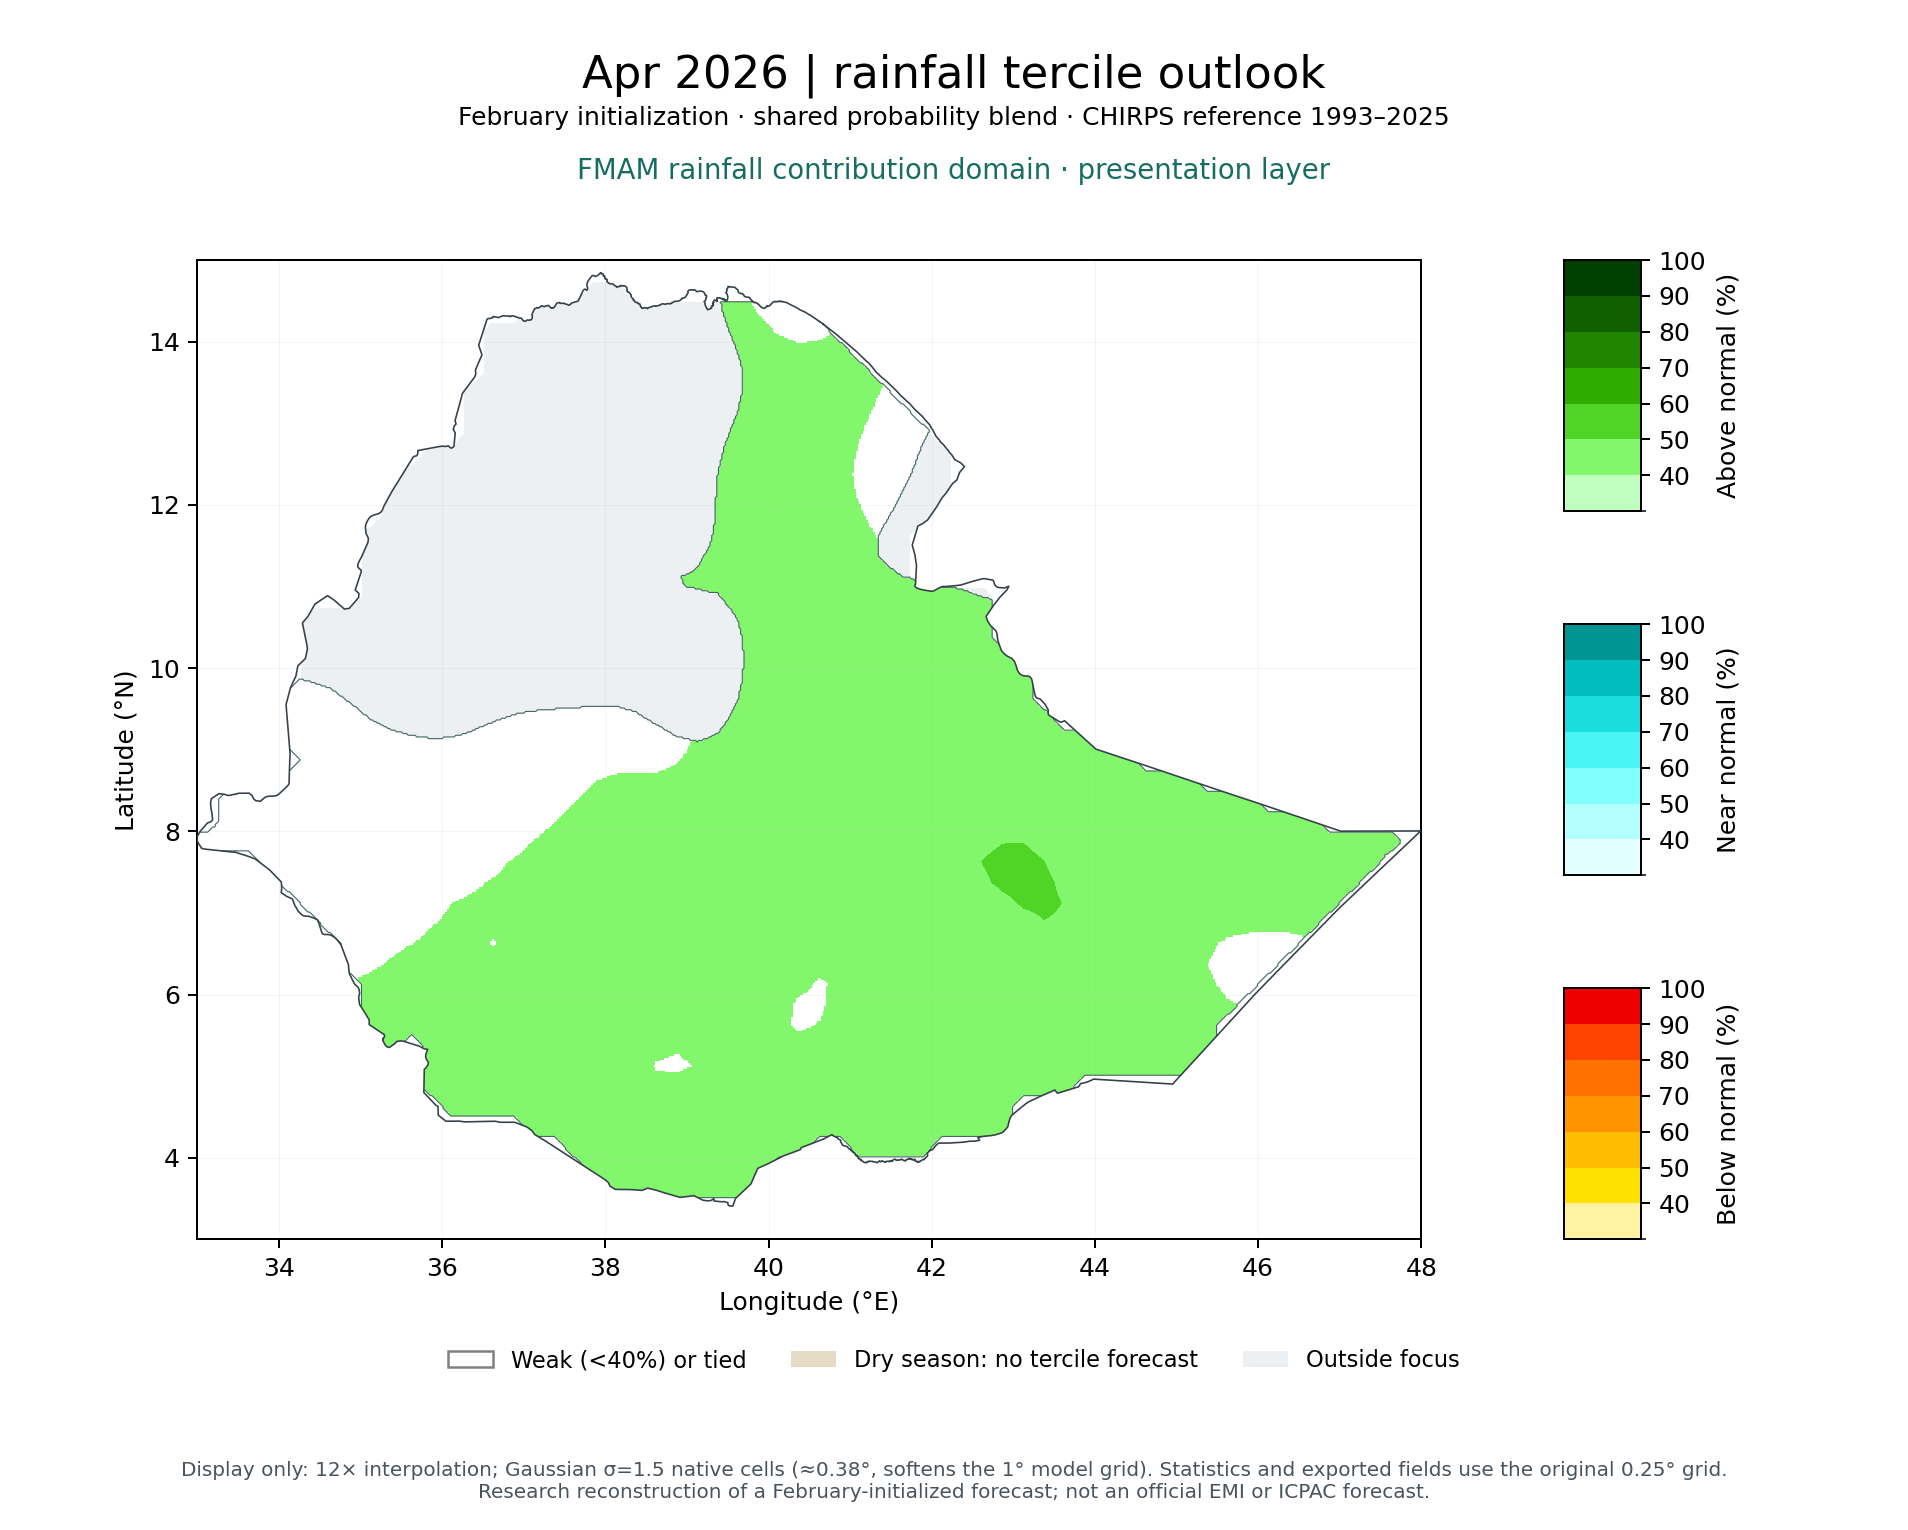 Apr 2026
B 27% · N 31% · A 42%
Verification published
-
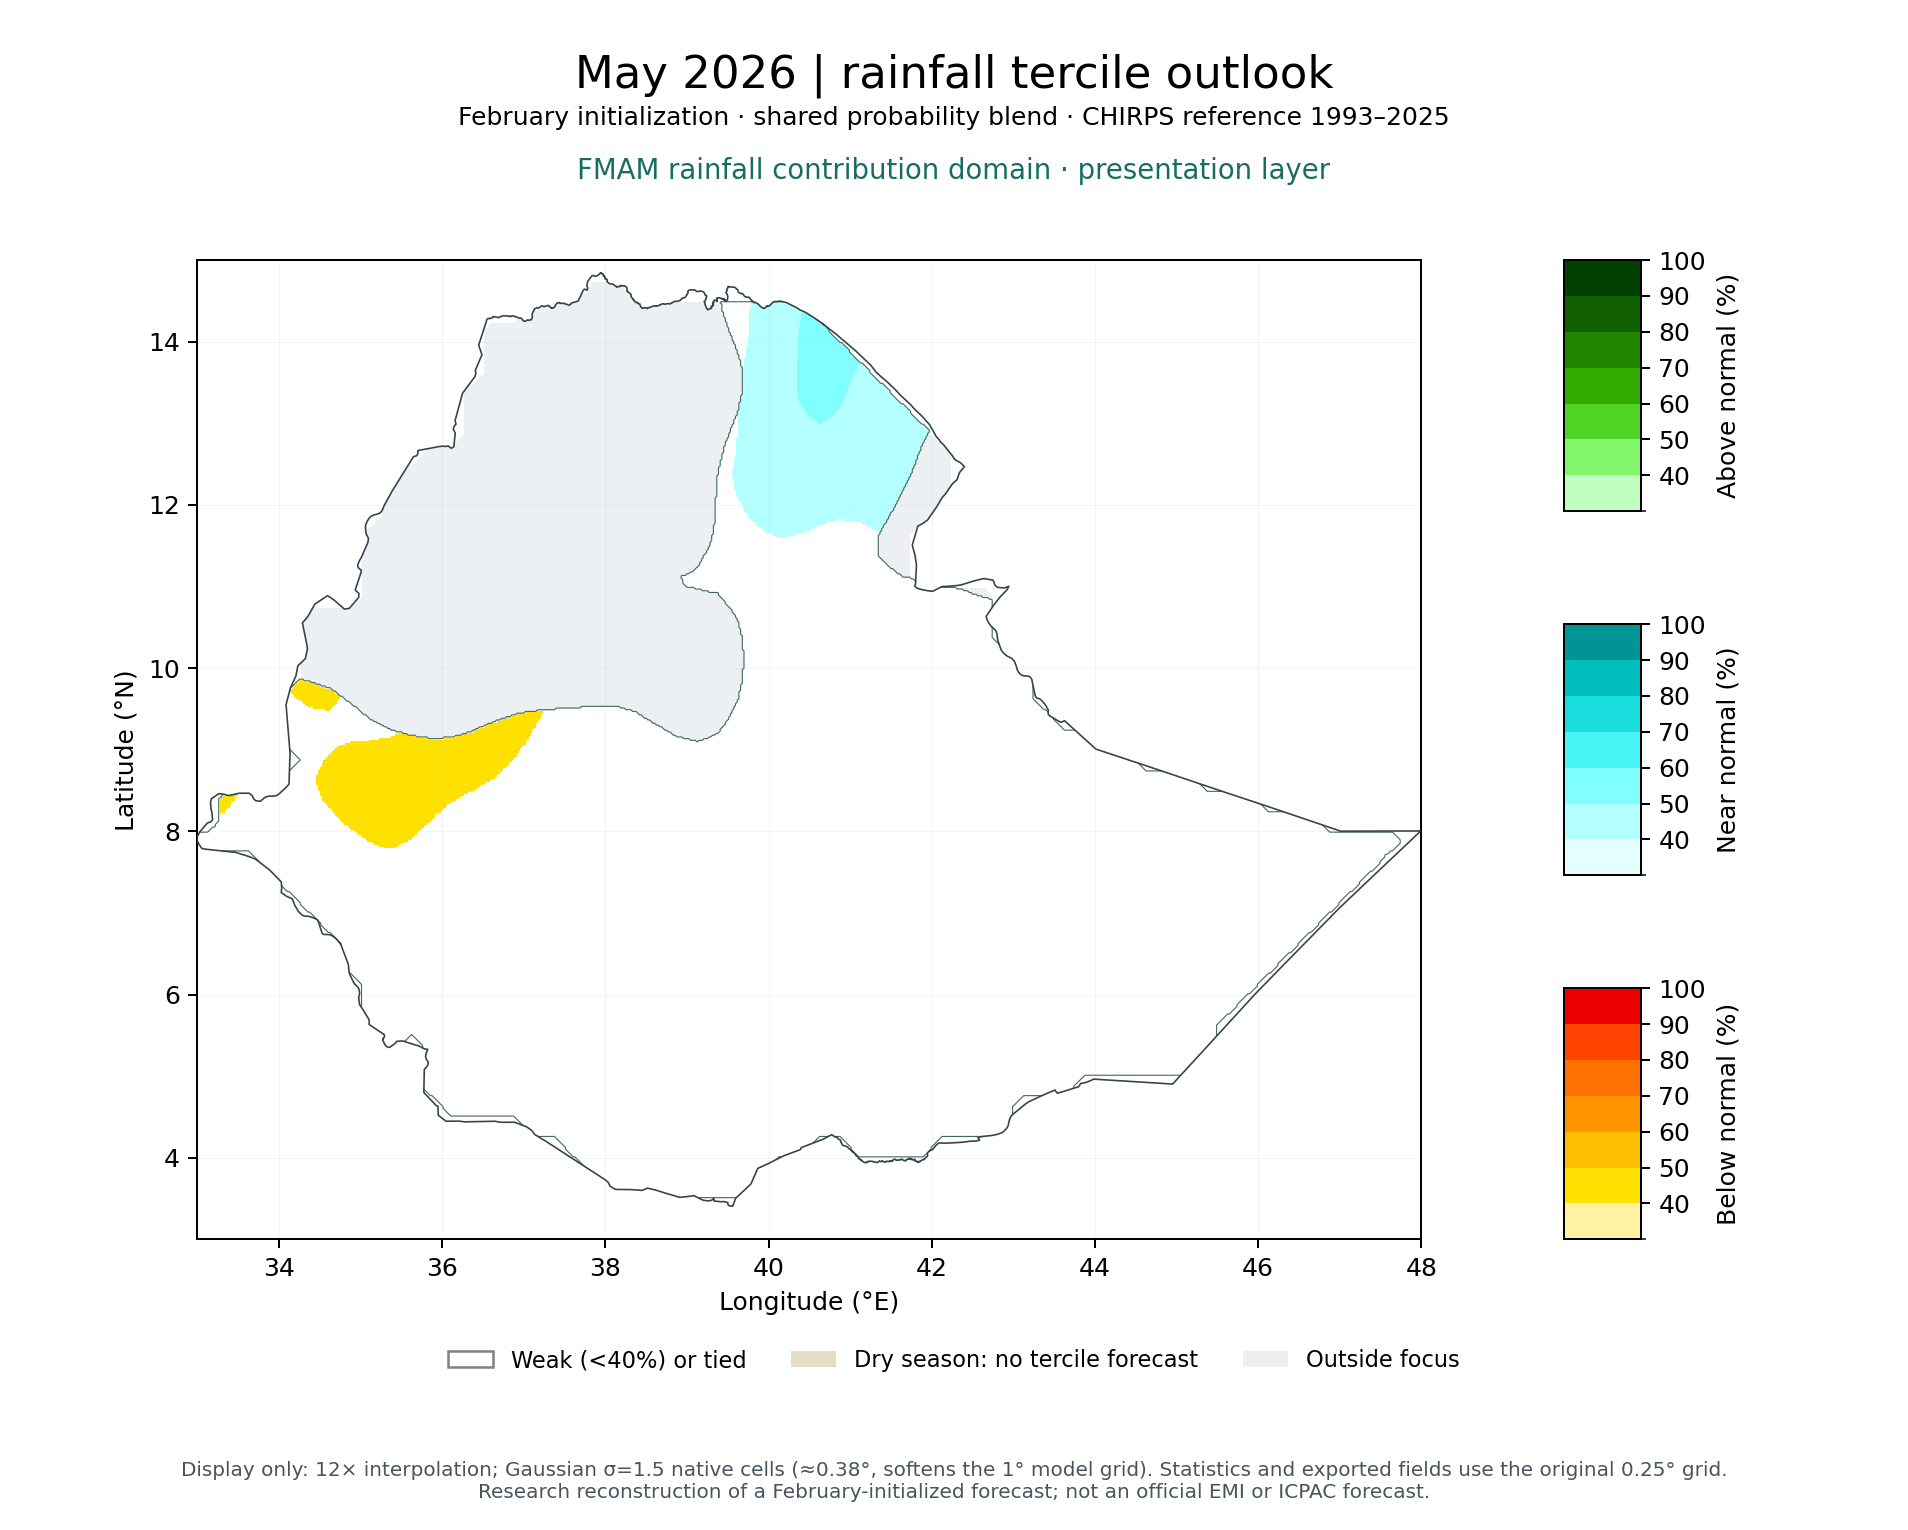 May 2026
B 34% · N 34% · A 32%
Verification published
The targets as a table
| Target | Period | Below / near / above | Probability coverage | Anomaly | Verification status |
|---|---|---|---|---|---|
| FMAM 2026 | 1 Feb 2026 – 31 May 2026 | 23% / 32% / 44% | 100% of area | +37 mm | Verification published |
| Feb 2026 | 1 Feb 2026 – 28 Feb 2026 | 33% / 39% / 29% | 91% of area | −3 mm | Verification published |
| Mar 2026 | 1 Mar 2026 – 31 Mar 2026 | 31% / 34% / 36% | 100% of area | +7 mm | Verification published |
| Apr 2026 | 1 Apr 2026 – 30 Apr 2026 | 27% / 31% / 42% | 100% of area | +32 mm | Verification published |
| May 2026 | 1 May 2026 – 31 May 2026 | 34% / 34% / 32% | 100% of area | −2 mm | Verification published |
Probability coverage is the share of the area with tercile probabilities; averages are over that share only. Cells with very little reference-period rainfall have no terciles.
Maps
How to read this map
Grey, white and blank areas; smoothing and resolution
Light grey: outside the selected area. Dark grey: inside the area but without values, for example cells where reference-period rainfall is too small for tercile categories, or (percent maps) below 10 mm. White on tercile maps: no category reaches 40%, or two categories tie. Sea cells have no CHIRPS data.
Smoothing and resolution. Maps are drawn on a 12× finer display grid with light Gaussian smoothing (σ = 0.6 grid cells); all numbers on this page use the original 0.25° grid. The model's own resolution is about 1°: each model cell covers 4×4 grid cells, so detail within a 1° box comes from local CHIRPS rainfall statistics used in the amount correction, not from the model.