Vulnerability#
Vulnerability determines how much harm a given exposure suffers once a hazard occurs. It is the third term in the pipeline’s IPCC-aligned framework, \(R = H \times E \times V\).
Definition
Vulnerability is “the conditions determined by physical, social, economic and environmental factors or processes which increase the susceptibility of an individual, a community, assets or systems to the impacts of hazards” (UNDRR, 2019). In this pipeline, vulnerability combines sensitivity (how exposed livelihoods are to a given hazard type) and adaptive-capacity deficit (how limited the means to cope or recover are).
In this pipeline#
V_drought– drought vulnerabilityV_wet– excess-wetness vulnerability
Both are composite indices, normalized 0-1 on the same analysis grid as hazard and exposure, where higher values indicate higher vulnerability:
Formula: V_drought#
Weights are the live values in config/vulnerability_indicators.yaml –
every raw indicator is first normalized 0-1 by robust 5th/95th-percentile
scaling (same formula as in the “Formula” section of exposure.md), then direction
is applied (invert for a beneficial raw indicator, e.g. higher irrigation
S_no_electricity_access is a derived indicator, not a direct layer:
gdessa_no_access / population, clipped to [0, 1] (see
src/hydroclim_risk/vulnerability/indicators.py).
Formula: V_wet#
The five sensitivity_wet indicators are weighted equally (0.20 each) –
elevation captures regional low-lying-ness, slope captures local
flatness/drainage, soil clay captures infiltration capacity, and river
distance captures direct flood exposure, so they’re treated as complementary
rather than redundant (no methodology-specified sub-weighting exists yet).
Vulnerability sub-indicators and data sources#
Sub-indicator |
Feeds |
Source |
License |
|---|---|---|---|
Relative wealth index |
Sensitivity (both) |
Meta Data for Good |
CC-BY 4.0 |
Irrigated area percent |
Adaptive capacity (drought) |
FAO GMIA v5 |
CC-BY 4.0 |
Aridity index |
Sensitivity (drought) |
CGIAR-CSI / Global Aridity Index v3 |
CC-BY 4.0 |
Population without electricity access |
Adaptive capacity (both) |
IIASA/GDESSA |
CC-BY 4.0 |
Elevation and slope |
Sensitivity (wet) |
NOAA ETOPO 2022 |
Public domain |
Topsoil clay content |
Sensitivity (wet, drainage) |
ISRIC SoilGrids 2.0 |
CC-BY 4.0 |
Distance to rivers/water bodies |
Sensitivity (wet) |
OpenStreetMap (via Geofabrik) |
ODbL |
Full citations, acquisition modules, and output file names are in data_provenance.md.
Layer statistics#
Composite indices, computed on the analysis grid (post country-mask):
Layer |
Valid cells |
Min |
Mean |
Max |
|---|---|---|---|---|
V_drought (0-1) |
1,489 / 2,880 |
0.09 |
0.58 |
0.97 |
V_wet (0-1) |
1,485 / 2,880 |
0.28 |
0.56 |
0.81 |
Raw sub-indicators (domain grid, before the final country-boundary mask):
Sub-indicator |
Min |
Mean |
Max |
|---|---|---|---|
Relative wealth index |
-1.16 |
-0.46 |
0.17 |
Irrigated area (%) |
0.0 |
0.7 |
88.0 |
Aridity index |
0.00 |
0.34 |
1.47 |
Population w/o electricity access |
766 |
58,451 |
2,599,120 |
Slope (degrees) |
0.0 |
2.1 |
20.4 |
Topsoil clay content (%) |
12.5 |
32.0 |
62.8 |
Distance to river/water body (km) |
0.0 |
74.5 |
636.6 |
Representative figures#
V_drought |
V_wet |
|---|---|
|
|
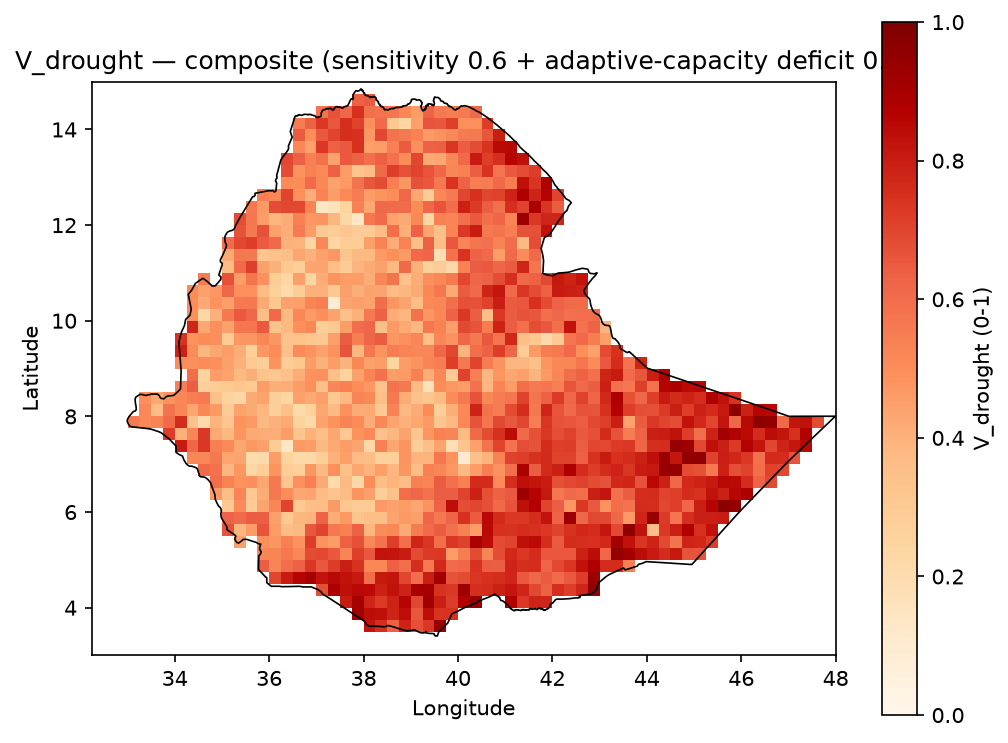
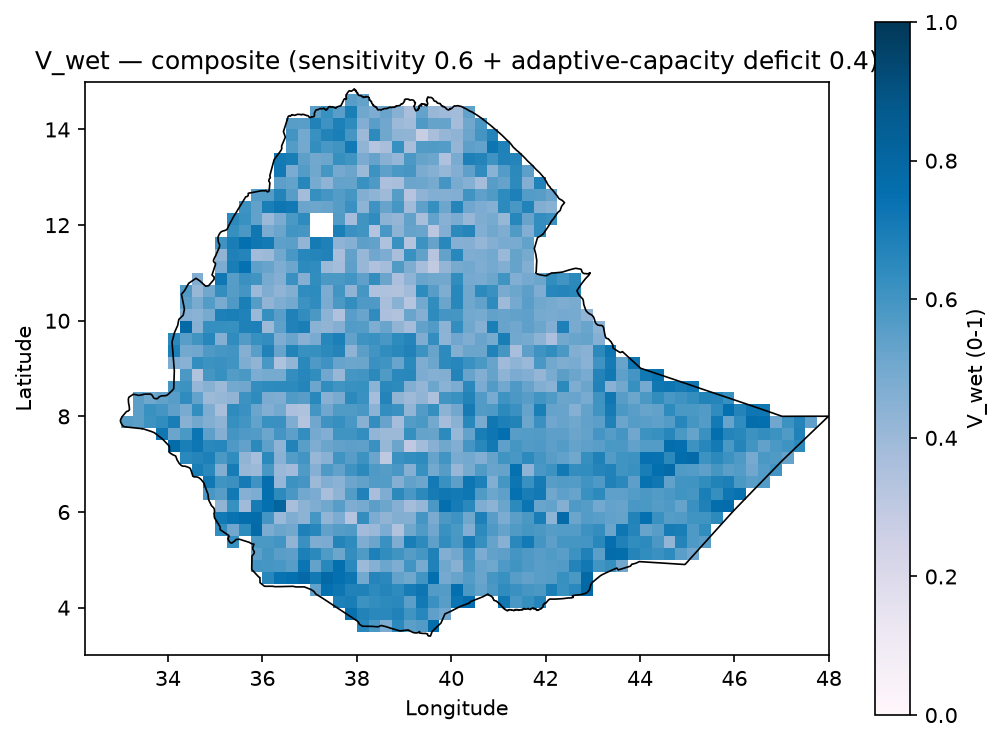
Composite vulnerability, normalized 0-1, Ethiopia-clipped.
Inspect the full layers#
Two notebooks carry the complete, machine-readable detail behind this page. Both are listed in the left sidebar under the Exposure page (jupyter-book’s table of contents does not allow the same notebook to be nested under two different pages).
Exposure and vulnerability GeoTIFF notebook
inspect_exposure_geotiffs.html – V_drought and V_wet maps, component interpretation notes, summary statistics, and boundary-clipped previews.
Raw source inspection notebook
inspect_exposure_vulnerability_raw_sources.html – native inputs (aridity, irrigation, electrification access, waterways and water bodies, relative wealth index) prior to resampling.