Ctrl+K

Hydroclimatic Risk Mapping - Ethiopia

Overview

  • Documentation
  • Hydroclimatic Risk Mapping — Ethiopia

Core Components

  • Hazards
  • Exposure
    • Inspect Exposure and Vulnerability
    • Inspect Raw Exposure & Vulnerability Source Files
  • Vulnerability

Method And Data

  • Methodology Reference
  • Data Provenance

Outputs And Validation

  • Results Gallery
  • Reproducibility
  • Repository
  • Suggest edit
  • Open issue
  • .md

Results Gallery

Contents

  • Hazard
    • Drought and excess wetness hazard (JJAS)
    • Combined hazard (max operator)
  • Probability and Severity
  • Vulnerability
  • Risk
  • Notes

Results Gallery#

Representative outputs from the Ethiopia seasonal run, with the formula and data behind each stage shown next to its result. Full derivations and weights are in methodology.md; component-level detail (data sources, sub-indicator breakdowns) is in hazards.md, exposure.md, and vulnerability.md.

Hazard#

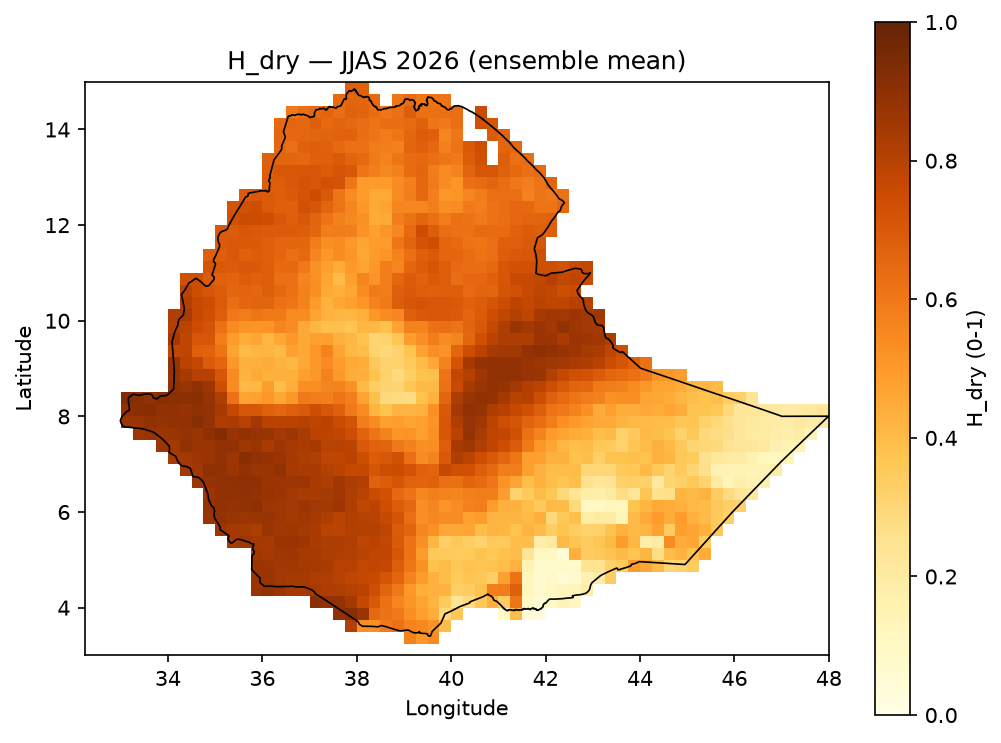
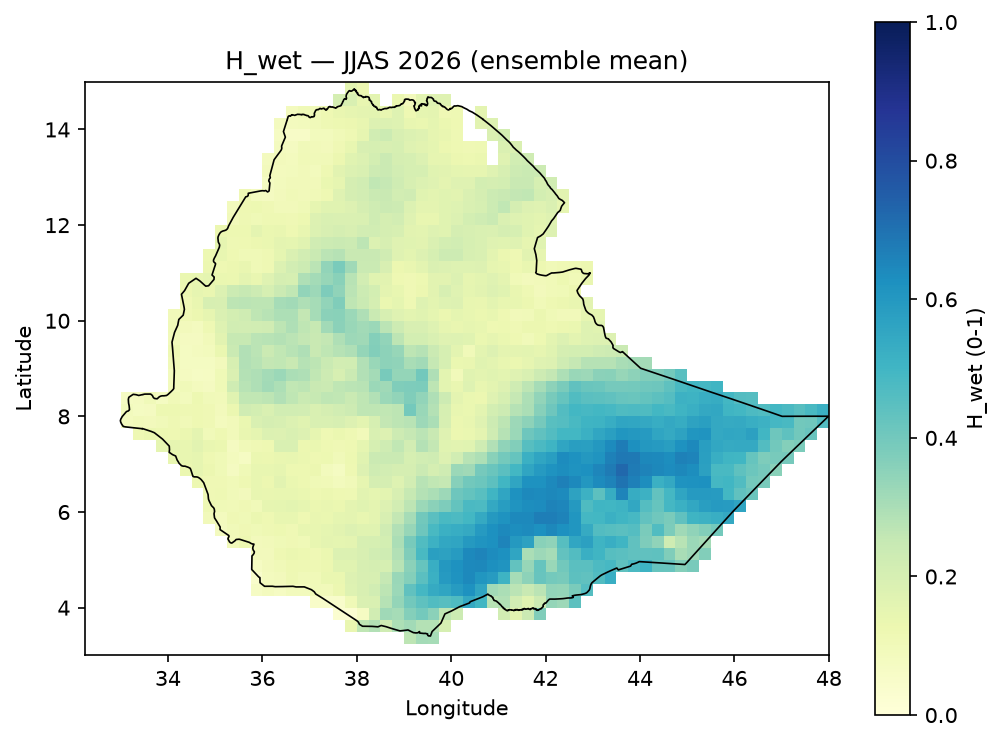
\[ H_{dry} = 0.35 S_{SPI,dry} + 0.20 S_{rain,dry} + 0.30 S_{CDD,dry} + 0.15 S_{CWD,dry} \qquad H_{wet} = 0.20 S_{SPI,wet} + 0.20 S_{rain,wet} + 0.20 S_{CWD,wet} + 0.15 S_{Rx1day,wet} + 0.25 S_{Rx5day,wet} \]

Data: SPI, rainfall percentile, CDD, CWD, Rx1day, Rx5day per ensemble member, from the sibling indicator-calculation project (see data_provenance.md).

Drought and excess wetness hazard (JJAS)#

H_dry

H_wet

H_dry JJAS

H_wet JJAS

Combined hazard (max operator)#

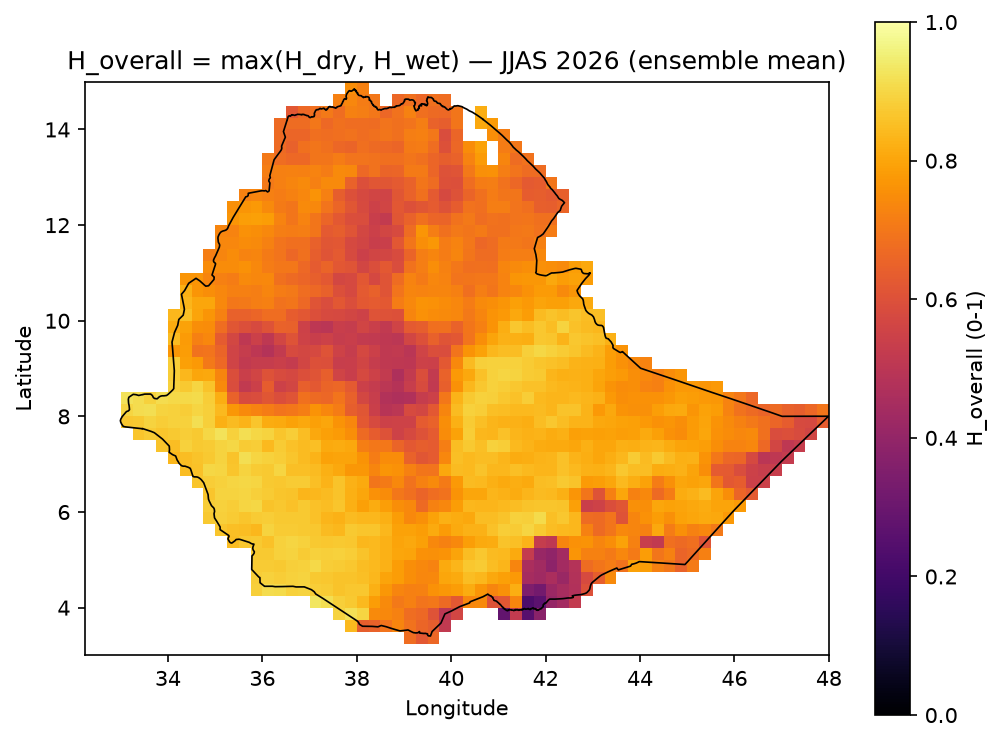
\[ H_{overall} = \max(H_{dry}, H_{wet}) \]

H_overall JJAS

Probability and Severity#

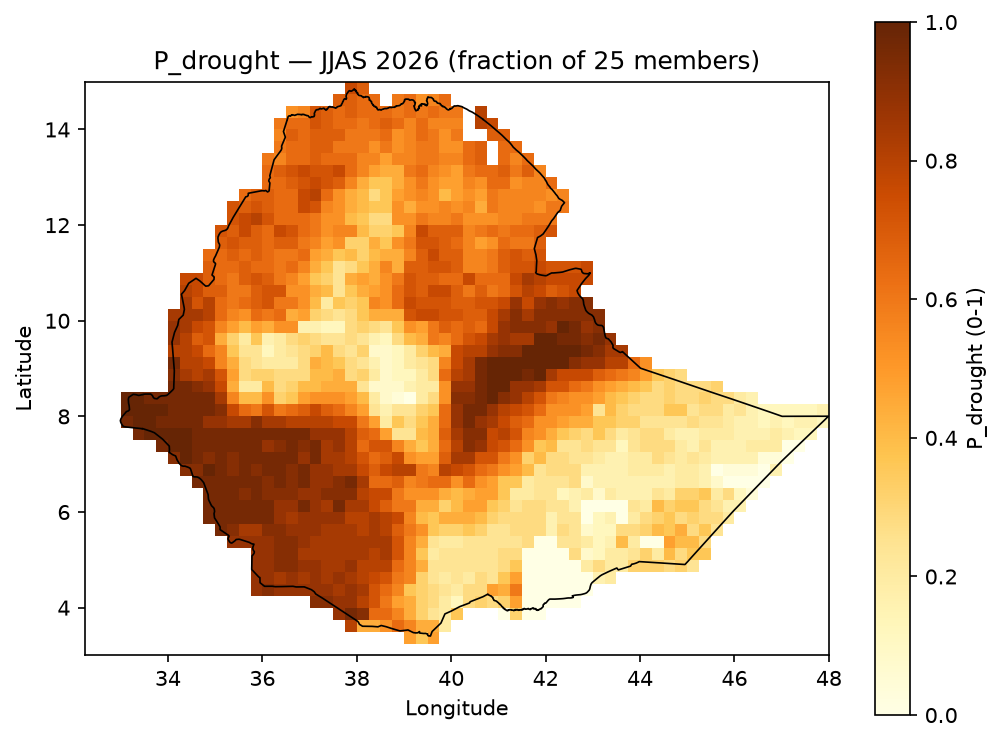
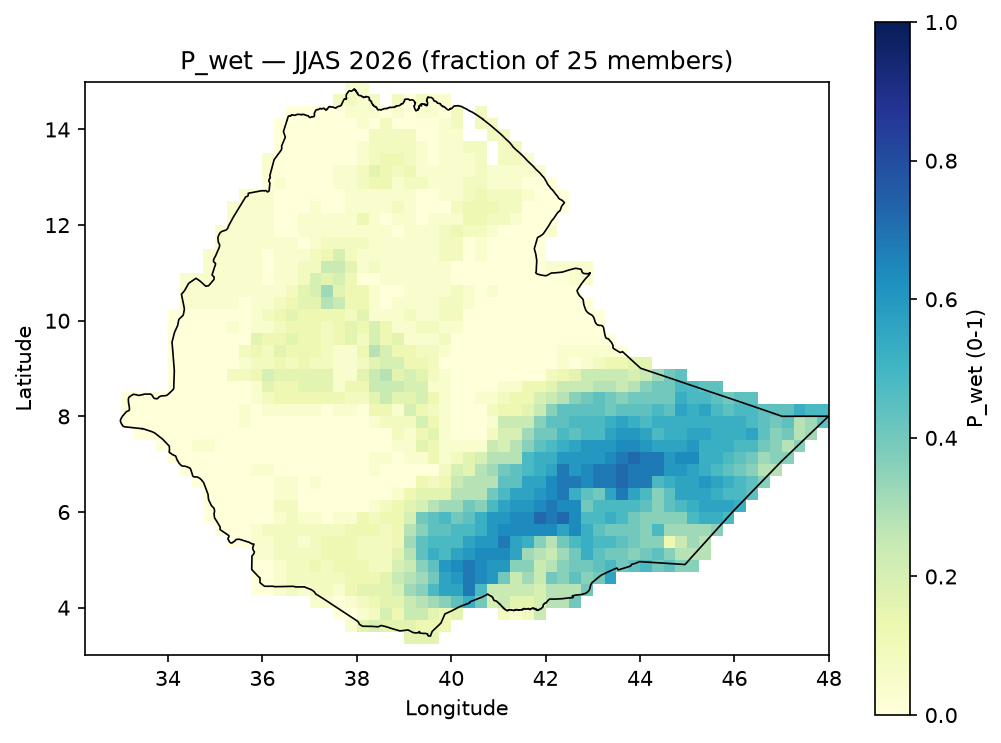
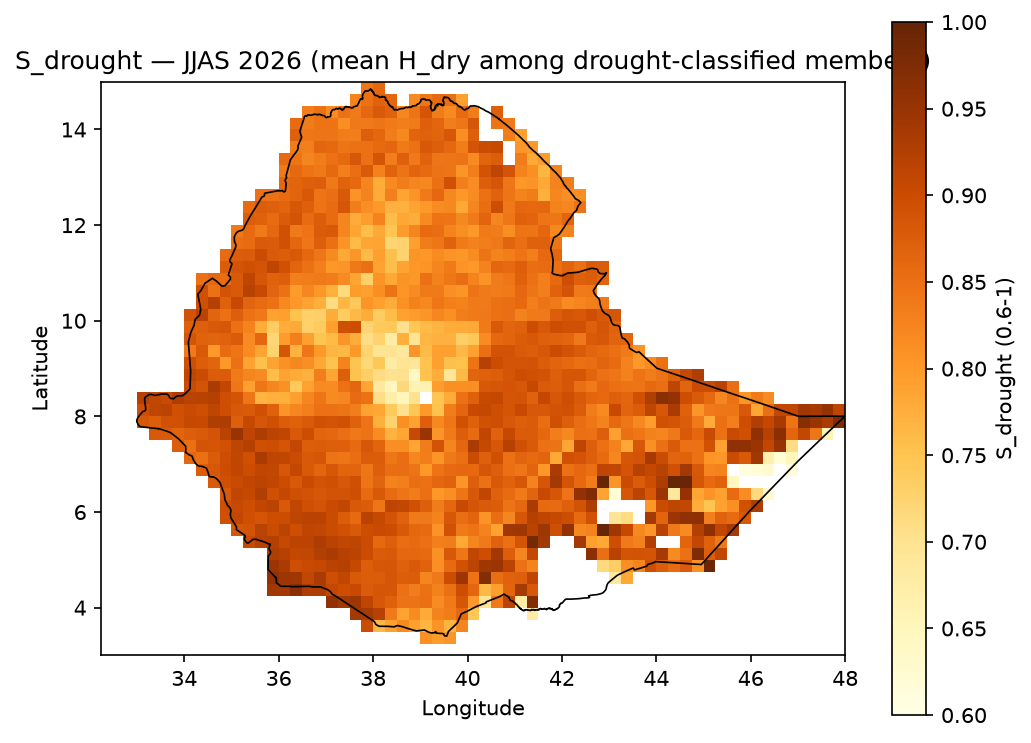
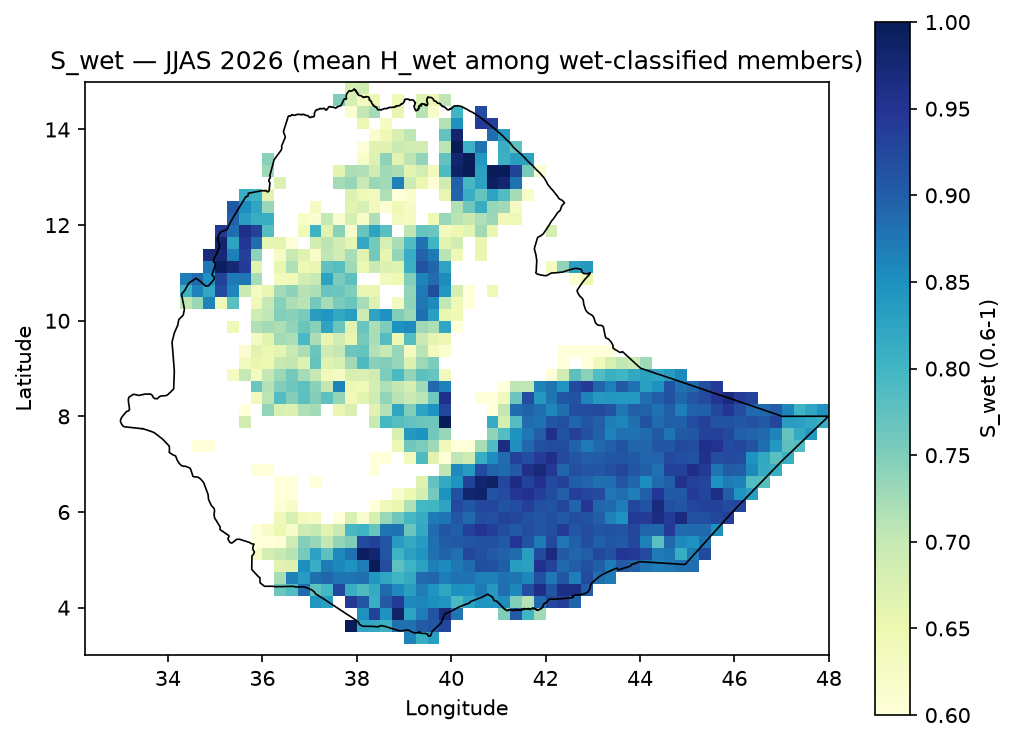
\[ P_{drought} = \frac{\mathrm{count}(H_{dry} \geq 0.60)}{\text{total ensemble members}} \qquad S_{drought} = \mathrm{mean}(H_{dry} \text{ among members classified as drought events}) \]

(P_wet/S_wet are the mirror-image definitions using H_wet.) With this project’s 25-member ensemble, probability moves in steps of 1/25 = 4%.

Data: same per-member H_dry/H_wet fields as above, collapsed across the ensemble dimension.

P_drought

P_wet

P_drought JJAS

P_wet JJAS

S_drought

S_wet

S_drought JJAS

S_wet JJAS

Vulnerability#

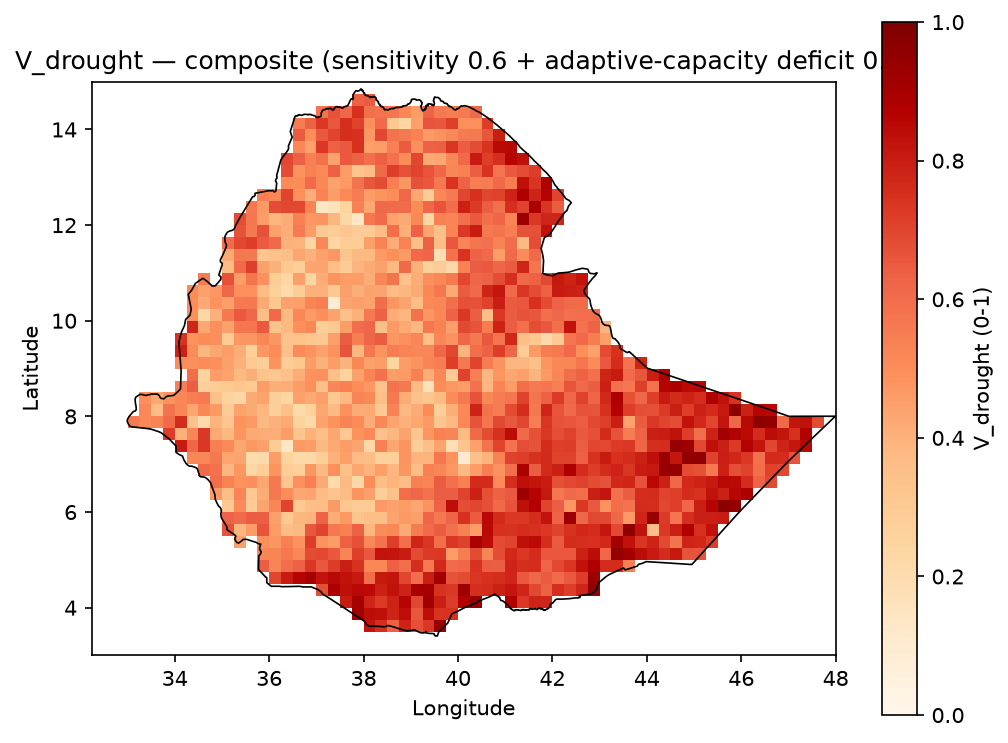
\[ V_{drought} = 0.60 (0.5 S_{poverty} + 0.5 S_{aridity}) + 0.40 (0.5 S_{irrigation\_deficit} + 0.5 S_{no\_electricity\_access}) \]
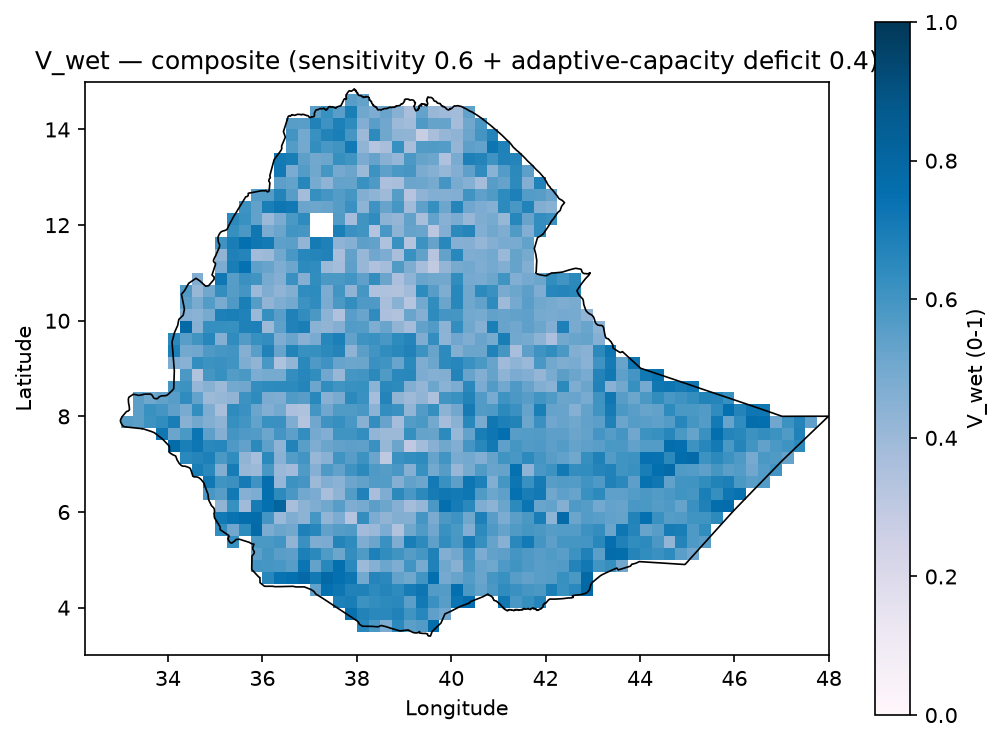
\[ V_{wet} = 0.60 (0.20 S_{poverty} + 0.20 S_{elevation} + 0.20 S_{slope} + 0.20 S_{soil\_clay} + 0.20 S_{river\_distance}) + 0.40 (0.5 S_{healthsites\_deficit} + 0.5 S_{no\_electricity\_access}) \]

Data: relative wealth index, aridity index, irrigated-area percent, population without electricity access, elevation, slope, topsoil clay content, distance to rivers/water bodies, health facility count – see vulnerability.md for the exact source per indicator.

V_drought

V_wet

V_drought

V_wet

Risk#

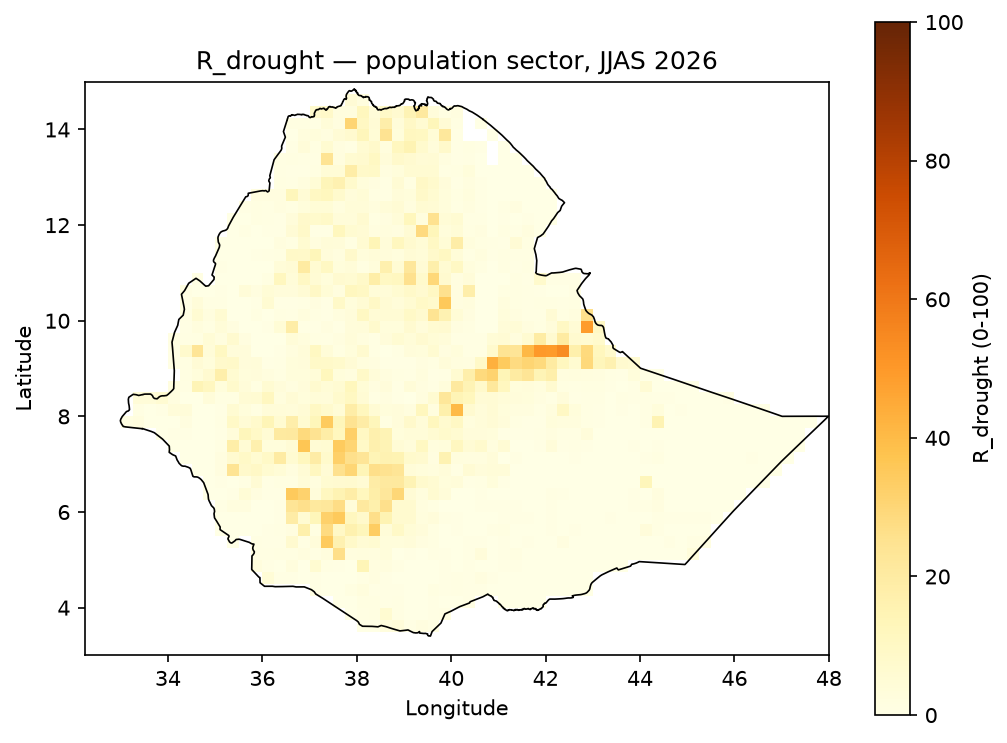
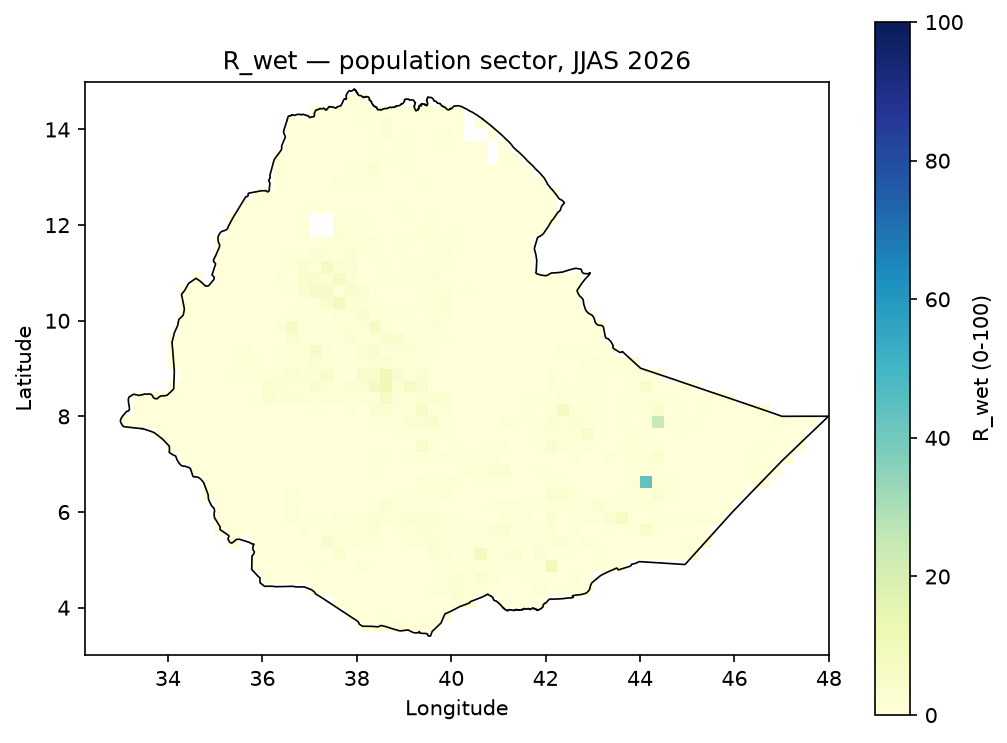
\[ R_{drought} = 100 \cdot P_{drought} \cdot S_{drought} \cdot E \cdot V_{drought} \qquad R_{wet} = 100 \cdot P_{wet} \cdot S_{wet} \cdot E \cdot V_{wet} \]
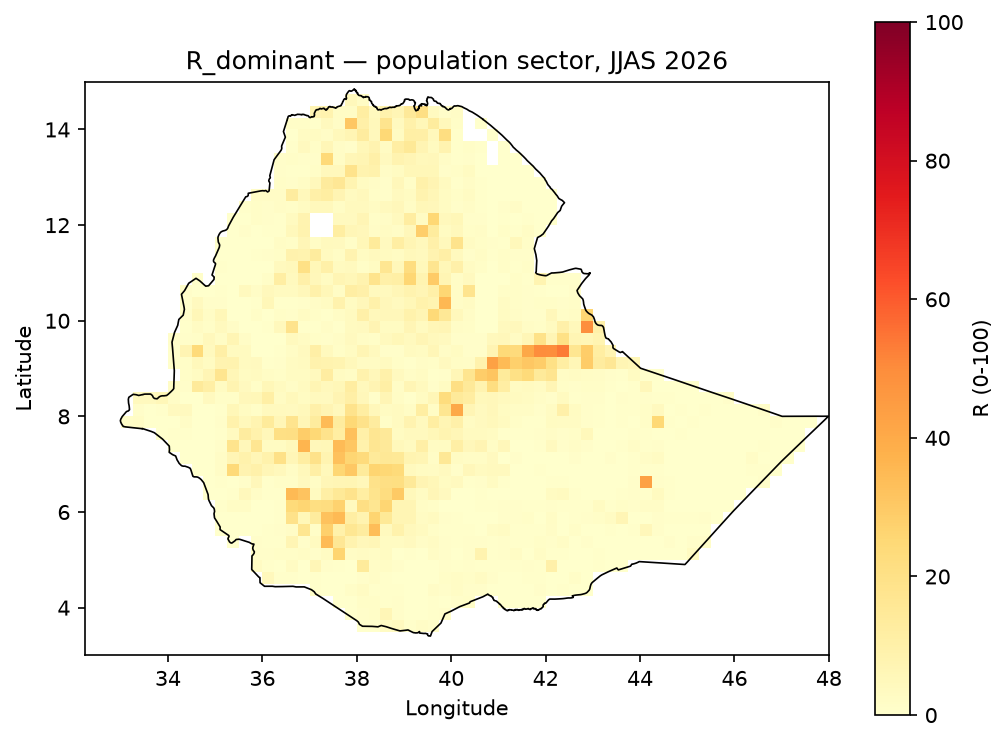
\[ R_{dominant} = \max(R_{drought}, R_{wet}) \]

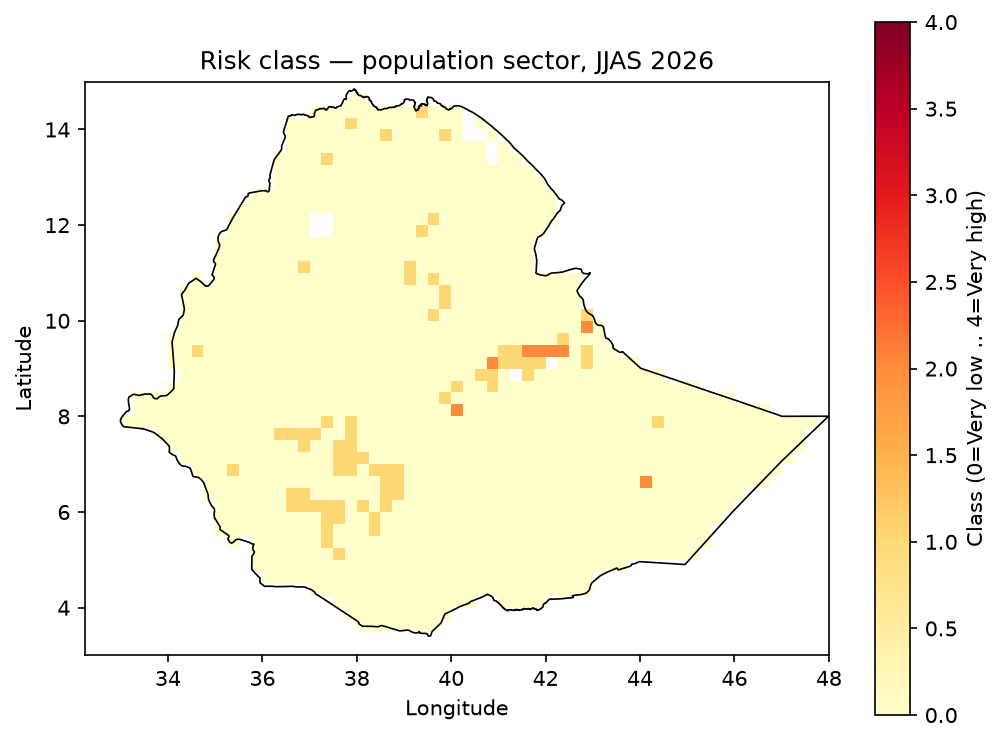
\(R\) is a relative 0-100 score, not a probability percentage, computed per exposure sector (the figures below use population). Risk class boundaries:

Range

Class

0-19.9

Very low

20-39.9

Low

40-59.9

Moderate

60-79.9

High

80-100

Very high

Data: P/S from the Hazard/Probability stage above, E from exposure.md (population sector, normalized), V from the Vulnerability stage above.

R_drought

R_wet

R_drought

R_wet

Dominant risk

Risk class

R_dominant

Risk class

Notes#

  • These figures are rendered products intended for interpretation and communication.

  • Full machine-readable outputs are in outputs/geotiff/ and outputs/netcdf/.

  • Hazard composition and standardization details are documented in methodology.md.

previous

Data Provenance

next

Reproducibility

Contents
  • Hazard
    • Drought and excess wetness hazard (JJAS)
    • Combined hazard (max operator)
  • Probability and Severity
  • Vulnerability
  • Risk
  • Notes

By YonSci

Last updated on Jul 29, 2026.

Hydroclimatic Risk Mapping
Seasonal drought and excess-wetness risk mapping for Ethiopia using Risk = Hazard x Exposure x Vulnerability.
How to cite: YonSci, Hydroclimatic Risk Mapping - Ethiopia, github.com/YonSci/hydroclimatic-risk-mapping.
Code license: MIT. Third-party data retain their own licenses -- see Data Provenance for the full list.