Exposure#
Exposure identifies what is present in the landscape and how much of it sits in areas where hazard is elevated. It is the second term in the pipeline’s IPCC-aligned framework, \(R = H \times E \times V\).
Definition
Exposure is “the situation of people, infrastructure, housing, production capacities and other tangible human assets located in hazard-prone areas” (UNDRR, 2019). Exposure alone does not imply risk – it becomes risk only once combined with hazard and vulnerability.
In this pipeline#
Exposure is represented as sector-specific layers on the same 0.25 degree analysis grid used by hazard and vulnerability, so all three terms can be multiplied cell-by-cell. Each sector is kept as its own absolute layer (people, hectares, head count, m^2, km, count) plus a 0-1 normalized layer used in risk composition – sectors are never blended into a single generic “exposure index.”
Exposure sectors and data sources#
Sector |
Indicator(s) |
Source |
License |
|---|---|---|---|
Population |
Population count |
WorldPop |
CC-BY 4.0 |
Cropland |
Cropland fraction (total, irrigated, rainfed split) |
ESA WorldCover 10m v200 (2021) + FAO GMIA v5 |
CC-BY 4.0 |
Livestock |
Cattle, sheep, goat head count |
FAO Gridded Livestock of the World v4 (2020) |
CC-BY 4.0 |
Built-up surface |
Built-up surface area |
JRC GHS-BUILT-S R2023A |
CC-BY 4.0 |
Roads and buildings |
Road length, building count |
OpenStreetMap (via Geofabrik) |
ODbL |
Health facilities |
Health facility count |
Global Healthsites Mapping Project (via HDX) |
ODbL |
Full citations, acquisition modules, and output file names are in data_provenance.md.
Formula#
Exposure sectors are not weighted-combined the way hazard and vulnerability are – each sector stays its own layer (see “In this pipeline” above). What each sector does go through is robust normalization, so every sector lands on the same 0-1 scale before it multiplies into risk:
where \(x\) is the sector’s absolute value at a cell and \(p_5\)/\(p_{95}\) are
that sector’s 5th/95th percentile across all valid cells (not a global
min-max, so a handful of extreme cells – e.g. Addis Ababa’s population
count – don’t compress every other cell toward 0). This is the exact
robust_percentile_normalize function
(src/hydroclim_risk/layers.py) also used by the vulnerability module.
Data used#
See the sector table above and data_provenance.md for exact source files and acquisition modules.
Result#
See “Layer statistics” and “Representative figure” below, or the full per-sector maps in the Exposure GeoTIFF inspection notebook.
Layer statistics (analysis grid, absolute units)#
Computed directly from outputs/exposure_vulnerability/*.tif – the same
files the notebooks inspect.
Layer |
Valid cells |
Min |
Mean |
Max |
Total |
|---|---|---|---|---|---|
Population (people) |
1,481 / 2,880 |
448 |
70,513 |
3,299,466 |
104,430,083 |
Cropland fraction (0-1) |
2,880 / 2,880 |
0.00 |
0.14 |
1.00 |
– |
Cattle head count |
2,611 / 2,880 |
0 |
33,577 |
489,389 |
87,668,763 |
Built-up surface (m^2) |
2,880 / 2,880 |
0 |
1,078,737 |
225,454,809 |
3,106,762,115 |
Road length (km) |
2,880 / 2,880 |
0.0 |
129.3 |
4,045.3 |
372,412 |
Building count |
2,880 / 2,880 |
0 |
887 |
81,078 |
2,554,920 |
Health facility count |
2,880 / 2,880 |
0 |
0.27 |
129 |
777 |
Valid-cell counts differ by sector because each source has its own native coverage before resampling (e.g. WorldPop has no population in uninhabited cells); this is expected, not missing data.
Exposure workflow#
Acquire raw sector datasets at native resolution.
Harmonize and resample to the 0.25 degree analysis grid (sum for extensive quantities like population and built-up area, mean for fractions).
Preserve absolute layers and generate normalized (0-1) layers.
Feed exposure layers into risk composition with hazard and vulnerability.
Representative figure#
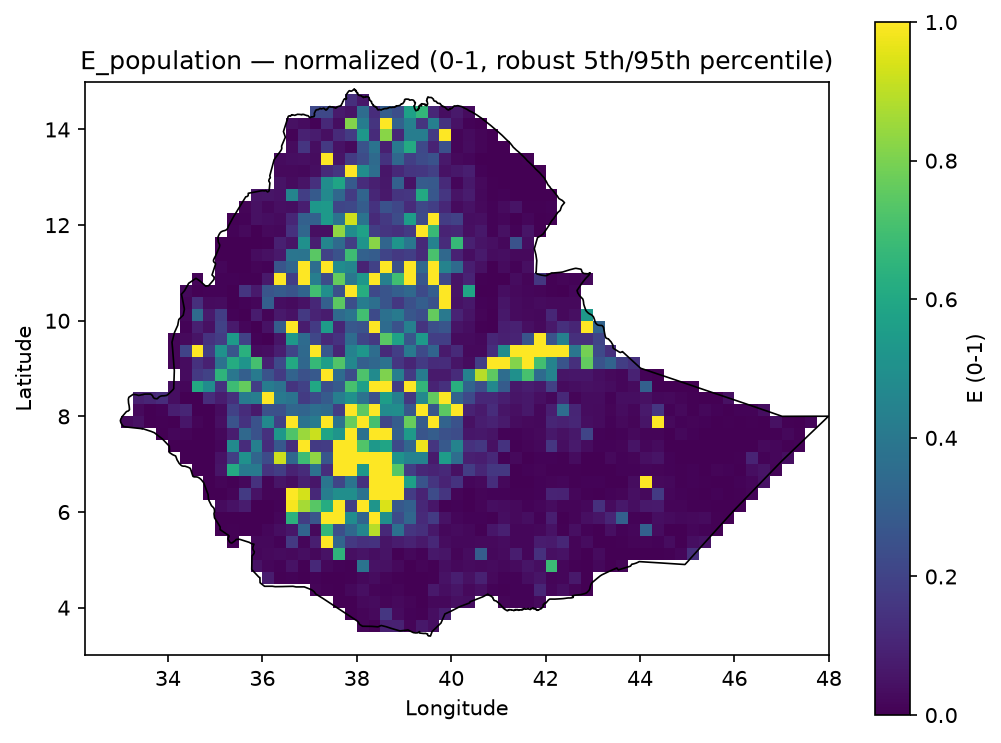 Population exposure layer, normalized 0-1, Ethiopia-clipped.
Inspect the full layers#
Two notebooks carry the complete, machine-readable detail behind this page. Both are also listed in the left sidebar under this Exposure page.
Exposure GeoTIFF inspection notebook
inspect_exposure_geotiffs.html – absolute and normalized exposure rasters on the analysis grid: metadata, units, source and processing notes, summary statistics, and Ethiopia-clipped map previews.
Raw source inspection notebook
inspect_exposure_vulnerability_raw_sources.html
– native-resolution source layers from data/exposure_vulnerability_raw,
source-to-config mapping, and raw format/extent checks prior to resampling.