Hazards#
Hazard is the first term in the pipeline’s IPCC-aligned framework, \(R = H \times E \times V\): it describes the climate process itself, before any question of who or what it affects.
Definition
A hazard is a “process, phenomenon or human activity that may cause loss of life, injury or other health impacts, property damage, social and economic disruption or environmental degradation” (UNDRR, 2019). This pipeline covers two hydroclimatic hazard types: seasonal drought and seasonal excess wetness.
In this pipeline#
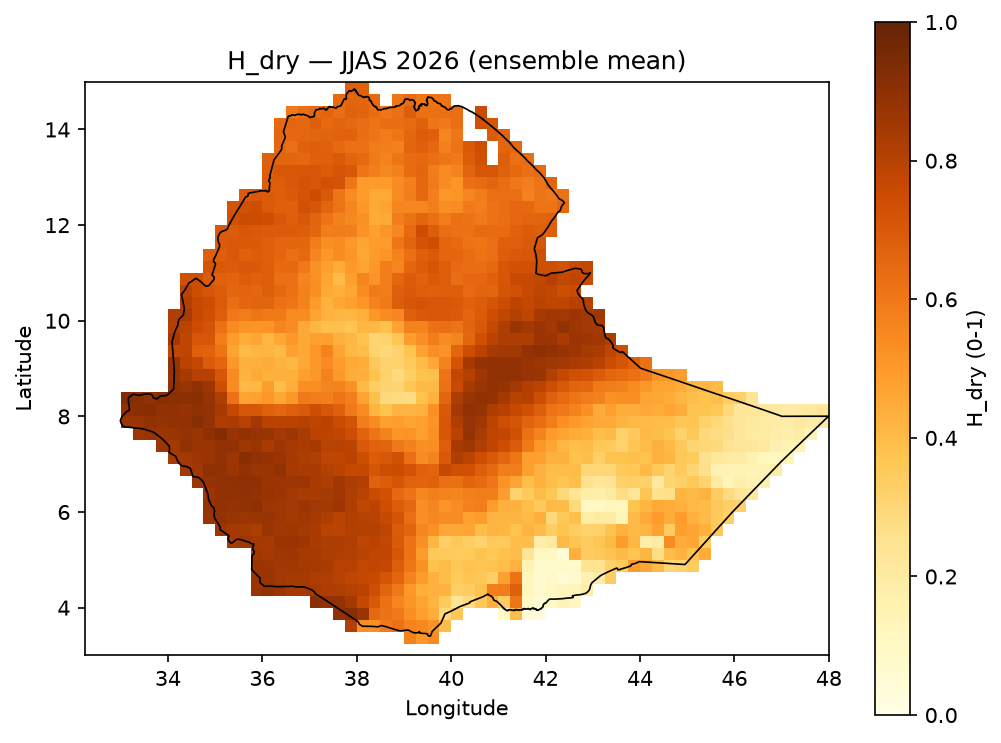
Drought hazard:
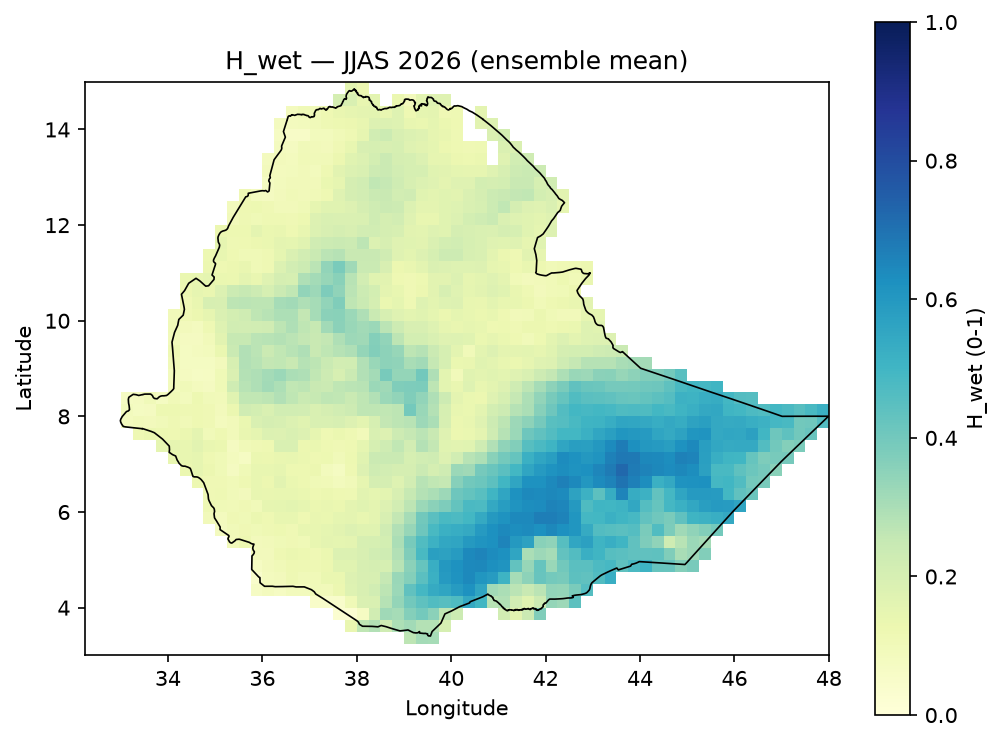
H_dryExcess-wetness hazard:
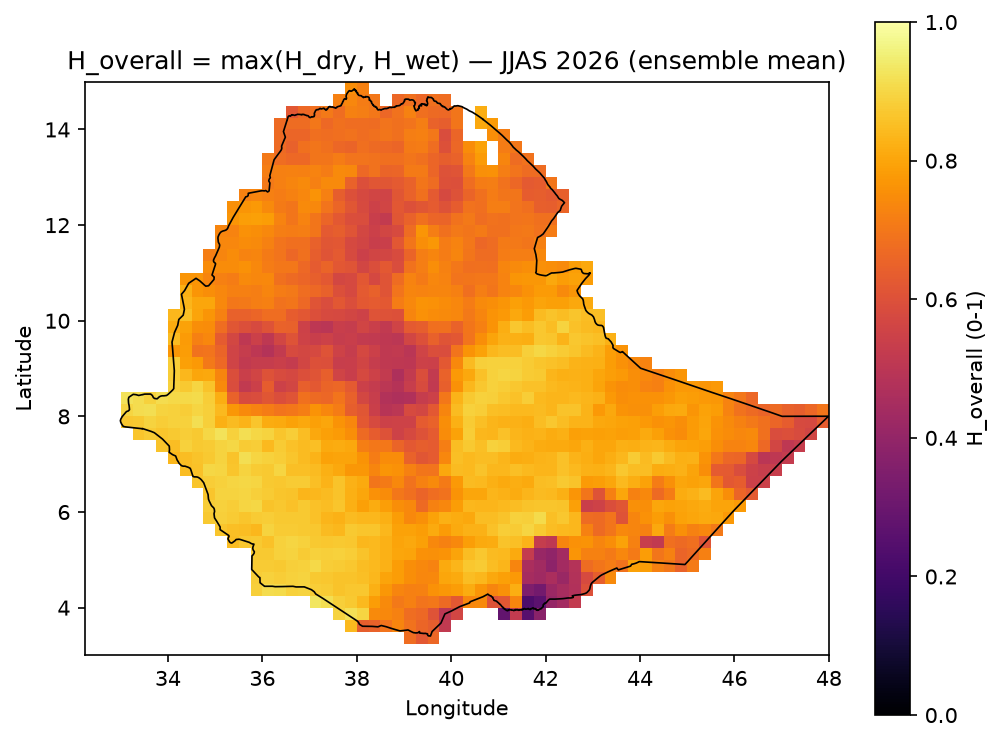
H_wetCombined hazard:
H_overall = max(H_dry, H_wet)High
H_drymeans a stronger drought signal from SPI, rainfall percentile, CDD, and CWD.High
H_wetmeans a stronger wetness signal from SPI, rainfall percentile, CWD, Rx1day, and Rx5day.H_overallhighlights where at least one hazard type is elevated.
Each is a per-ensemble-member field; H_overall is combined per member
(max) before averaging, not averaged first and then maxed – see
methodology.md for why the order matters.
Formula#
Weights below are the live values in config/weights.yaml, not illustrative
numbers. Every sub-score is normalized 0-1 first (see “Standardization” below),
then combined by the weighted sum.
Rx1day/Rx5day are wetness-only: a low value in either is not meaningful
evidence of dryness, so they never enter H_dry. CDD is dropped from H_wet
for the mirrored reason – see methodology.md for the full
reasoning behind both design calls.
Standardization (turning a raw indicator into a 0-1 score)#
Percentile-based, using each grid cell’s own historical distribution for that calendar period (never a map-wide min-max):
where \(P\) is the rainfall percentile (0-100) at that cell for that calendar
period. CDD, CWD, Rx1day, Rx5day use the same clipped-percentile form
against their own historical percentile rank. Full formulas for every
sub-score, see the “Standardization formulas” section in methodology.md.
Data used#
H_dry/H_wet are computed per ensemble member from six indicators (rainfall
percentile, SPI, CDD, CWD, Rx1day, Rx5day), produced upstream by the sibling
indicator-calculation project and consumed as trusted input – see the
“Hazard / probability inputs” table in data_provenance.md
for the exact source files (corrected_1993_2025.nc, corrected_2026.nc,
CHIRPS, and the sibling repo’s per-period GeoTIFF/NetCDF exports).
Result#
See the JJAS maps below, or the full per-period set (June-September) in results_gallery.md.
JJAS examples#
H_dry |
H_wet |
|---|---|
|
|