Not an official EMI or ICPAC forecast · cycles before 2027 are research reconstructions
Seasonal rainfall outlook
Not an official forecast · see the cycle's publication status
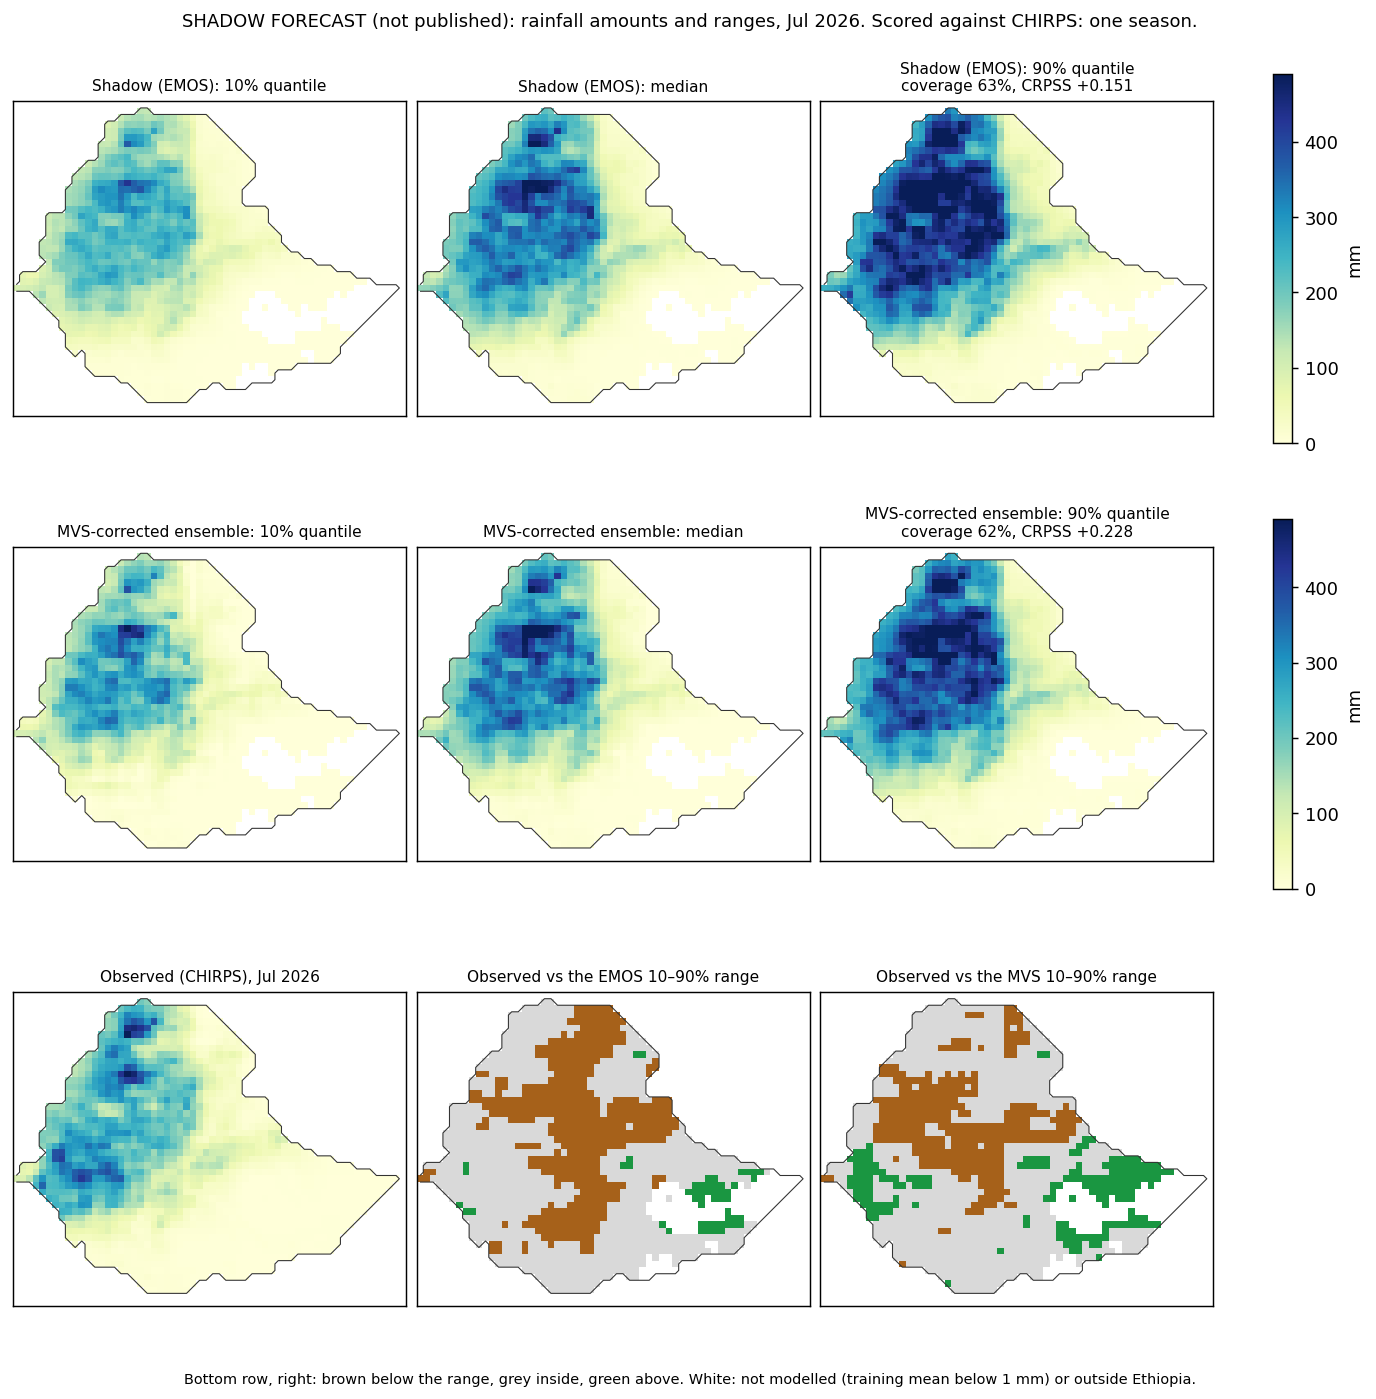
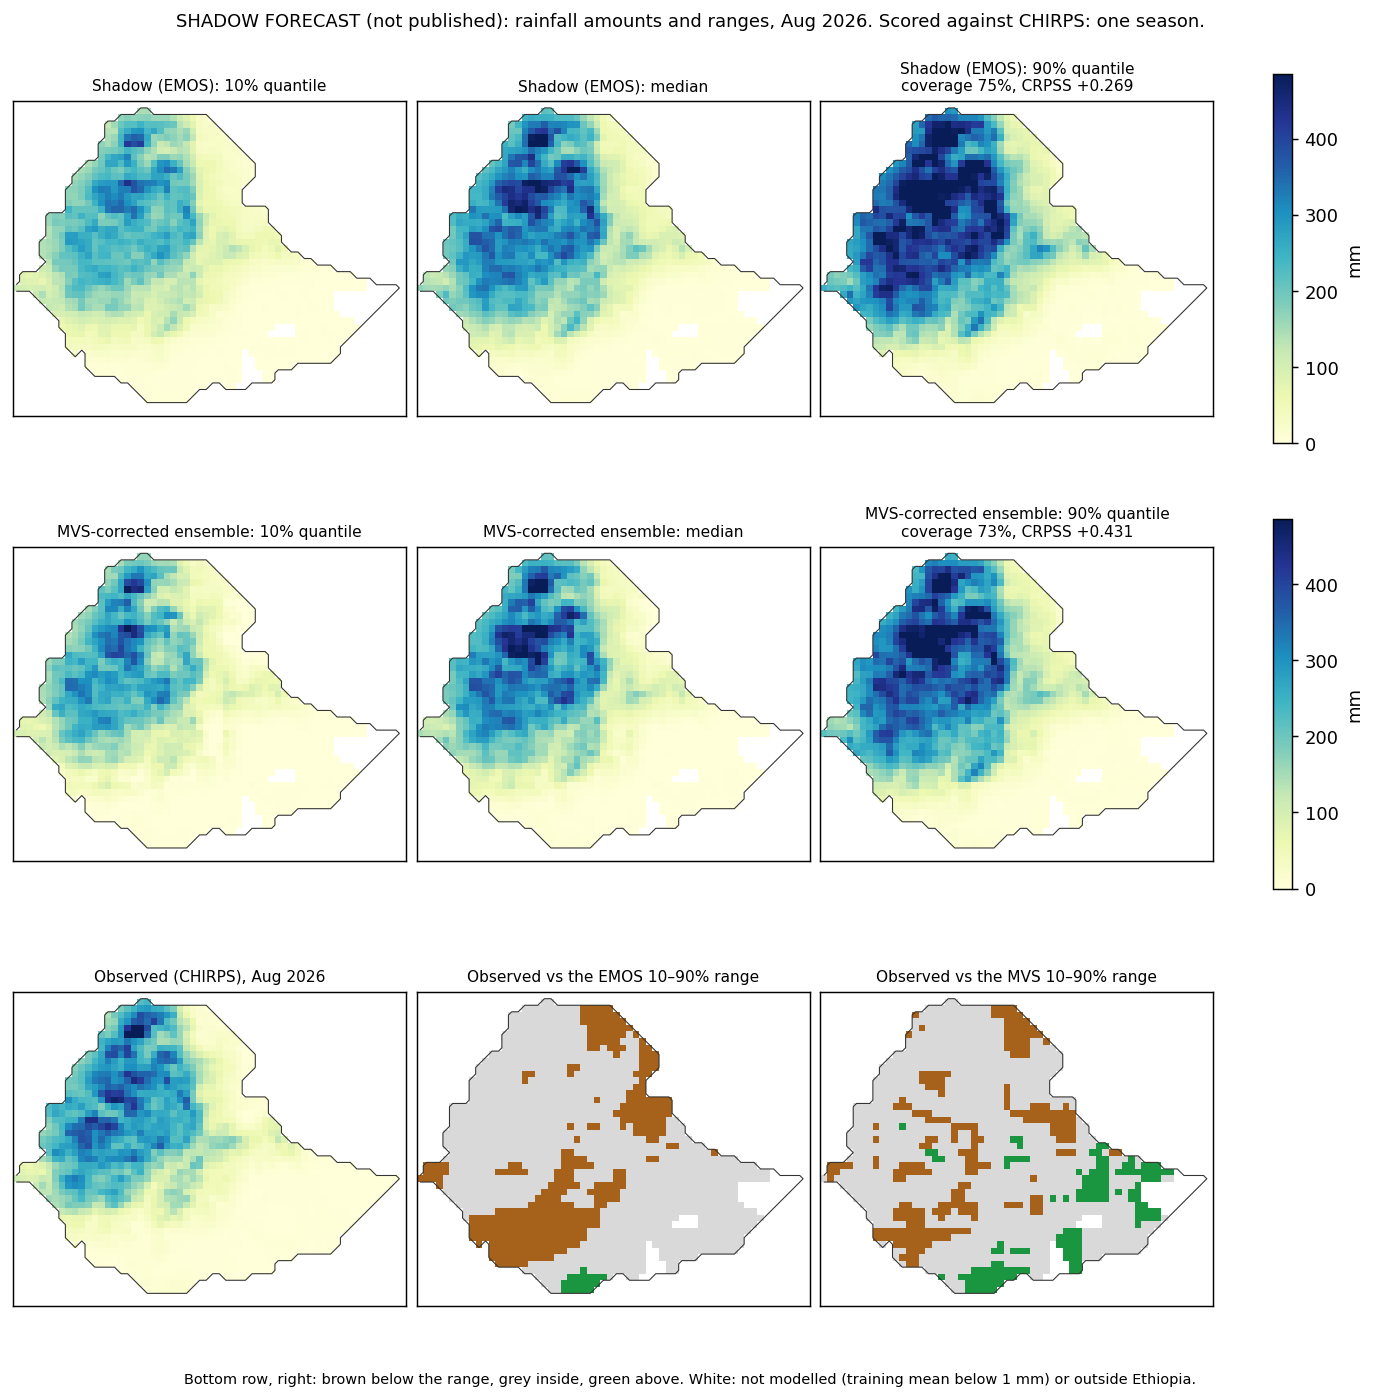
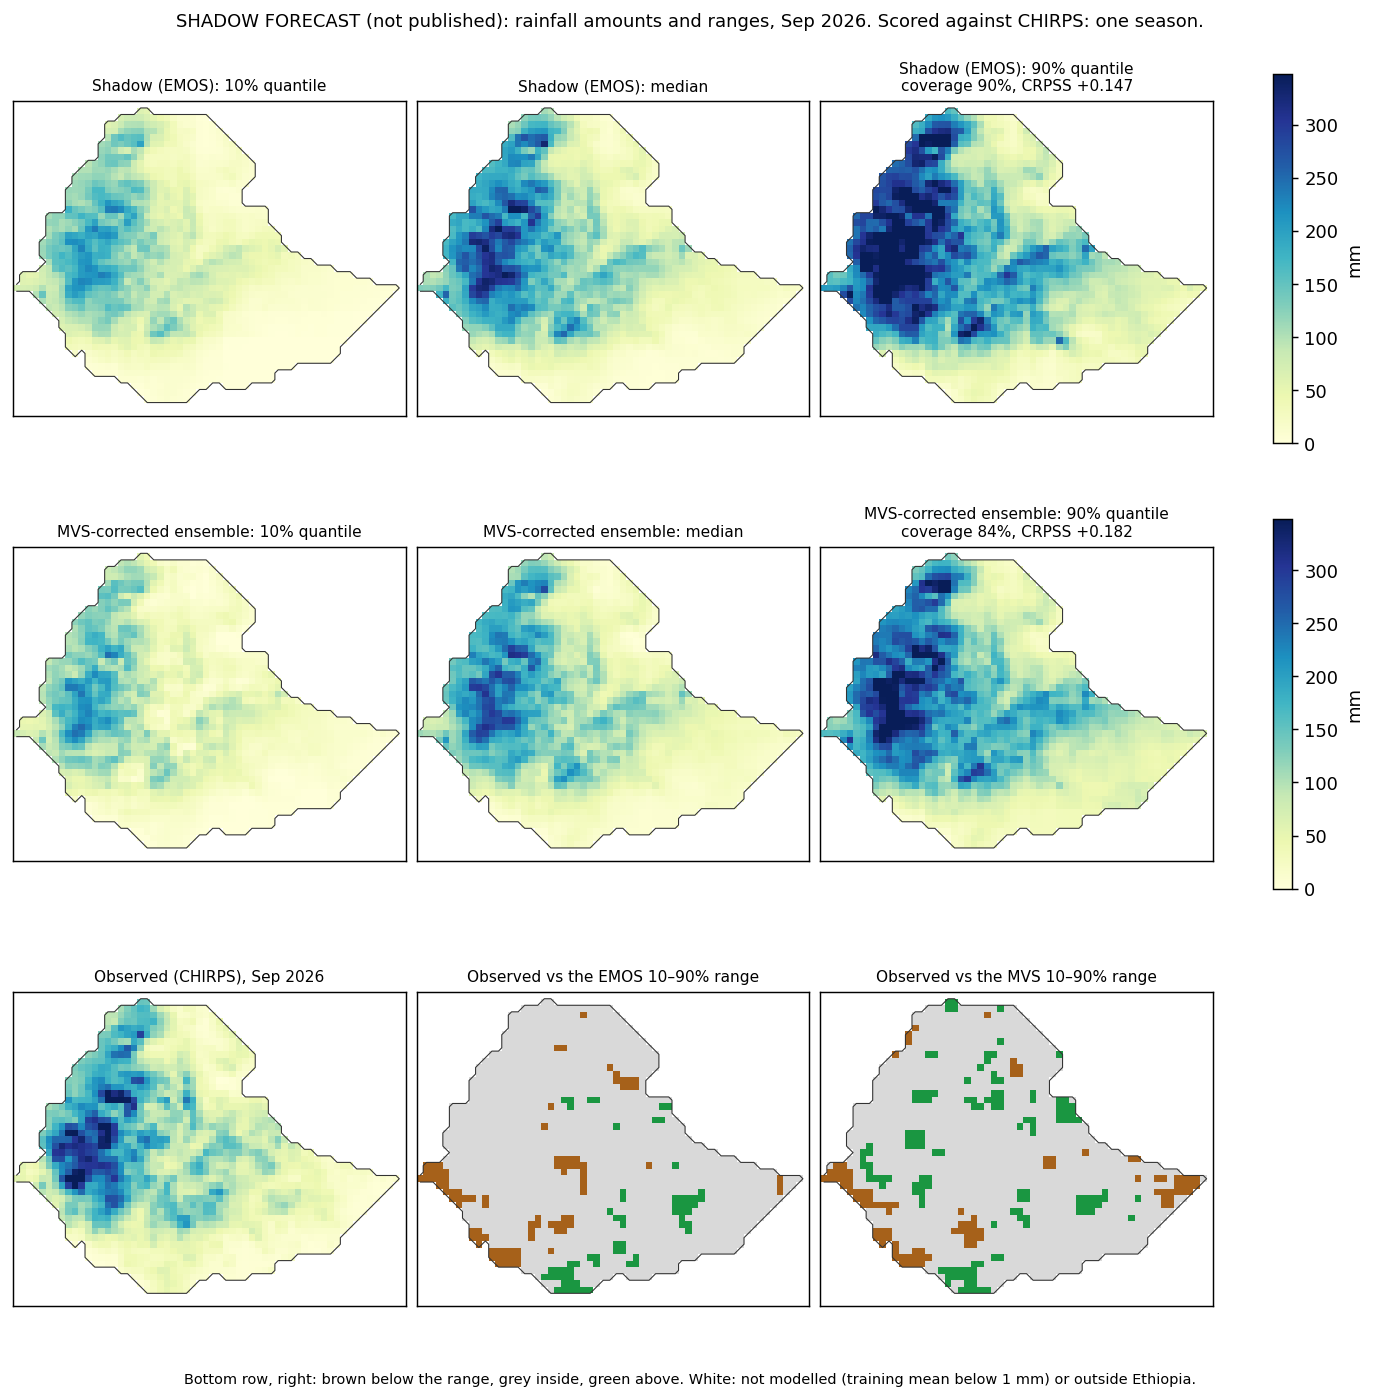
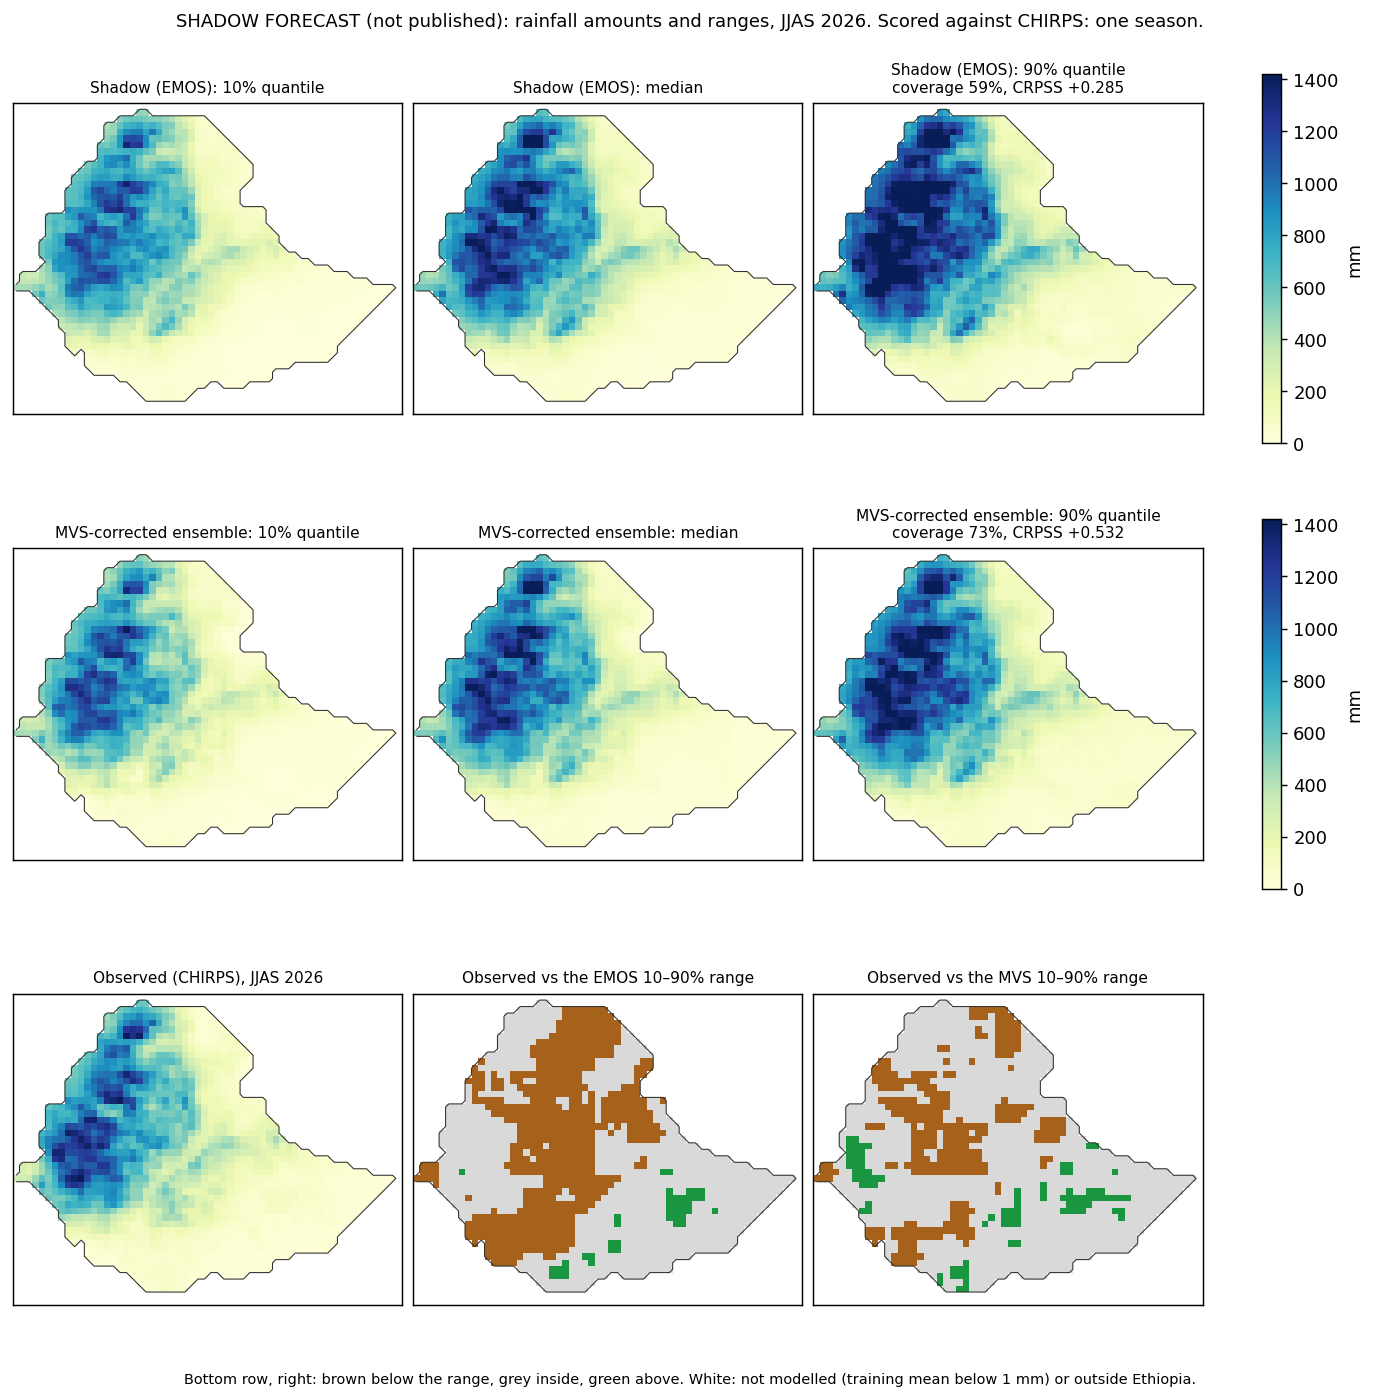
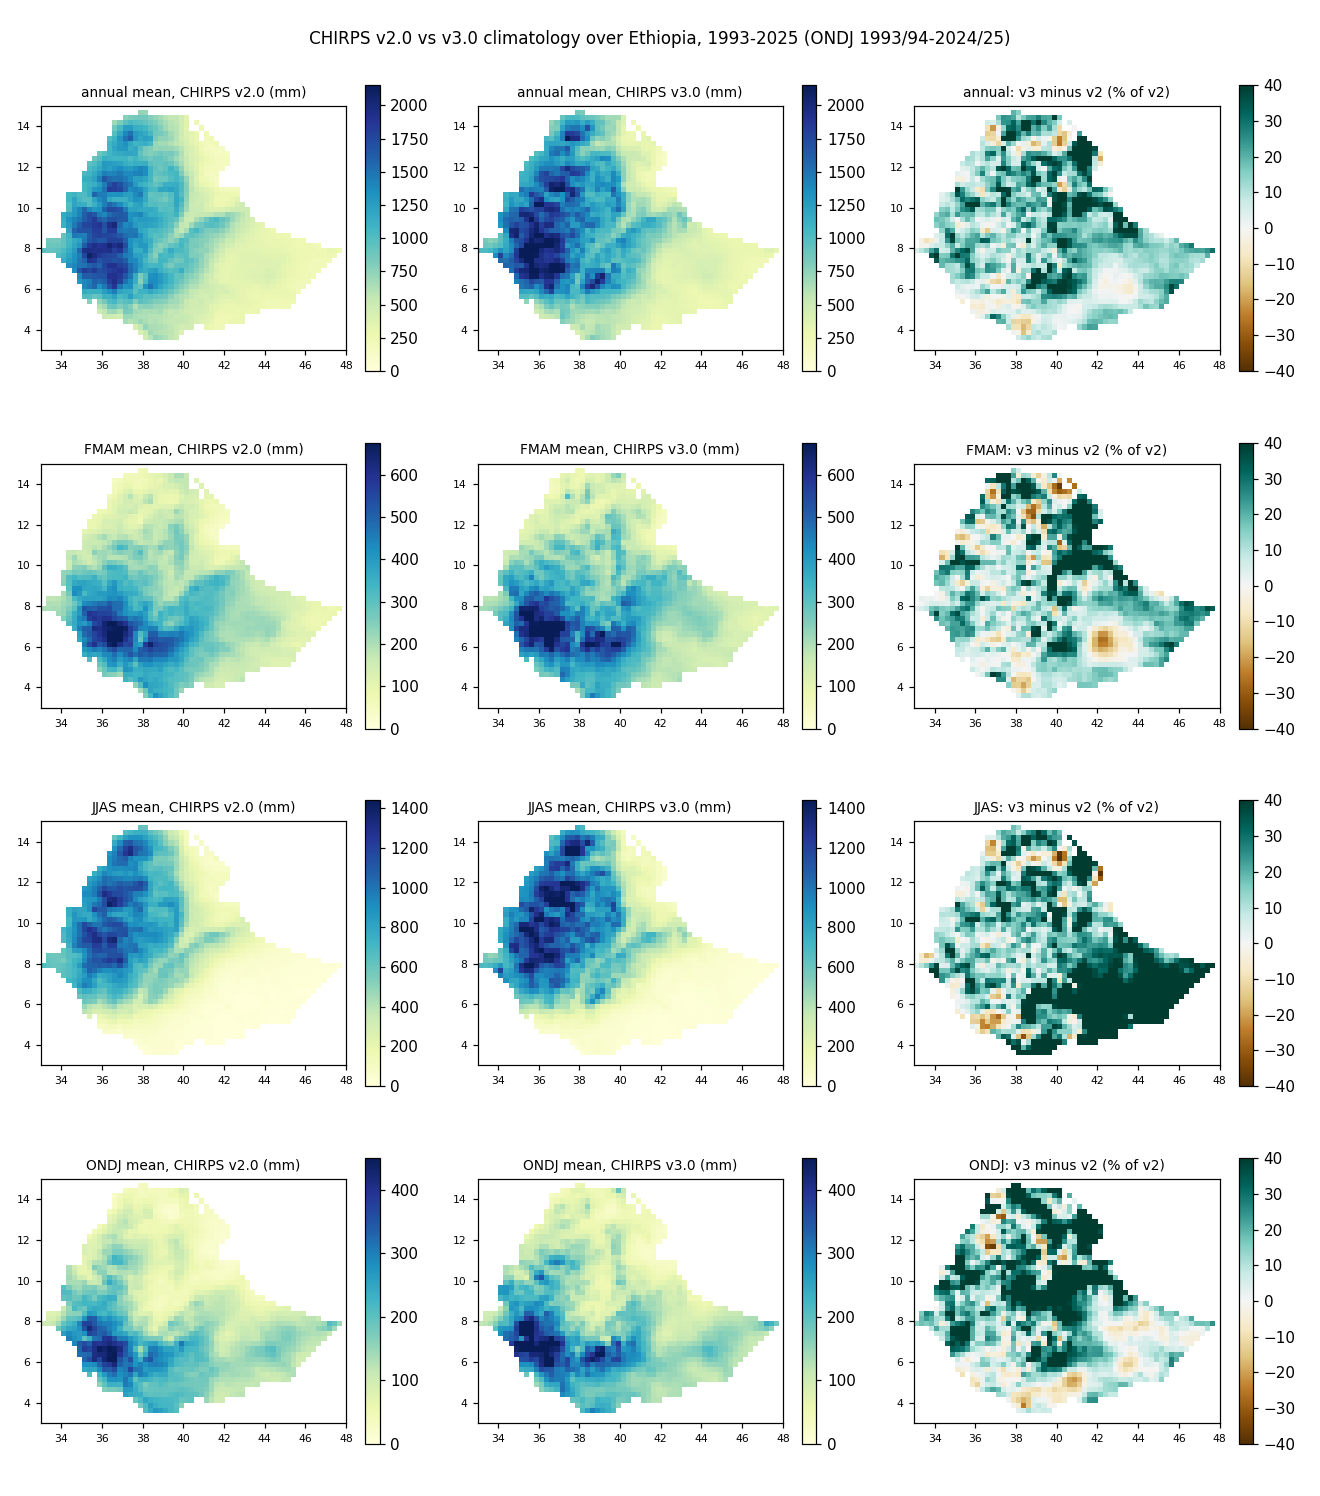
Observations: CHIRPS v3.0 since 11 October 2026. Every cycle is calibrated and verified with CHIRPS v3.0. The 2026 forecasts shown here were recalibrated with v3.0 after their outcomes were known, so they are retrospective reconstructions, not forecasts issued in advance. The versions calibrated with CHIRPS v2.0 are in the release archive (release 2026-10-10.2); the v2.0 vs v3.0 comparison is in the Methods section.
Average local probability
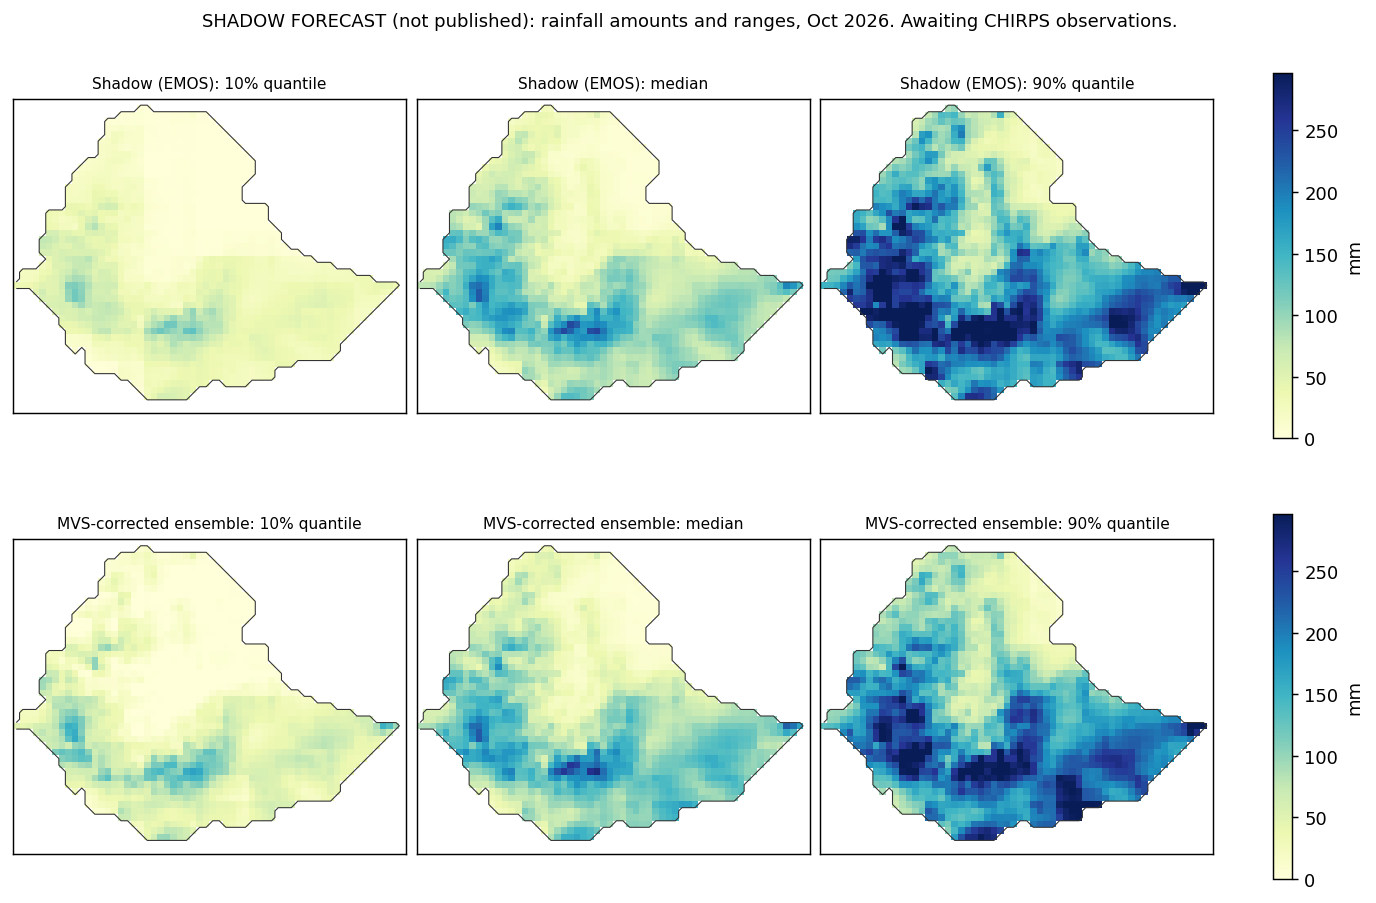
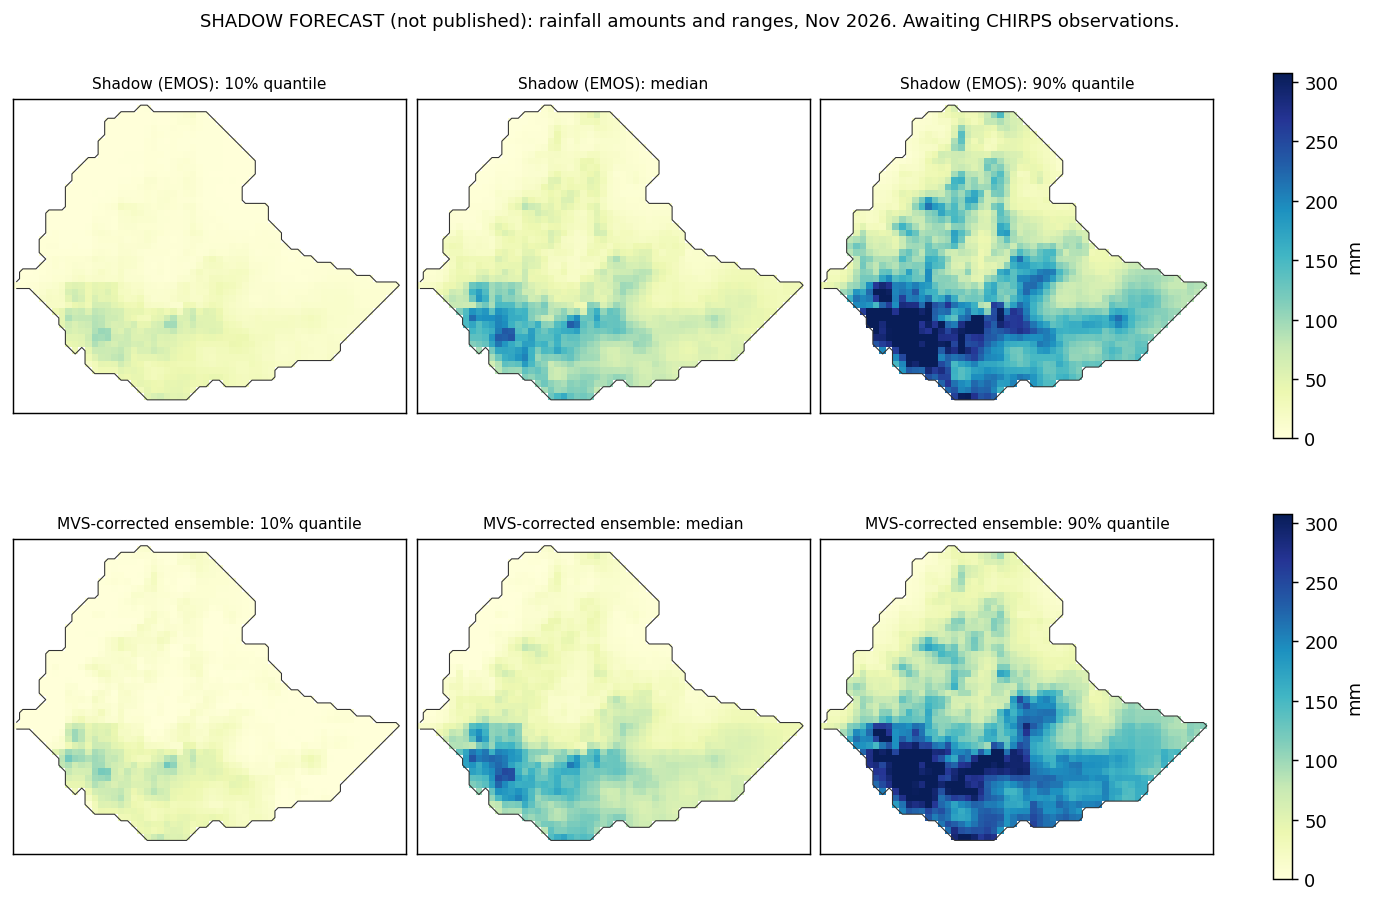
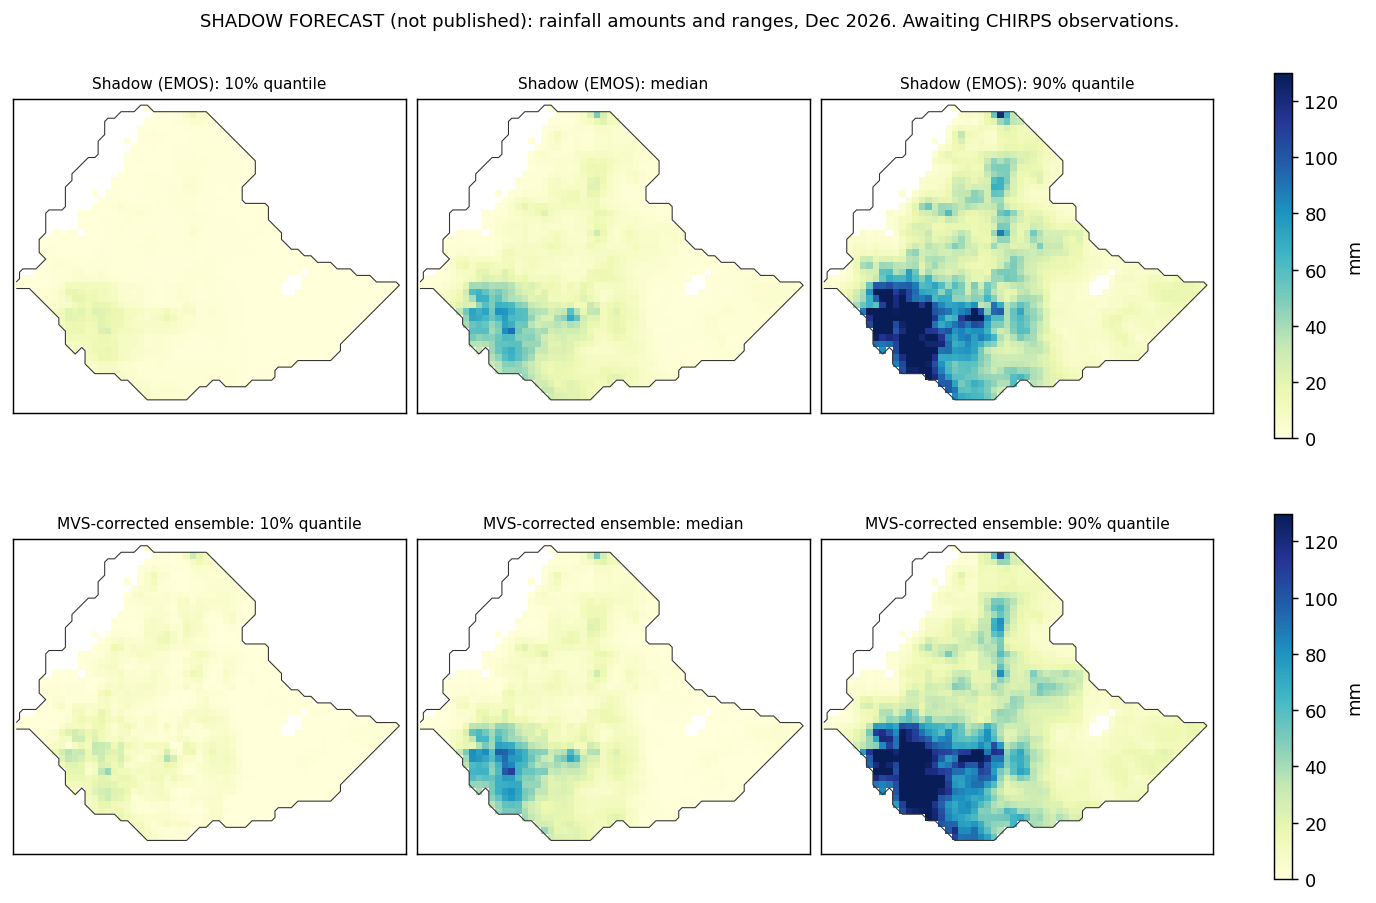
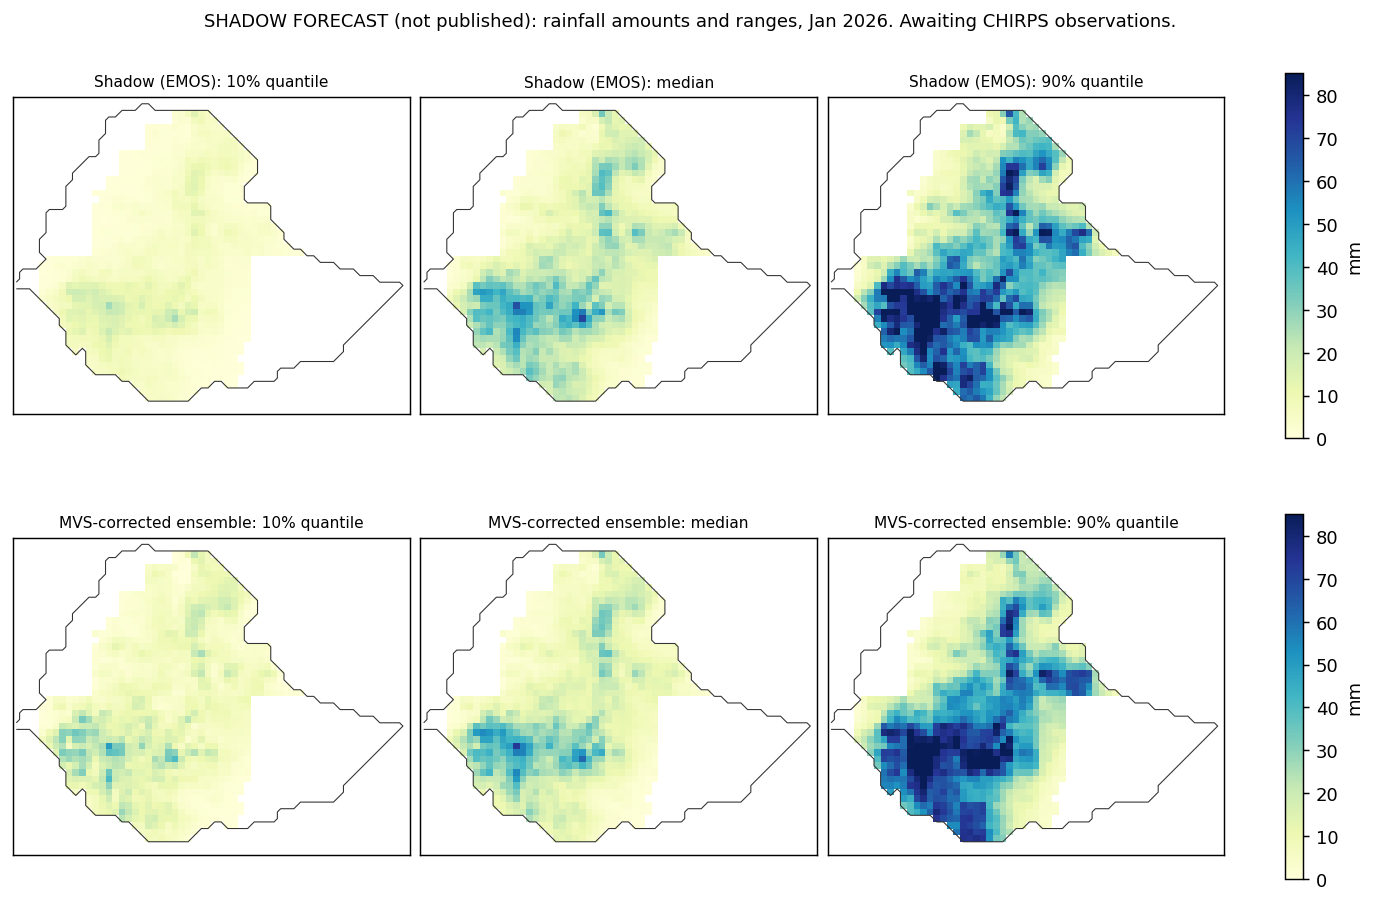
Rainfall amount
Forecast signal
Historical skill
Signal strength describes how far this forecast's probabilities depart from climatology. Historical skill describes how forecasts made the same way scored in past years. A strong signal is not a confidence rating.
Light grey: outside the selected area. Dark grey: inside the area but without values, for example cells where reference-period rainfall is too small for tercile categories, or (percent maps) below 10 mm. White on tercile maps: no category reaches 40%, or two categories tie. Sea cells have no CHIRPS data.
Smoothing and resolution. Maps are drawn on a 12× finer display grid with light Gaussian smoothing (σ = 0.6 grid cells); all numbers on this page use the original 0.25° grid. The model's own resolution is about 1°: each model cell covers 4×4 grid cells, so detail within a 1° box comes from local CHIRPS rainfall statistics used in the amount correction, not from the model.
Verification
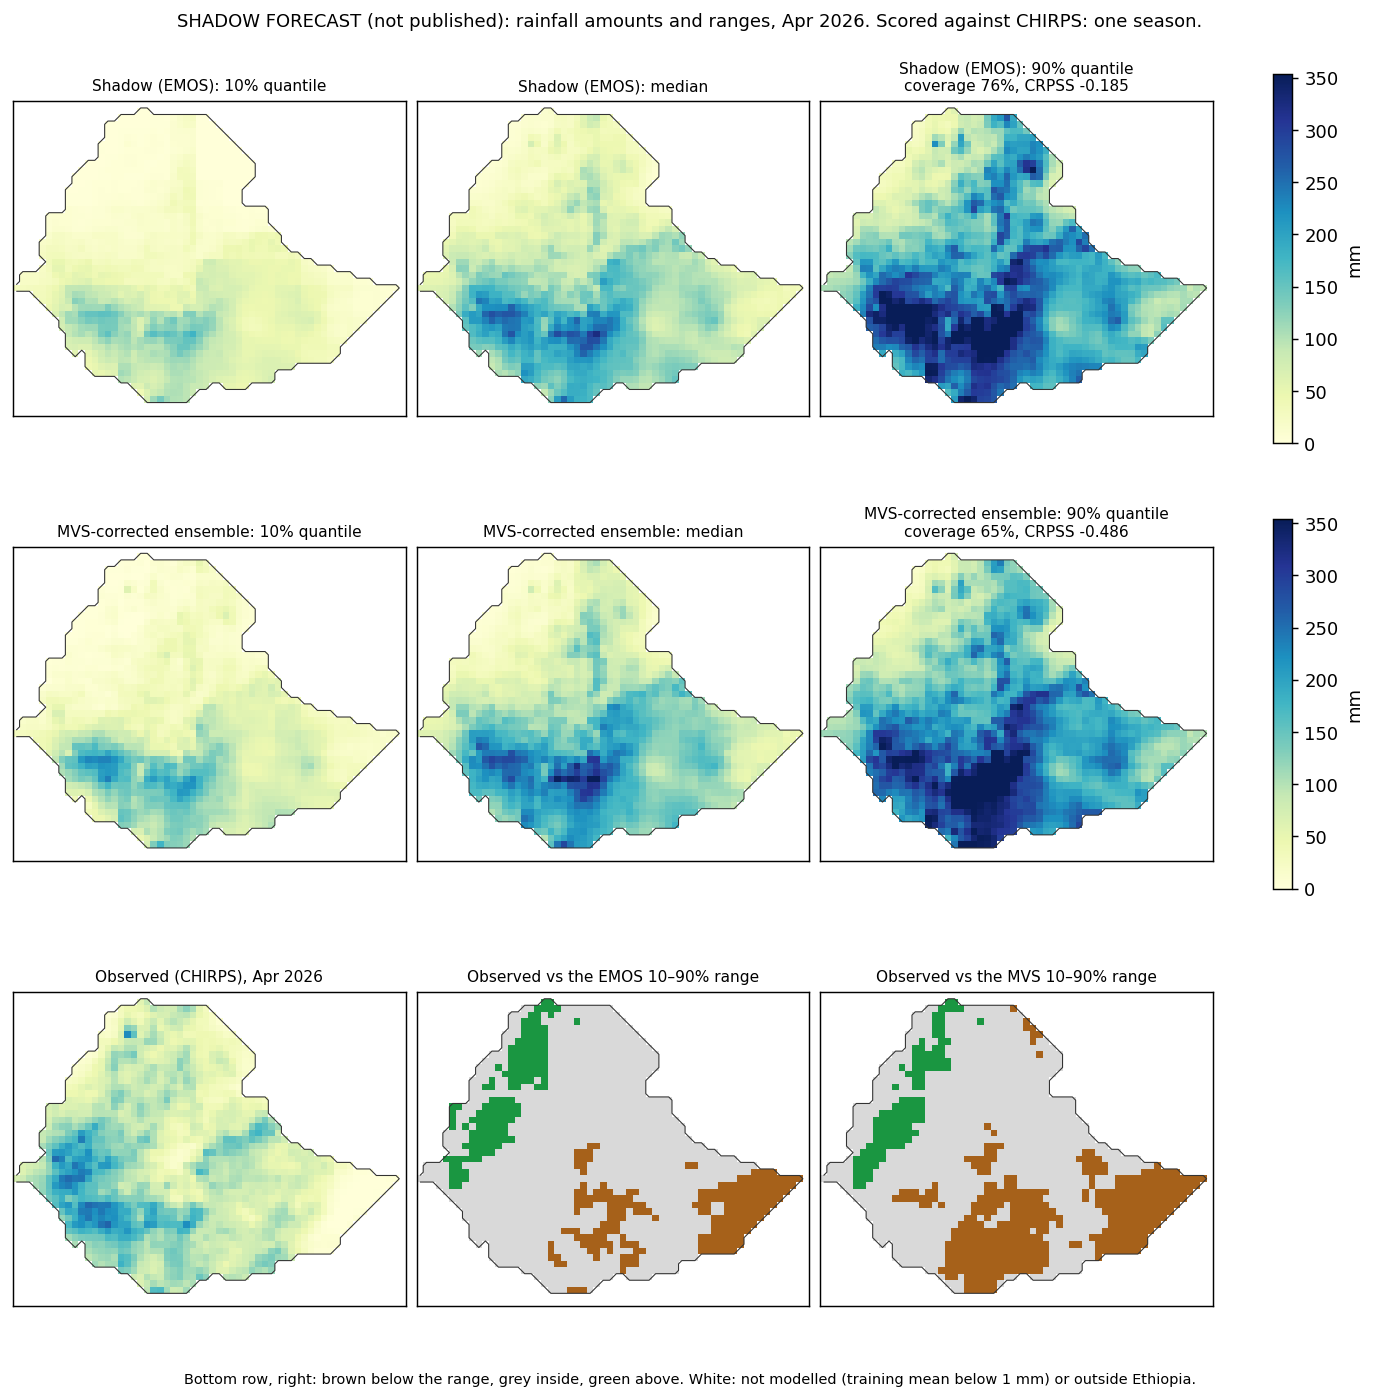
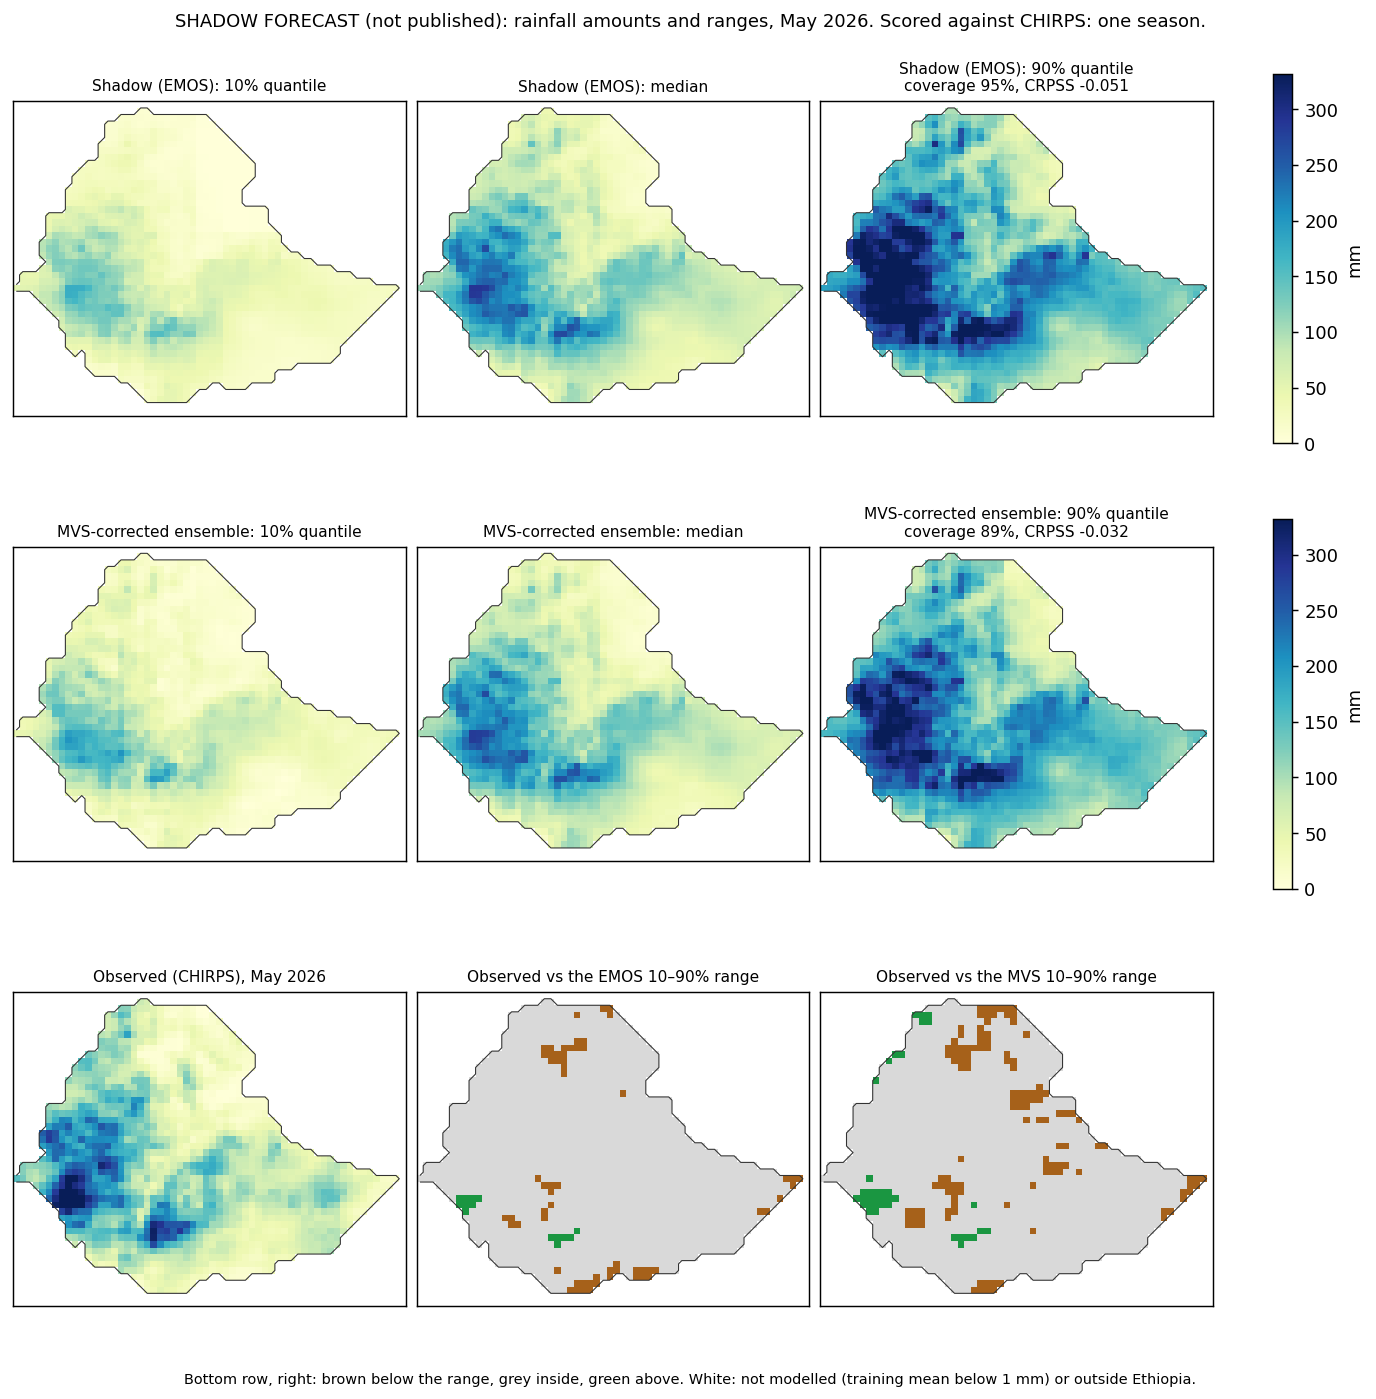
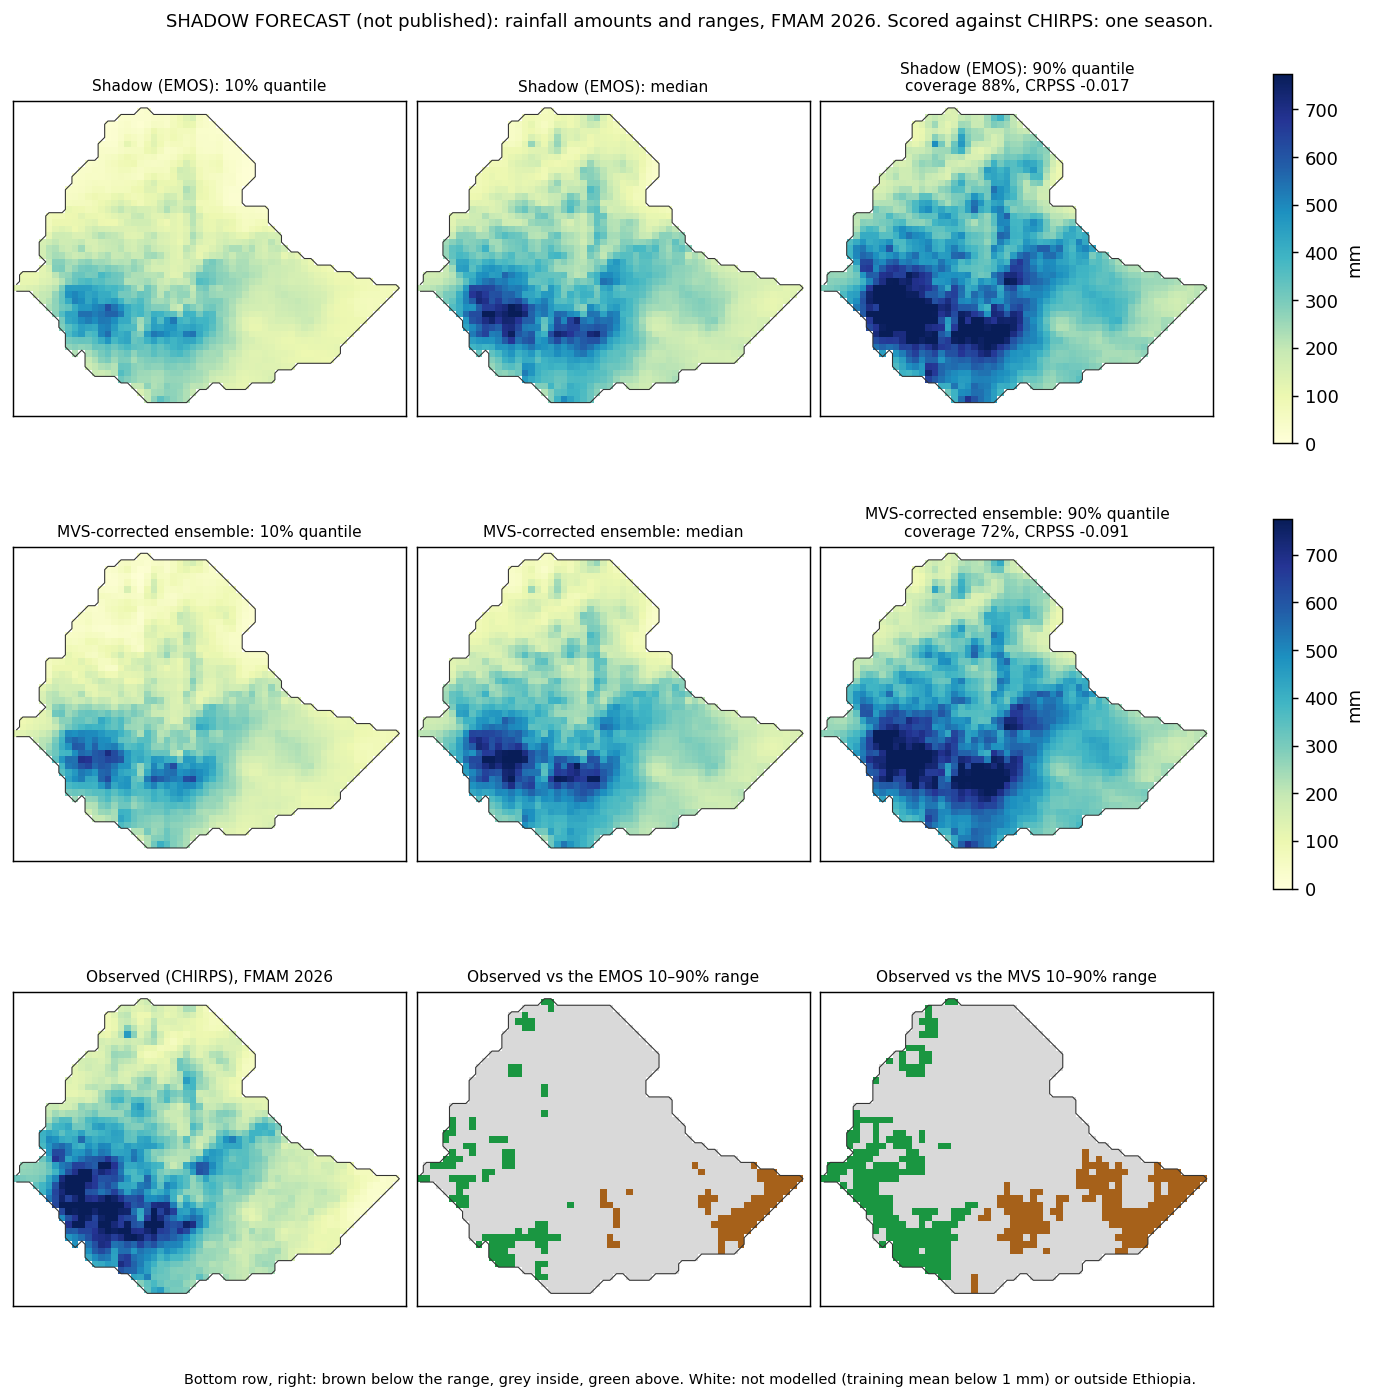
Frozen forecasts compared with official CHIRPS v3.0 observations once a target period is complete. Each result is one season or month, so it shows what happened this time, not long-term reliability.
Historical performance
How forecasts made with the same method scored in past years against climatology (the observed frequency of each tercile in the training years, about one-third each). The main number is the cross-validated 1993–2016 score: each year is forecast with parameters fitted without that year. Later years are exploratory: they were seen while the method was chosen.
Historical verification explorer
The evidence behind the scores above, for the selected cycle, target and area. Choose the evaluation period; all diagnostics use the blended probabilities against climatology.
Historical performance by rainfall region
Bias correction
How the model’s rainfall amounts are corrected toward CHIRPS, and how alternative bias-correction methods compare with the
operational one: the data, every method’s definition, the steps, the screening and confirmation results, and what they mean.
Each cycle has its own benchmark (initialization, season and months).
January initialization · FMAM and its months
Research benchmark. The published forecasts still use Mean-Variance Scaling (operational). This section
compares 12 other rainfall-amount bias-correction methods with it, member by member, for every grid cell and target:
a screening of the amount correction alone, then a confirmation through the full probability pipeline that also
accounts for how a method is chosen.
Suggested method
The platform suggests a bias-correction method for every target and product from the historical evidence (the confirmation
against CHIRPS, counting every method tried) and the independent validation seasons scored since (the shadow and validation
runs), by a rule fixed before those seasons are scored. A suggestion is advice for a decision: the published forecast
always uses Mean-Variance Scaling until a change is decided. 0 of 10 target–product combinations have a
candidate.
The rule
Candidate: A method is a candidate only if the confirmation (CHIRPS, outer leave-one-year-out over the training years, full pipeline) finds it better than the operational method with Holm-adjusted p < 0.05 across every declared method and target, and not worse over the test years. Variants outside the declared family are not candidates.
Choice: Among candidates, the method the selection-aware procedure chooses from all training years (training-only information); if that method is not a candidate, the candidate with the best training-period score. Other candidates are listed as alternatives: a confirmation establishes improvement against the operational method, not a ranking among candidates.
Validation: Independent validation seasons are forecast years scored after the benchmark (bias_validation.py). A candidate is 'recommended' once at least minimum_seasons have been scored for it and the operational method, and its mean score over them is not worse; with fewer seasons it stays a 'candidate'; with enough seasons and a worse mean it is 'not supported by validation'. Minimum: 3 seasons.
Suggested methods (national aggregate)
Target
Product
Suggested method
Status
Evidence
Feb
Published tercile probabilities
Mean-Variance Scaling
Keep the operational method
No method is confirmed better than Mean-Variance Scaling for Feb on the historical evidence.
Feb
Rainfall amounts
Mean-Variance Scaling
Keep the operational method
No method is confirmed better than Mean-Variance Scaling for Feb on the historical evidence.
Mar
Published tercile probabilities
Mean-Variance Scaling
Keep the operational method
No method is confirmed better than Mean-Variance Scaling for Mar on the historical evidence.
Mar
Rainfall amounts
Mean-Variance Scaling
Keep the operational method
No method is confirmed better than Mean-Variance Scaling for Mar on the historical evidence.
Apr
Published tercile probabilities
Mean-Variance Scaling
Keep the operational method
No method is confirmed better than Mean-Variance Scaling for Apr on the historical evidence.
Apr
Rainfall amounts
Mean-Variance Scaling
Keep the operational method
No method is confirmed better than Mean-Variance Scaling for Apr on the historical evidence.
May
Published tercile probabilities
Mean-Variance Scaling
Keep the operational method
No method is confirmed better than Mean-Variance Scaling for May on the historical evidence.
May
Rainfall amounts
Mean-Variance Scaling
Keep the operational method
No method is confirmed better than Mean-Variance Scaling for May on the historical evidence.
FMAM
Published tercile probabilities
Mean-Variance Scaling
Keep the operational method
No method is confirmed better than Mean-Variance Scaling for FMAM on the historical evidence.
FMAM
Rainfall amounts
Mean-Variance Scaling
Keep the operational method
No method is confirmed better than Mean-Variance Scaling for FMAM on the historical evidence.
Summary — national aggregate (All Ethiopia)
All tested corrections improve national FMAM rainfall-amount CRPSS over raw ECMWF in 1993–2016 (raw -0.696; corrected +0.009 to +0.029). Performance varies for monthly tercile probabilities: 0 method–month combinations score below the raw model on RPSS.
Accounting for the whole search. With Holm adjustment across all 60 method–target comparisons, the amount (CRPS) screening passes are none, and the tercile (RPS) passes are Square-root-space Mean-Variance Scaling (Feb, Mar), Power Transformation (Feb, Mar), Empirical Quantile Mapping (Feb) and Gamma Quantile Mapping (Feb, Mar). Within-method passes that do not survive this check: Empirical Quantile Mapping Mar, Gamma Quantile Mapping Mar, Square-root-space Mean-Variance Scaling Feb, Square-root-space Mean-Variance Scaling Mar, Variance Scaling (unbounded) Feb and Variance Scaling (unbounded) Mar.
What the evidence supports
Published tercile probabilities: no tested method demonstrates a statistically significant improvement over Mean-Variance Scaling under this validation protocol (several have slightly higher point estimates); the selection-aware procedure is confirmed for none.
Rainfall amounts: no tested method demonstrates a statistically significant improvement over Mean-Variance Scaling under this validation protocol (several have slightly higher point estimates); the selection-aware procedure is confirmed for Feb.
The operational method stays Mean-Variance Scaling until a change is decided by initialization, target and product, and recorded in the docs, on this evidence; confirmed improvements limited to some months may justify a per-target choice.
If amounts and probabilities come to use different correction paths, the product metadata must record both methods so that every output can be traced.
The same screening and confirmation run for the other cycles with one configuration file each (config/bias_correction/).
Data
Data used by the benchmark
Item
Details
Forecasts
ECMWF SEAS5 (system 51), initialized on 1 January; 25 members 1993–2016, 51 from 2017; remapped from 1° to the 0.25° CHIRPS grid by conservative remapping (each 1° cell fills a 4 × 4 block). Johnson et al. 2019
Observations
CHIRPS v3.0 monthly totals, averaged from 0.05° to 0.25°
Targets
Feb, Mar, Apr, May and the FMAM season; each corrected separately
Values
One total per member, grid cell and year (mm), the same inputs as the operational tool (data/processed/init01_<target>/)
Score coverage (amounts / probabilities, share of the national area)
Feb 100% / 85%; Mar 100% / 99%; Apr 100% / 100%; May 100% / 100%; FMAM 100% / 100%. Tercile scores need two distinct tercile boundaries defining three categories, a CHIRPS standard deviation of at least 1 mm and a lower boundary above 0 mm, so dry months have fewer probability cells.
Dry totals
≤ 1 mm in a month or season (not a dry day); exactly 0 mm is reported separately
Weighting
Every member is used; each training year has total weight 1/Y (each member of year y weighs 1/(Y·My)), so years with 25 and 51 members count equally. Each observed year weighs 1/Y.
Run
config/bias_correction/jan_fmam.json; 2026-10-12 10:26 UTC; commit 9f397927f5; scoring version 3
Methods
Each method is fitted per grid cell and target from the training years only and applied to each member of the scored year.
Methods that keep a “change signal” (DC, DQM, QDM, SDM, CDF-t) were designed for climate change, where a model’s reference period is
compared with a future period; here the “future” is the forecast itself: the target year’s ensemble against the model climatology.
How overlapping names were resolved
Delta Change appeared twice in the requested list; it is one method.
Mean–Variance Scaling is the operational method, with the project’s 0.5–2 ratio limits. Variance Scaling uses the same algebra and the same fallback (ratio 1 where the model spread is below 1 mm) without the limits, so the comparison isolates the limits.
Delta Change returns the CHIRPS training years rescaled by the forecast signal (ensemble mean / model climatology): historical scenarios, not corrected members. Applied to each member instead it would be identical to Linear Scaling.
Square-root-space MVS (a mean–variance scaling of √x) is distinct from Power Transformation (a·xb with b fitted to the coefficient of variation).
The raw model is scored as a baseline, not screened.
Dry totals and tied values
A total at or below 1 mm in the month or season is “dry” (not a dry day).
For the quantile-mapping methods (EQM, Gamma QM, DQM, QDM) the dry shares of the model climatology and of CHIRPS are estimated with
the equal-year weights; a forecast’s dry members are spread evenly over the model’s dry probability by rank (deterministic stratified
tie-breaking, with ties resolved by member index), and a probability within the CHIRPS dry share maps to 0 mm, also after any
extrapolation of the upper tail. Without this, tied zeros share one
probability and the corrected dry share does not follow CHIRPS. Tests cover repeated zeros, all-dry samples and very few wet values;
the dry-month table under Results compares the shares. CDF-t, LOCI and the scaling methods have no occurrence adjustment; SDM uses its
own rain-member rule (Switanek et al. 2017).
12 methods, the operational reference and the raw baseline
Method
Family
Definition (per cell and target)
Member-wise
Uses the forecast ensemble’s own distribution
Parameters
References
Raw ECMWF (no correction) raw
baseline
x' = x (the uncorrected model; baseline, not a candidate)
Model threshold with the observed frequency of totals above 1 mm, then intensity scaling above it (designed for daily rainfall; here monthly or seasonal totals)
x' = G_obs^-1(G_model(x)), G = dry mass (<= 1 mm) + gamma by weighted maximum likelihood, with the dry policy; linear scaling where fewer than 3 wet values
a * EQM(x / a), a = forecast ensemble mean / model mean (0.2-5): removes and reapplies the bounded ratio; exact preservation of the final mean anomaly is not guaranteed
x' = Q_obs(tau) * x / Q_model(tau), tau = rank of x in the forecast ensemble; change capped at 5 and replaced by Q_obs(tau) where Q_model(tau) <= 1 mm (both reported), so preservation is partial there
Switanek et al. (2017) precipitation steps 1-7: gamma fits, recurrence intervals interpolated to the forecast's length, scaled CDF, rain-member count; model climatology with equal-year weights
F_obs,f = F_obs(F_model^-1(F_forecast)); x' = F_obs,f^-1(F_forecast(x)); implementation choices: model and forecast first scaled to the CHIRPS mean, values stay within the scaled forecast range
Per-member totals of every target and year, and CHIRPS for 1993–2025.
bias_benchmark.py · run_calibration.load_inputs
2
Fit
For each cell and target, the method’s statistics from the training years only, with equal-year weights.
bias_methods.METHODS[key].fit
3
Apply
Correct every member of the scored year individually (member-wise).
bias_methods.METHODS[key].apply
4
Score
Ensemble CRPS (and fair CRPS), ensemble-mean errors, spread–error, rank histograms, tercile RPS, dry shares and distribution ratios, per cell; then area-weighted per year.
bias_benchmark.score_cells · summarise
5
Screen
Each method against Mean-Variance Scaling per target: one-sided sign-flip test on whole years, Holm within the method and across all methods, no harm in 2017–2025.
bias_benchmark.make_gates
6
Confirm
Every method through the full probability pipeline (blend weight fitted inside the folds), and selection-aware procedures that choose the method each year from training-only scores.
bias_confirmation.py
Evaluation designs (no amount method has a parameter tuned on scores)
Design
Fits
Scored
Role
Screening: training
leave-one-year-out within 1993–2016
each 1993–2016 year
clean evidence for the screening
Screening: test
1993–2016
2017–2025
exploratory (these years were seen before)
Screening: full
leave-one-year-out within 1993–2025
each year
per-cell maps and distribution checks (descriptive)
Confirmation
outer leave-one-year-out within 1993–2016; inside each fold the blend weight (inner leave-one-year-out) and, for SEL-P/SEL-A, the method choice
each 1993–2016 year
full pipeline; accounts for the method choice
Confirmation: test
1993–2016 (fits, blend weight and method choice)
2017–2025
exploratory
Forecast
1993–2025
2026 members
member-by-member comparison
Scores
Score
What it measures
Reference
CRPS / CRPSS
Error of the corrected ensemble’s empirical distribution, as delivered, in mm; skill against the CHIRPS training climatology (the training years as an ensemble). Primary amount score.
Fair CRPS / CRPSS
The same under the interpretation that the members are a sample of an underlying distribution; reported as a diagnostic and screened separately. The justification assumes exchangeable members, which DC’s rescaled years and methods tied to the forecast mean or ranks only approximate.
The published probability product: counts, smoothing and the climatology blend with its weight fitted inside the folds; category Brier skill for below and above normal; reliability tables
Dry shares and distribution ratios
Pooled out-of-fold corrected members (equal-year weights) against CHIRPS of the same years: shares at exactly 0 mm and at ≤ 1 mm; mean, standard deviation, 10th and 90th percentile ratios (area-weighted medians)
Screening results
Region for the result tables
Tables for: All Ethiopia. ✓ = screening pass within the method (Holm across its targets); ✓✓ = also passes with Holm across all methods and targets. A pass is screening evidence, not an adoption decision. Bold: the operational method. Skill is against the CHIRPS training climatology (0 = no better than climatology).
FMAM season at a glance — All Ethiopia
Method
Amount CRPSS
Tercile RPSS (no blend)
Diagnostics, leave-one-year-out 1993–2016
1993–2016
2017–2025
1993–2016
2017–2025
Mean bias (mm)
MAE (mm)
Correlation
Spread–error
Reliability index
Members ≤ 1 mm
Raw ECMWF (no correction)
-0.696
-0.803
-0.465
-0.760
-86.1
105.7
0.24
0.48
0.79
0.0%
Linear Scaling
+0.019
+0.020
+0.035
+0.004
+0.0
67.9
0.11
1.16
0.14
0.0%
Mean-Variance Scaling (operational)
+0.025
+0.016
+0.034
+0.009
-0.0
67.8
0.07
0.98
0.05
0.0%
Variance Scaling (unbounded)
+0.025
+0.015
+0.035
+0.008
-0.0
67.8
0.07
0.99
0.04
0.0%
Square-root-space Mean-Variance Scaling
+0.025
+0.018
+0.035
+0.013
-0.0
67.8
0.07
0.98
0.04
0.0%
Power Transformation
+0.024
+0.017
+0.034
+0.014
-0.0
67.8
0.07
0.99
0.05
0.0%
Delta Change
+0.029
+0.010
+0.031
-0.010
+0.0
67.9
0.11
1.04
0.04
0.0%
Local Intensity Scaling
+0.020
+0.020
+0.036
+0.004
+0.0
67.8
0.11
1.16
0.13
0.0%
Empirical Quantile Mapping
+0.011
+0.005
+0.023
-0.004
-0.0
68.0
0.06
0.98
0.05
0.0%
Gamma Quantile Mapping
+0.025
+0.019
+0.035
+0.015
+0.0
67.8
0.07
0.97
0.05
0.0%
Detrended Quantile Mapping
+0.013
+0.004
+0.024
-0.009
+0.2
68.1
0.10
0.99
0.05
0.0%
Quantile Delta Mapping
+0.013
+0.001
+0.023
-0.013
+1.2
67.9
0.11
1.02
0.07
0.0%
Scaled Distribution Mapping
+0.009
-0.012
+0.019
-0.019
-5.5
67.4
0.11
0.91
0.16
0.7%
CDF-transform
+0.013
+0.003
+0.023
-0.013
+0.4
68.0
0.11
1.00
0.04
0.0%
MVS with all-zero guard (variant)
+0.025
+0.016
+0.034
+0.009
-0.0
67.8
0.07
0.98
0.05
0.0%
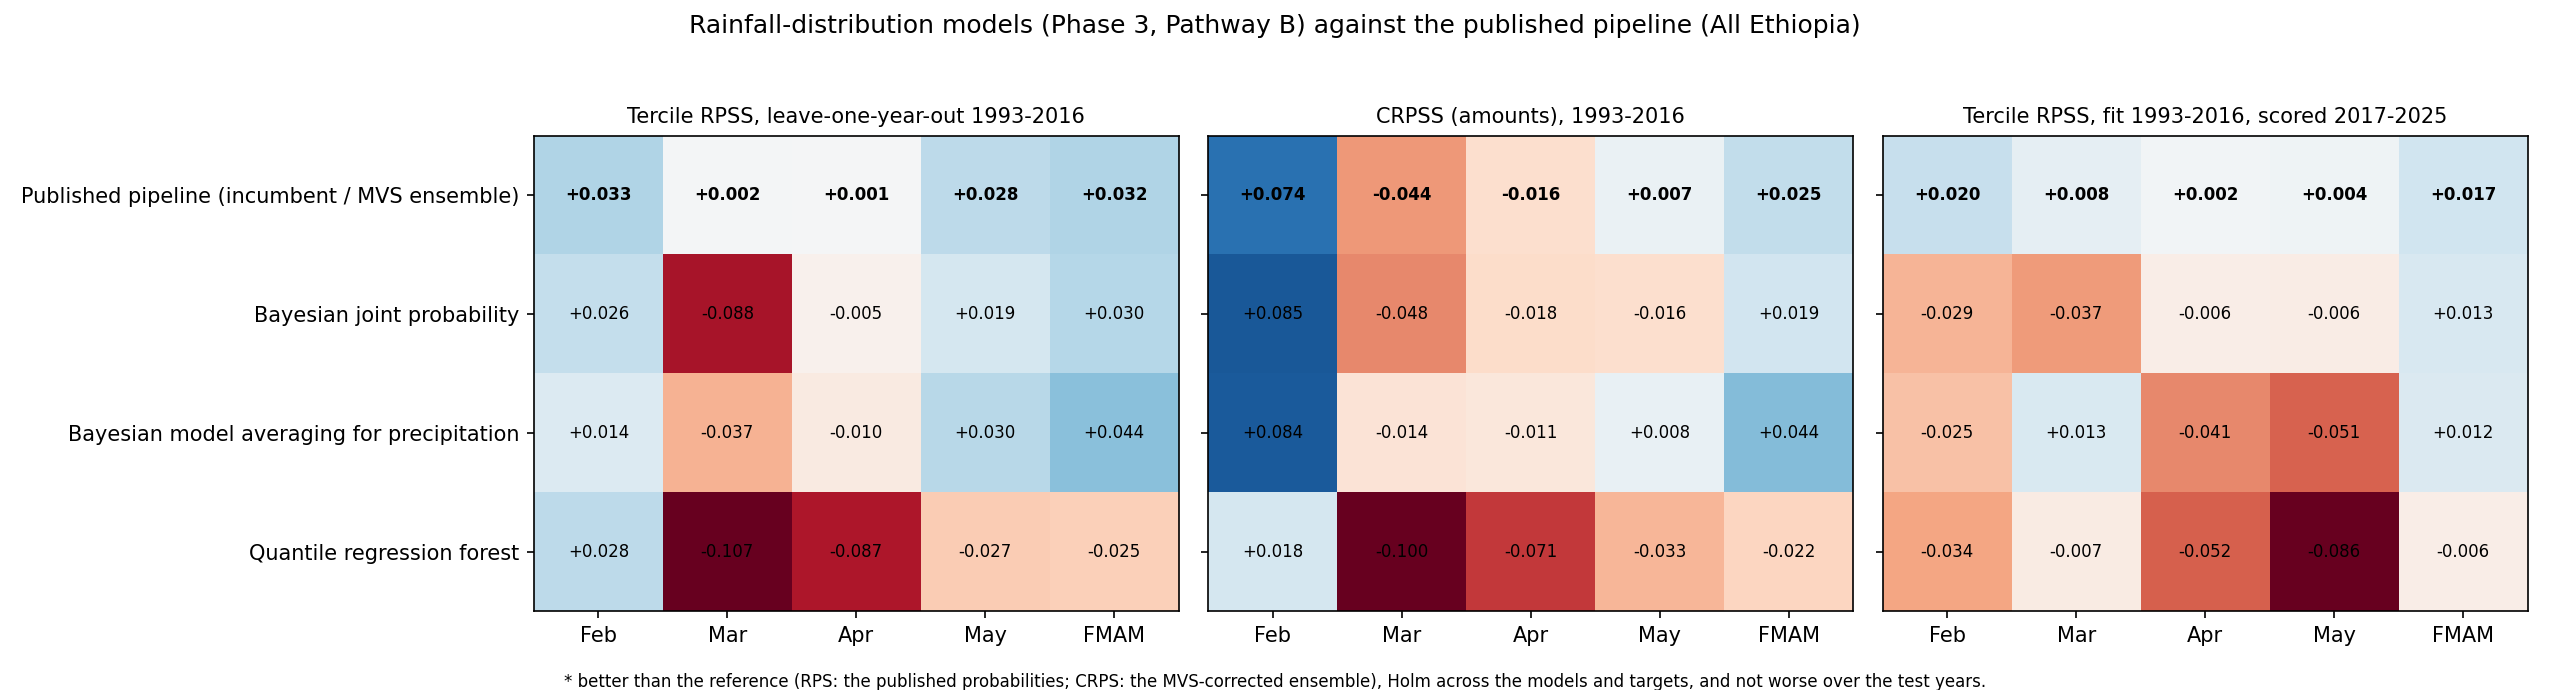
Amount skill (CRPSS) by target, leave-one-year-out 1993–2016
Method
Feb
Mar
Apr
May
FMAM
Raw ECMWF (no correction)
-0.370
-0.372
-0.287
-0.238
-0.696
Linear Scaling
-0.084
-0.083
-0.030
+0.004
+0.019
Mean-Variance Scaling (operational)
+0.070
-0.044
-0.016
+0.007
+0.025
Variance Scaling (unbounded)
+0.076 ✓
-0.040 ✓
-0.016
+0.007
+0.025
Square-root-space Mean-Variance Scaling
+0.110 ✓
-0.019 ✓
-0.014
+0.011
+0.025
Power Transformation
+0.064
-0.020
-0.017
+0.012
+0.024
Delta Change
+0.051
-0.062
-0.021
+0.010
+0.029
Local Intensity Scaling
-0.049
-0.076
-0.029
+0.004
+0.020
Empirical Quantile Mapping
+0.099
-0.028
-0.026
+0.000
+0.011
Gamma Quantile Mapping
+0.084
-0.021 ✓
-0.014
+0.011
+0.025
Detrended Quantile Mapping
+0.033
-0.074
-0.037
-0.004
+0.013
Quantile Delta Mapping
+0.082
-0.084
-0.046
-0.000
+0.013
Scaled Distribution Mapping
-0.111
-0.101
-0.050
-0.007
+0.009
CDF-transform
-0.085
-0.085
-0.041
-0.001
+0.013
MVS with all-zero guard (variant)
+0.070
-0.044
-0.016
+0.007
+0.025
Tercile skill (RPSS of smoothed counts, no blend) by target, 1993–2016
Method
Feb
Mar
Apr
May
FMAM
Raw ECMWF (no correction)
-0.298
-0.325
-0.248
-0.208
-0.465
Linear Scaling
-0.050
-0.055
-0.026
+0.028
+0.035
Mean-Variance Scaling (operational)
-0.093
-0.111
-0.027
+0.026
+0.034
Variance Scaling (unbounded)
-0.083
-0.104 ✓
-0.022
+0.026
+0.035
Square-root-space Mean-Variance Scaling
+0.077 ✓✓
-0.012 ✓✓
-0.021
+0.034
+0.035
Power Transformation
+0.055 ✓✓
-0.024 ✓✓
-0.027
+0.034
+0.034
Delta Change
+0.002
-0.096
-0.034
+0.024
+0.031
Local Intensity Scaling
-0.057
-0.054
-0.026
+0.028
+0.036
Empirical Quantile Mapping
+0.082 ✓✓
-0.025 ✓
-0.035
+0.022
+0.023
Gamma Quantile Mapping
+0.036 ✓✓
-0.035 ✓✓
-0.022
+0.034
+0.035
Detrended Quantile Mapping
-0.000
-0.092
-0.054
+0.017
+0.024
Quantile Delta Mapping
+0.069
-0.075
-0.067
+0.020
+0.023
Scaled Distribution Mapping
-0.122
-0.150
-0.070
+0.011
+0.019
CDF-transform
-0.064
-0.087
-0.059
+0.020
+0.023
MVS with all-zero guard (variant)
-0.093
-0.111
-0.027
+0.026
+0.034
More scores by target: test years, fair CRPS, bias, correlation, spread, reliability, coverage
Amount skill (CRPSS), fit 1993–2016, scored 2017–2025
Method
Feb
Mar
Apr
May
FMAM
Raw ECMWF (no correction)
-0.628
-0.414
-0.356
-0.391
-0.803
Linear Scaling
-0.259
-0.028
-0.022
-0.019
+0.020
Mean-Variance Scaling (operational)
+0.000
+0.005
-0.006
-0.007
+0.016
Variance Scaling (unbounded)
+0.003
+0.009
-0.005
-0.009
+0.015
Square-root-space Mean-Variance Scaling
+0.015
+0.030
-0.000
-0.012
+0.018
Power Transformation
-0.032
+0.030
+0.002
-0.004
+0.017
Delta Change
-0.086
+0.011
-0.005
-0.001
+0.010
Local Intensity Scaling
-0.218
-0.024
-0.021
-0.019
+0.020
Empirical Quantile Mapping
+0.012
+0.023
-0.011
-0.019
+0.005
Gamma Quantile Mapping
+0.010
+0.029
+0.002
-0.015
+0.019
Detrended Quantile Mapping
-0.110
+0.018
-0.020
-0.019
+0.004
Quantile Delta Mapping
-0.054
+0.016
-0.025
-0.019
+0.001
Scaled Distribution Mapping
-0.265
-0.037
-0.039
-0.023
-0.012
CDF-transform
-0.232
+0.016
-0.025
-0.021
+0.003
MVS with all-zero guard (variant)
+0.000
+0.005
-0.006
-0.007
+0.016
Amount skill with the fair CRPS (diagnostic), 1993–2016
Method
Feb
Mar
Apr
May
FMAM
Raw ECMWF (no correction)
-0.404
-0.406
-0.311
-0.261
-0.740
Linear Scaling
-0.070
-0.075
-0.029
+0.002
+0.022
Mean-Variance Scaling (operational)
+0.063
-0.055
-0.023
+0.001
+0.020
Variance Scaling (unbounded)
+0.069 ✓
-0.050 ✓
-0.022
+0.002
+0.021
Square-root-space Mean-Variance Scaling
+0.109 ✓
-0.025 ✓✓
-0.019
+0.008
+0.021
Power Transformation
+0.064
-0.025
-0.022
+0.007 ✓
+0.020
Delta Change
+0.053
-0.064
-0.022
+0.010
+0.030
Local Intensity Scaling
-0.040
-0.069
-0.028
+0.002
+0.022
Empirical Quantile Mapping
+0.096
-0.035
-0.033
-0.005
+0.005
Gamma Quantile Mapping
+0.079
-0.027 ✓
-0.019
+0.007
+0.020
Detrended Quantile Mapping
+0.029
-0.082
-0.044
-0.009
+0.008
Quantile Delta Mapping
+0.082
-0.091
-0.053
-0.005
+0.009
Scaled Distribution Mapping
-0.129
-0.117
-0.061
-0.017
-0.000
CDF-transform
-0.095
-0.093
-0.047
-0.007
+0.008
MVS with all-zero guard (variant)
+0.063
-0.055
-0.023
+0.001
+0.020
Tercile skill (RPSS, no blend), fit 1993–2016, scored 2017–2025
Method
Feb
Mar
Apr
May
FMAM
Raw ECMWF (no correction)
-0.889
-0.417
-0.361
-0.414
-0.760
Linear Scaling
-0.467
-0.063
-0.043
-0.055
+0.004
Mean-Variance Scaling (operational)
-0.116
-0.067
-0.029
-0.025
+0.009
Variance Scaling (unbounded)
-0.099
-0.058
-0.028
-0.027
+0.008
Square-root-space Mean-Variance Scaling
-0.031
+0.017
-0.018
-0.038
+0.013
Power Transformation
-0.063
+0.011
-0.009
-0.020
+0.014
Delta Change
-0.300
-0.001
-0.024
-0.016
-0.010
Local Intensity Scaling
-0.471
-0.056
-0.044
-0.056
+0.004
Empirical Quantile Mapping
-0.092
+0.003
-0.025
-0.035
-0.004
Gamma Quantile Mapping
-0.039
+0.017
-0.013
-0.031
+0.015
Detrended Quantile Mapping
-0.347
-0.005
-0.044
-0.035
-0.009
Quantile Delta Mapping
-0.195
-0.022
-0.050
-0.039
-0.013
Scaled Distribution Mapping
-0.599
-0.100
-0.067
-0.052
-0.019
CDF-transform
-0.387
-0.027
-0.058
-0.047
-0.013
MVS with all-zero guard (variant)
-0.116
-0.067
-0.029
-0.025
+0.009
Ensemble-mean bias (mm), 1993–2016
Method
Feb
Mar
Apr
May
FMAM
Raw ECMWF (no correction)
-8.7
-25.9
-28.8
-22.6
-86.1
Linear Scaling
+0.1
+0.2
+0.1
+0.0
+0.0
Mean-Variance Scaling (operational)
+0.0
+0.1
+0.0
+0.0
-0.0
Variance Scaling (unbounded)
+0.0
+0.1
+0.0
+0.0
-0.0
Square-root-space Mean-Variance Scaling
+0.0
+0.1
+0.0
+0.0
-0.0
Power Transformation
-0.0
+0.0
+0.0
+0.0
-0.0
Delta Change
+0.1
+0.2
+0.1
+0.0
+0.0
Local Intensity Scaling
-0.7
-0.2
-0.0
+0.0
+0.0
Empirical Quantile Mapping
-0.1
+0.0
+0.0
+0.0
-0.0
Gamma Quantile Mapping
-0.1
-0.0
+0.1
-0.0
+0.0
Detrended Quantile Mapping
+0.5
+0.9
+0.3
+0.3
+0.2
Quantile Delta Mapping
+1.1
+2.1
+1.1
+0.6
+1.2
Scaled Distribution Mapping
-5.4
-7.4
-4.9
-4.0
-5.5
CDF-transform
+2.3
+2.0
+0.8
+0.5
+0.4
MVS with all-zero guard (variant)
+0.0
+0.1
+0.0
+0.0
-0.0
Correlation of the ensemble mean with CHIRPS over years, 1993–2016
Method
Feb
Mar
Apr
May
FMAM
Raw ECMWF (no correction)
+0.29
+0.02
+0.07
+0.18
+0.24
Linear Scaling
+0.21
-0.09
-0.11
+0.01
+0.11
Mean-Variance Scaling (operational)
+0.14
-0.15
-0.14
-0.00
+0.07
Variance Scaling (unbounded)
+0.12
-0.15
-0.14
-0.00
+0.07
Square-root-space Mean-Variance Scaling
+0.17
-0.12
-0.13
+0.01
+0.07
Power Transformation
+0.20
-0.11
-0.14
+0.01
+0.07
Delta Change
+0.20
-0.09
-0.11
+0.01
+0.11
Local Intensity Scaling
+0.20
-0.09
-0.11
+0.01
+0.11
Empirical Quantile Mapping
+0.16
-0.12
-0.14
-0.00
+0.06
Gamma Quantile Mapping
+0.13
-0.13
-0.14
+0.01
+0.07
Detrended Quantile Mapping
+0.22
-0.07
-0.10
+0.02
+0.10
Quantile Delta Mapping
+0.19
-0.07
-0.10
+0.02
+0.11
Scaled Distribution Mapping
+0.22
-0.06
-0.11
+0.01
+0.11
CDF-transform
+0.25
-0.06
-0.09
+0.03
+0.11
MVS with all-zero guard (variant)
+0.14
-0.15
-0.14
-0.00
+0.07
Spread–error ratio, 1993–2016 (1 = spread matches the error)
Score coverage, mean per year, 1993–2016 (share of the region’s area)
Target
Amount cells
Amount area
Probability cells
Probability area
Feb
1484
100%
1263
85%
Mar
1484
100%
1463
99%
Apr
1484
100%
1484
100%
May
1484
100%
1484
100%
FMAM
1484
100%
1484
100%
Dry months: shares of totals at exactly 0 mm and at ≤ 1 mm, CHIRPS and corrected
Area-weighted mean share over cells, pooled leave-one-year-out 1993–2025
Exactly 0 mm
≤ 1 mm
Feb: CHIRPS
0.2%
12.9%
Raw ECMWF (no correction)
12.2%
50.0%
Linear Scaling
12.2%
40.7%
Mean-Variance Scaling (operational)
2.7%
13.4%
Variance Scaling (unbounded)
1.5%
12.6%
Square-root-space Mean-Variance Scaling
0.5%
13.4%
Power Transformation
12.2%
21.1%
Delta Change
0.2%
16.1%
Local Intensity Scaling
19.8%
19.8%
Empirical Quantile Mapping
12.9%
13.0%
Gamma Quantile Mapping
11.3%
14.9%
Detrended Quantile Mapping
12.7%
17.1%
Quantile Delta Mapping
12.9%
13.9%
Scaled Distribution Mapping
43.3%
50.7%
CDF-transform
0.2%
16.0%
MVS with all-zero guard (variant)
2.7%
13.4%
Mar: CHIRPS
0.7%
5.1%
Raw ECMWF (no correction)
2.2%
20.1%
Linear Scaling
2.2%
14.5%
Mean-Variance Scaling (operational)
1.3%
3.0%
Variance Scaling (unbounded)
0.6%
3.0%
Square-root-space Mean-Variance Scaling
0.4%
5.1%
Power Transformation
2.2%
7.3%
Delta Change
0.7%
6.1%
Local Intensity Scaling
6.5%
6.5%
Empirical Quantile Mapping
5.1%
5.1%
Gamma Quantile Mapping
5.1%
7.4%
Detrended Quantile Mapping
4.8%
6.2%
Quantile Delta Mapping
5.1%
5.5%
Scaled Distribution Mapping
21.9%
22.3%
CDF-transform
0.4%
5.9%
MVS with all-zero guard (variant)
1.3%
3.0%
Apr: CHIRPS
0.2%
1.3%
Raw ECMWF (no correction)
0.3%
3.6%
Linear Scaling
0.3%
2.4%
Mean-Variance Scaling (operational)
0.2%
0.3%
Variance Scaling (unbounded)
0.2%
0.3%
Square-root-space Mean-Variance Scaling
0.0%
0.5%
Power Transformation
0.3%
0.7%
Delta Change
0.2%
1.4%
Local Intensity Scaling
1.4%
1.4%
Empirical Quantile Mapping
1.3%
1.4%
Gamma Quantile Mapping
1.3%
1.5%
Detrended Quantile Mapping
1.3%
1.4%
Quantile Delta Mapping
1.4%
1.6%
Scaled Distribution Mapping
4.9%
4.9%
CDF-transform
0.1%
1.2%
MVS with all-zero guard (variant)
0.2%
0.3%
May: CHIRPS
0.5%
1.3%
Raw ECMWF (no correction)
0.2%
2.4%
Linear Scaling
0.2%
1.5%
Mean-Variance Scaling (operational)
0.2%
0.2%
Variance Scaling (unbounded)
0.2%
0.3%
Square-root-space Mean-Variance Scaling
0.0%
0.3%
Power Transformation
0.2%
0.3%
Delta Change
0.5%
1.3%
Local Intensity Scaling
1.3%
1.3%
Empirical Quantile Mapping
1.3%
1.3%
Gamma Quantile Mapping
1.2%
1.4%
Detrended Quantile Mapping
1.2%
1.3%
Quantile Delta Mapping
1.3%
1.3%
Scaled Distribution Mapping
3.6%
3.7%
CDF-transform
0.2%
1.1%
MVS with all-zero guard (variant)
0.2%
0.2%
FMAM: CHIRPS
0.0%
0.0%
Raw ECMWF (no correction)
0.0%
0.0%
Linear Scaling
0.0%
0.0%
Mean-Variance Scaling (operational)
0.0%
0.0%
Variance Scaling (unbounded)
0.0%
0.0%
Square-root-space Mean-Variance Scaling
0.0%
0.0%
Power Transformation
0.0%
0.0%
Delta Change
0.0%
0.0%
Local Intensity Scaling
0.0%
0.0%
Empirical Quantile Mapping
0.0%
0.0%
Gamma Quantile Mapping
0.0%
0.0%
Detrended Quantile Mapping
0.0%
0.0%
Quantile Delta Mapping
0.0%
0.0%
Scaled Distribution Mapping
0.7%
0.7%
CDF-transform
0.0%
0.0%
MVS with all-zero guard (variant)
0.0%
0.0%
Distribution of the corrected members (mean, spread, 10th and 90th percentiles)
Mean of the corrected members / CHIRPS (area-weighted median of cell ratios, 1993–2025; 1 = same)
Method
Feb
Mar
Apr
May
FMAM
Raw ECMWF (no correction)
0.43
0.47
0.67
0.70
0.63
Linear Scaling
1.00
1.00
1.00
1.00
1.00
Mean-Variance Scaling (operational)
1.00
1.00
1.00
1.00
1.00
Variance Scaling (unbounded)
1.00
1.00
1.00
1.00
1.00
Square-root-space Mean-Variance Scaling
1.00
1.00
1.00
1.00
1.00
Power Transformation
1.00
1.00
1.00
1.00
1.00
Delta Change
1.00
1.00
1.00
1.00
1.00
Local Intensity Scaling
0.96
1.00
1.00
1.00
1.00
Empirical Quantile Mapping
1.00
1.00
1.00
1.00
1.00
Gamma Quantile Mapping
0.99
1.00
1.00
1.00
1.00
Detrended Quantile Mapping
1.02
1.01
1.00
1.00
1.00
Quantile Delta Mapping
1.06
1.03
1.01
1.01
1.00
Scaled Distribution Mapping
0.59
0.82
0.95
0.96
0.98
CDF-transform
1.13
1.03
1.01
1.01
1.00
MVS with all-zero guard (variant)
1.00
1.00
1.00
1.00
1.00
Standard deviation of the corrected members / CHIRPS (area-weighted median of cell ratios, 1993–2025; 1 = same)
Method
Feb
Mar
Apr
May
FMAM
Raw ECMWF (no correction)
0.92
0.69
0.82
0.79
0.70
Linear Scaling
2.01
1.54
1.22
1.16
1.12
Mean-Variance Scaling (operational)
1.01
1.01
1.00
1.00
1.00
Variance Scaling (unbounded)
1.01
1.01
1.00
1.00
1.00
Square-root-space Mean-Variance Scaling
1.05
1.06
1.02
1.03
0.99
Power Transformation
1.00
1.00
1.00
1.00
1.00
Delta Change
1.33
1.12
1.05
1.04
1.05
Local Intensity Scaling
1.73
1.47
1.22
1.16
1.12
Empirical Quantile Mapping
0.99
1.00
1.00
1.00
1.00
Gamma Quantile Mapping
0.90
1.02
1.01
1.03
0.98
Detrended Quantile Mapping
1.27
1.09
1.02
1.02
1.01
Quantile Delta Mapping
1.34
1.13
1.04
1.04
1.03
Scaled Distribution Mapping
0.95
0.92
0.92
0.92
0.92
CDF-transform
1.41
1.14
1.05
1.04
1.04
MVS with all-zero guard (variant)
1.01
1.01
1.00
1.00
1.00
10th percentile of the corrected members / CHIRPS (area-weighted median of cell ratios, 1993–2025; 1 = same)
Method
Feb
Mar
Apr
May
FMAM
Raw ECMWF (no correction)
0.01
0.09
0.47
0.63
0.54
Linear Scaling
0.03
0.21
0.69
0.90
0.87
Mean-Variance Scaling (operational)
1.18
1.54
1.06
1.06
0.97
Variance Scaling (unbounded)
1.21
1.49
1.05
1.05
0.96
Square-root-space Mean-Variance Scaling
0.89
0.98
0.97
1.00
0.96
Power Transformation
0.36
0.73
0.92
1.00
0.94
Delta Change
0.53
0.85
0.92
0.93
0.95
Local Intensity Scaling
0.16
0.30
0.68
0.88
0.87
Empirical Quantile Mapping
0.99
0.96
0.94
0.95
0.98
Gamma Quantile Mapping
0.68
0.90
0.95
0.98
0.96
Detrended Quantile Mapping
0.52
0.86
0.92
0.94
0.96
Quantile Delta Mapping
0.88
0.86
0.91
0.94
0.97
Scaled Distribution Mapping
0.00
0.00
0.91
0.96
0.98
CDF-transform
0.48
0.83
0.92
0.96
0.96
MVS with all-zero guard (variant)
1.18
1.54
1.06
1.06
0.97
90th percentile of the corrected members / CHIRPS (area-weighted median of cell ratios, 1993–2025; 1 = same)
Method
Feb
Mar
Apr
May
FMAM
Raw ECMWF (no correction)
0.59
0.56
0.75
0.75
0.66
Linear Scaling
1.34
1.23
1.11
1.09
1.05
Mean-Variance Scaling (operational)
0.94
0.98
1.01
1.02
1.00
Variance Scaling (unbounded)
0.93
0.98
1.02
1.02
1.01
Square-root-space Mean-Variance Scaling
1.05
1.02
1.03
1.04
1.00
Power Transformation
1.11
1.02
1.02
1.02
1.00
Delta Change
1.13
1.06
1.04
1.03
1.03
Local Intensity Scaling
1.20
1.20
1.11
1.09
1.05
Empirical Quantile Mapping
1.04
1.05
1.03
1.02
1.02
Gamma Quantile Mapping
0.97
1.00
1.03
1.04
1.00
Detrended Quantile Mapping
1.14
1.07
1.03
1.03
1.02
Quantile Delta Mapping
1.14
1.08
1.04
1.03
1.02
Scaled Distribution Mapping
0.71
0.88
0.96
0.96
0.97
CDF-transform
1.30
1.09
1.04
1.03
1.02
MVS with all-zero guard (variant)
0.94
0.98
1.01
1.02
1.00
Tables for: FMAM rainfall contribution domain. Screening marks are computed for the national aggregate (All Ethiopia) only. Bold: the operational method. Skill is against the CHIRPS training climatology (0 = no better than climatology).
FMAM season at a glance — FMAM rainfall contribution domain
Method
Amount CRPSS
Tercile RPSS (no blend)
Diagnostics, leave-one-year-out 1993–2016
1993–2016
2017–2025
1993–2016
2017–2025
Mean bias (mm)
MAE (mm)
Correlation
Spread–error
Reliability index
Members ≤ 1 mm
Raw ECMWF (no correction)
-0.831
-0.906
-0.564
-0.918
-104.5
118.3
0.26
0.43
0.94
0.0%
Linear Scaling
+0.023
+0.021
+0.040
+0.000
+0.0
70.8
0.13
1.17
0.14
0.0%
Mean-Variance Scaling (operational)
+0.028
+0.016
+0.037
+0.006
-0.0
70.8
0.10
0.98
0.05
0.0%
Variance Scaling (unbounded)
+0.028
+0.015
+0.039
+0.005
-0.0
70.8
0.10
0.99
0.04
0.0%
Square-root-space Mean-Variance Scaling
+0.028
+0.018
+0.039
+0.011
-0.0
70.7
0.10
0.98
0.05
0.0%
Power Transformation
+0.027
+0.017
+0.038
+0.013
-0.0
70.8
0.10
0.99
0.07
0.0%
Delta Change
+0.032
+0.012
+0.037
-0.008
+0.0
70.8
0.13
1.04
0.03
0.0%
Local Intensity Scaling
+0.023
+0.021
+0.041
+0.000
+0.0
70.8
0.13
1.17
0.13
0.0%
Empirical Quantile Mapping
+0.014
+0.006
+0.028
-0.007
-0.0
71.0
0.09
0.98
0.05
0.0%
Gamma Quantile Mapping
+0.028
+0.019
+0.039
+0.013
+0.0
70.7
0.10
0.97
0.06
0.0%
Detrended Quantile Mapping
+0.017
+0.005
+0.031
-0.010
+0.2
71.0
0.13
0.99
0.04
0.0%
Quantile Delta Mapping
+0.018
+0.002
+0.031
-0.014
+1.3
70.8
0.14
1.03
0.06
0.0%
Scaled Distribution Mapping
+0.014
-0.014
+0.026
-0.023
-6.0
70.3
0.14
0.92
0.15
0.7%
CDF-transform
+0.018
+0.003
+0.031
-0.017
+0.4
70.9
0.14
1.00
0.04
0.0%
MVS with all-zero guard (variant)
+0.028
+0.016
+0.037
+0.006
-0.0
70.8
0.10
0.98
0.05
0.0%
Amount skill (CRPSS) by target, leave-one-year-out 1993–2016
Method
Feb
Mar
Apr
May
FMAM
Raw ECMWF (no correction)
-0.364
-0.398
-0.331
-0.271
-0.831
Linear Scaling
-0.068
-0.087
-0.035
+0.019
+0.023
Mean-Variance Scaling (operational)
+0.074
-0.045
-0.021
+0.019
+0.028
Variance Scaling (unbounded)
+0.079
-0.041
-0.020
+0.019
+0.028
Square-root-space Mean-Variance Scaling
+0.115
-0.020
-0.019
+0.024
+0.028
Power Transformation
+0.069
-0.020
-0.022
+0.026
+0.027
Delta Change
+0.062
-0.062
-0.025
+0.023
+0.032
Local Intensity Scaling
-0.040
-0.080
-0.034
+0.019
+0.023
Empirical Quantile Mapping
+0.103
-0.028
-0.032
+0.013
+0.014
Gamma Quantile Mapping
+0.088
-0.022
-0.020
+0.024
+0.028
Detrended Quantile Mapping
+0.045
-0.075
-0.043
+0.013
+0.017
Quantile Delta Mapping
+0.088
-0.086
-0.051
+0.016
+0.018
Scaled Distribution Mapping
-0.096
-0.103
-0.056
+0.009
+0.014
CDF-transform
-0.073
-0.088
-0.045
+0.013
+0.018
MVS with all-zero guard (variant)
+0.074
-0.045
-0.021
+0.019
+0.028
Tercile skill (RPSS of smoothed counts, no blend) by target, 1993–2016
Method
Feb
Mar
Apr
May
FMAM
Raw ECMWF (no correction)
-0.327
-0.361
-0.309
-0.238
-0.564
Linear Scaling
-0.053
-0.058
-0.033
+0.042
+0.040
Mean-Variance Scaling (operational)
-0.113
-0.117
-0.033
+0.038
+0.037
Variance Scaling (unbounded)
-0.097
-0.108
-0.028
+0.038
+0.039
Square-root-space Mean-Variance Scaling
+0.078
-0.012
-0.029
+0.048
+0.039
Power Transformation
+0.058
-0.024
-0.034
+0.048
+0.038
Delta Change
+0.004
-0.099
-0.040
+0.041
+0.037
Local Intensity Scaling
-0.065
-0.057
-0.032
+0.041
+0.041
Empirical Quantile Mapping
+0.083
-0.021
-0.044
+0.037
+0.028
Gamma Quantile Mapping
+0.036
-0.036
-0.030
+0.047
+0.039
Detrended Quantile Mapping
+0.001
-0.096
-0.065
+0.036
+0.031
Quantile Delta Mapping
+0.071
-0.080
-0.077
+0.040
+0.031
Scaled Distribution Mapping
-0.125
-0.151
-0.081
+0.031
+0.026
CDF-transform
-0.060
-0.094
-0.067
+0.037
+0.031
MVS with all-zero guard (variant)
-0.113
-0.117
-0.033
+0.038
+0.037
More scores by target: test years, fair CRPS, bias, correlation, spread, reliability, coverage
Amount skill (CRPSS), fit 1993–2016, scored 2017–2025
Method
Feb
Mar
Apr
May
FMAM
Raw ECMWF (no correction)
-0.672
-0.427
-0.383
-0.486
-0.906
Linear Scaling
-0.273
-0.017
-0.017
-0.040
+0.021
Mean-Variance Scaling (operational)
-0.009
+0.011
-0.005
-0.027
+0.016
Variance Scaling (unbounded)
-0.007
+0.015
-0.005
-0.028
+0.015
Square-root-space Mean-Variance Scaling
+0.005
+0.036
+0.001
-0.030
+0.018
Power Transformation
-0.046
+0.036
+0.003
-0.022
+0.017
Delta Change
-0.103
+0.020
-0.001
-0.024
+0.012
Local Intensity Scaling
-0.235
-0.015
-0.017
-0.039
+0.021
Empirical Quantile Mapping
+0.005
+0.030
-0.011
-0.035
+0.006
Gamma Quantile Mapping
-0.000
+0.035
+0.003
-0.031
+0.019
Detrended Quantile Mapping
-0.130
+0.029
-0.017
-0.040
+0.005
Quantile Delta Mapping
-0.071
+0.027
-0.023
-0.038
+0.002
Scaled Distribution Mapping
-0.268
-0.031
-0.038
-0.045
-0.014
CDF-transform
-0.265
+0.029
-0.023
-0.041
+0.003
MVS with all-zero guard (variant)
-0.009
+0.011
-0.005
-0.027
+0.016
Amount skill with the fair CRPS (diagnostic), 1993–2016
Method
Feb
Mar
Apr
May
FMAM
Raw ECMWF (no correction)
-0.400
-0.434
-0.359
-0.298
-0.883
Linear Scaling
-0.054
-0.079
-0.034
+0.016
+0.026
Mean-Variance Scaling (operational)
+0.065
-0.056
-0.028
+0.014
+0.023
Variance Scaling (unbounded)
+0.071
-0.051
-0.027
+0.014
+0.024
Square-root-space Mean-Variance Scaling
+0.113
-0.026
-0.024
+0.021
+0.024
Power Transformation
+0.069
-0.026
-0.027
+0.021
+0.023
Delta Change
+0.065
-0.064
-0.026
+0.024
+0.034
Local Intensity Scaling
-0.031
-0.073
-0.033
+0.016
+0.026
Empirical Quantile Mapping
+0.100
-0.035
-0.039
+0.008
+0.009
Gamma Quantile Mapping
+0.083
-0.028
-0.025
+0.021
+0.023
Detrended Quantile Mapping
+0.041
-0.083
-0.050
+0.008
+0.012
Quantile Delta Mapping
+0.089
-0.094
-0.058
+0.013
+0.014
Scaled Distribution Mapping
-0.114
-0.119
-0.068
+0.000
+0.005
CDF-transform
-0.081
-0.096
-0.052
+0.008
+0.013
MVS with all-zero guard (variant)
+0.065
-0.056
-0.028
+0.014
+0.023
Tercile skill (RPSS, no blend), fit 1993–2016, scored 2017–2025
Method
Feb
Mar
Apr
May
FMAM
Raw ECMWF (no correction)
-0.957
-0.474
-0.427
-0.499
-0.918
Linear Scaling
-0.476
-0.053
-0.043
-0.073
+0.000
Mean-Variance Scaling (operational)
-0.124
-0.039
-0.029
-0.044
+0.006
Variance Scaling (unbounded)
-0.123
-0.027
-0.027
-0.045
+0.005
Square-root-space Mean-Variance Scaling
-0.043
+0.044
-0.020
-0.055
+0.011
Power Transformation
-0.102
+0.038
-0.013
-0.035
+0.013
Delta Change
-0.358
+0.034
-0.021
-0.041
-0.008
Local Intensity Scaling
-0.495
-0.045
-0.043
-0.074
+0.000
Empirical Quantile Mapping
-0.109
+0.026
-0.028
-0.051
-0.007
Gamma Quantile Mapping
-0.084
+0.043
-0.016
-0.047
+0.013
Detrended Quantile Mapping
-0.411
+0.030
-0.044
-0.056
-0.010
Quantile Delta Mapping
-0.205
+0.004
-0.054
-0.057
-0.014
Scaled Distribution Mapping
-0.609
-0.090
-0.071
-0.075
-0.023
CDF-transform
-0.439
+0.004
-0.059
-0.067
-0.017
MVS with all-zero guard (variant)
-0.124
-0.039
-0.029
-0.044
+0.006
Ensemble-mean bias (mm), 1993–2016
Method
Feb
Mar
Apr
May
FMAM
Raw ECMWF (no correction)
-11.2
-31.5
-36.4
-25.4
-104.5
Linear Scaling
+0.1
+0.2
+0.1
+0.0
+0.0
Mean-Variance Scaling (operational)
+0.0
+0.1
+0.0
+0.0
-0.0
Variance Scaling (unbounded)
+0.0
+0.1
+0.0
+0.0
-0.0
Square-root-space Mean-Variance Scaling
-0.0
+0.1
+0.0
+0.0
-0.0
Power Transformation
-0.0
+0.0
+0.0
+0.0
-0.0
Delta Change
+0.1
+0.2
+0.1
+0.0
+0.0
Local Intensity Scaling
-0.8
-0.2
-0.0
-0.0
+0.0
Empirical Quantile Mapping
-0.1
+0.0
+0.0
+0.0
-0.0
Gamma Quantile Mapping
-0.2
-0.0
+0.1
-0.0
+0.0
Detrended Quantile Mapping
+0.6
+1.0
+0.2
+0.2
+0.2
Quantile Delta Mapping
+1.4
+2.4
+1.2
+0.6
+1.3
Scaled Distribution Mapping
-6.5
-8.3
-5.5
-4.2
-6.0
CDF-transform
+2.8
+2.4
+0.8
+0.3
+0.4
MVS with all-zero guard (variant)
+0.0
+0.1
+0.0
+0.0
-0.0
Correlation of the ensemble mean with CHIRPS over years, 1993–2016
Method
Feb
Mar
Apr
May
FMAM
Raw ECMWF (no correction)
+0.32
+0.04
+0.04
+0.24
+0.26
Linear Scaling
+0.23
-0.08
-0.14
+0.07
+0.13
Mean-Variance Scaling (operational)
+0.15
-0.13
-0.17
+0.05
+0.10
Variance Scaling (unbounded)
+0.14
-0.13
-0.17
+0.05
+0.10
Square-root-space Mean-Variance Scaling
+0.19
-0.11
-0.17
+0.07
+0.10
Power Transformation
+0.23
-0.10
-0.17
+0.07
+0.10
Delta Change
+0.23
-0.08
-0.14
+0.07
+0.13
Local Intensity Scaling
+0.22
-0.08
-0.14
+0.07
+0.13
Empirical Quantile Mapping
+0.18
-0.11
-0.17
+0.06
+0.09
Gamma Quantile Mapping
+0.15
-0.11
-0.17
+0.07
+0.10
Detrended Quantile Mapping
+0.24
-0.06
-0.13
+0.08
+0.13
Quantile Delta Mapping
+0.21
-0.06
-0.14
+0.08
+0.14
Scaled Distribution Mapping
+0.24
-0.05
-0.15
+0.07
+0.14
CDF-transform
+0.28
-0.04
-0.12
+0.07
+0.14
MVS with all-zero guard (variant)
+0.15
-0.13
-0.17
+0.05
+0.10
Spread–error ratio, 1993–2016 (1 = spread matches the error)
Score coverage, mean per year, 1993–2016 (share of the region’s area)
Target
Amount cells
Amount area
Probability cells
Probability area
Feb
1120
100%
1018
91%
Mar
1120
100%
1117
100%
Apr
1120
100%
1120
100%
May
1120
100%
1120
100%
FMAM
1120
100%
1120
100%
Dry months: shares of totals at exactly 0 mm and at ≤ 1 mm, CHIRPS and corrected
Area-weighted mean share over cells, pooled leave-one-year-out 1993–2025
Exactly 0 mm
≤ 1 mm
Feb: CHIRPS
0.2%
11.6%
Raw ECMWF (no correction)
12.2%
48.8%
Linear Scaling
12.2%
38.4%
Mean-Variance Scaling (operational)
1.8%
11.7%
Variance Scaling (unbounded)
1.1%
11.1%
Square-root-space Mean-Variance Scaling
0.2%
11.7%
Power Transformation
12.2%
20.3%
Delta Change
0.2%
14.1%
Local Intensity Scaling
19.4%
19.4%
Empirical Quantile Mapping
11.6%
11.7%
Gamma Quantile Mapping
10.1%
13.5%
Detrended Quantile Mapping
11.3%
15.2%
Quantile Delta Mapping
11.6%
12.5%
Scaled Distribution Mapping
42.6%
49.2%
CDF-transform
0.1%
14.4%
MVS with all-zero guard (variant)
1.8%
11.7%
Mar: CHIRPS
0.1%
2.5%
Raw ECMWF (no correction)
1.8%
18.3%
Linear Scaling
1.8%
12.0%
Mean-Variance Scaling (operational)
0.6%
1.1%
Variance Scaling (unbounded)
0.6%
1.1%
Square-root-space Mean-Variance Scaling
0.2%
2.8%
Power Transformation
1.8%
5.3%
Delta Change
0.1%
3.5%
Local Intensity Scaling
4.1%
4.1%
Empirical Quantile Mapping
2.5%
2.5%
Gamma Quantile Mapping
2.5%
4.8%
Detrended Quantile Mapping
2.3%
3.5%
Quantile Delta Mapping
2.5%
2.7%
Scaled Distribution Mapping
19.7%
20.0%
CDF-transform
0.1%
3.3%
MVS with all-zero guard (variant)
0.6%
1.1%
Apr: CHIRPS
0.1%
0.5%
Raw ECMWF (no correction)
0.2%
2.6%
Linear Scaling
0.2%
1.4%
Mean-Variance Scaling (operational)
0.2%
0.3%
Variance Scaling (unbounded)
0.2%
0.3%
Square-root-space Mean-Variance Scaling
0.0%
0.1%
Power Transformation
0.2%
0.3%
Delta Change
0.1%
0.5%
Local Intensity Scaling
0.6%
0.6%
Empirical Quantile Mapping
0.5%
0.5%
Gamma Quantile Mapping
0.5%
0.5%
Detrended Quantile Mapping
0.5%
0.5%
Quantile Delta Mapping
0.5%
0.6%
Scaled Distribution Mapping
3.5%
3.5%
CDF-transform
0.0%
0.3%
MVS with all-zero guard (variant)
0.2%
0.3%
May: CHIRPS
0.4%
1.2%
Raw ECMWF (no correction)
0.2%
2.3%
Linear Scaling
0.2%
1.4%
Mean-Variance Scaling (operational)
0.2%
0.3%
Variance Scaling (unbounded)
0.2%
0.3%
Square-root-space Mean-Variance Scaling
0.0%
0.2%
Power Transformation
0.2%
0.3%
Delta Change
0.4%
1.2%
Local Intensity Scaling
1.3%
1.3%
Empirical Quantile Mapping
1.2%
1.2%
Gamma Quantile Mapping
1.2%
1.3%
Detrended Quantile Mapping
1.1%
1.2%
Quantile Delta Mapping
1.2%
1.3%
Scaled Distribution Mapping
3.7%
3.7%
CDF-transform
0.2%
1.1%
MVS with all-zero guard (variant)
0.2%
0.3%
FMAM: CHIRPS
0.0%
0.0%
Raw ECMWF (no correction)
0.0%
0.0%
Linear Scaling
0.0%
0.0%
Mean-Variance Scaling (operational)
0.0%
0.0%
Variance Scaling (unbounded)
0.0%
0.0%
Square-root-space Mean-Variance Scaling
0.0%
0.0%
Power Transformation
0.0%
0.0%
Delta Change
0.0%
0.0%
Local Intensity Scaling
0.0%
0.0%
Empirical Quantile Mapping
0.0%
0.0%
Gamma Quantile Mapping
0.0%
0.0%
Detrended Quantile Mapping
0.0%
0.0%
Quantile Delta Mapping
0.0%
0.0%
Scaled Distribution Mapping
0.8%
0.8%
CDF-transform
0.0%
0.0%
MVS with all-zero guard (variant)
0.0%
0.0%
Distribution of the corrected members (mean, spread, 10th and 90th percentiles)
Mean of the corrected members / CHIRPS (area-weighted median of cell ratios, 1993–2025; 1 = same)
Method
Feb
Mar
Apr
May
FMAM
Raw ECMWF (no correction)
0.40
0.44
0.63
0.65
0.60
Linear Scaling
1.00
1.00
1.00
1.00
1.00
Mean-Variance Scaling (operational)
1.00
1.00
1.00
1.00
1.00
Variance Scaling (unbounded)
1.00
1.00
1.00
1.00
1.00
Square-root-space Mean-Variance Scaling
1.00
1.00
1.00
1.00
1.00
Power Transformation
1.00
1.00
1.00
1.00
1.00
Delta Change
1.00
1.00
1.00
1.00
1.00
Local Intensity Scaling
0.96
1.00
1.00
1.00
1.00
Empirical Quantile Mapping
1.00
1.00
1.00
1.00
1.00
Gamma Quantile Mapping
0.99
1.00
1.00
1.00
1.00
Detrended Quantile Mapping
1.03
1.01
1.00
1.00
1.00
Quantile Delta Mapping
1.07
1.03
1.01
1.00
1.00
Scaled Distribution Mapping
0.59
0.84
0.96
0.96
0.98
CDF-transform
1.14
1.03
1.01
1.01
1.00
MVS with all-zero guard (variant)
1.00
1.00
1.00
1.00
1.00
Standard deviation of the corrected members / CHIRPS (area-weighted median of cell ratios, 1993–2025; 1 = same)
Method
Feb
Mar
Apr
May
FMAM
Raw ECMWF (no correction)
0.79
0.64
0.73
0.75
0.65
Linear Scaling
1.96
1.52
1.18
1.12
1.09
Mean-Variance Scaling (operational)
1.01
1.00
1.00
1.00
1.00
Variance Scaling (unbounded)
1.01
1.01
1.00
1.00
1.00
Square-root-space Mean-Variance Scaling
1.05
1.05
1.01
1.03
0.99
Power Transformation
1.00
1.00
1.00
1.00
1.00
Delta Change
1.32
1.11
1.04
1.04
1.04
Local Intensity Scaling
1.72
1.46
1.18
1.12
1.09
Empirical Quantile Mapping
0.99
1.00
1.00
1.00
1.00
Gamma Quantile Mapping
0.90
1.02
1.00
1.03
0.98
Detrended Quantile Mapping
1.27
1.09
1.01
1.02
1.01
Quantile Delta Mapping
1.34
1.12
1.04
1.04
1.03
Scaled Distribution Mapping
0.94
0.92
0.92
0.92
0.92
CDF-transform
1.39
1.13
1.04
1.04
1.03
MVS with all-zero guard (variant)
1.01
1.00
1.00
1.00
1.00
10th percentile of the corrected members / CHIRPS (area-weighted median of cell ratios, 1993–2025; 1 = same)
Method
Feb
Mar
Apr
May
FMAM
Raw ECMWF (no correction)
0.01
0.08
0.48
0.64
0.53
Linear Scaling
0.02
0.20
0.73
0.92
0.89
Mean-Variance Scaling (operational)
1.23
1.56
1.02
1.03
0.97
Variance Scaling (unbounded)
1.24
1.49
1.01
1.03
0.96
Square-root-space Mean-Variance Scaling
0.91
0.97
0.96
0.99
0.96
Power Transformation
0.36
0.74
0.92
1.00
0.94
Delta Change
0.50
0.86
0.93
0.94
0.96
Local Intensity Scaling
0.14
0.30
0.74
0.91
0.89
Empirical Quantile Mapping
0.99
0.96
0.95
0.96
0.98
Gamma Quantile Mapping
0.67
0.92
0.95
0.97
0.96
Detrended Quantile Mapping
0.50
0.87
0.93
0.95
0.96
Quantile Delta Mapping
0.87
0.86
0.93
0.95
0.97
Scaled Distribution Mapping
0.00
0.23
0.94
0.96
0.98
CDF-transform
0.46
0.84
0.93
0.97
0.96
MVS with all-zero guard (variant)
1.23
1.56
1.02
1.03
0.97
90th percentile of the corrected members / CHIRPS (area-weighted median of cell ratios, 1993–2025; 1 = same)
Method
Feb
Mar
Apr
May
FMAM
Raw ECMWF (no correction)
0.52
0.52
0.69
0.71
0.62
Linear Scaling
1.31
1.23
1.10
1.07
1.04
Mean-Variance Scaling (operational)
0.93
0.98
1.01
1.01
1.00
Variance Scaling (unbounded)
0.93
0.98
1.02
1.02
1.01
Square-root-space Mean-Variance Scaling
1.04
1.02
1.03
1.03
1.00
Power Transformation
1.13
1.01
1.02
1.02
1.00
Delta Change
1.11
1.06
1.04
1.03
1.03
Local Intensity Scaling
1.21
1.20
1.09
1.06
1.03
Empirical Quantile Mapping
1.04
1.04
1.02
1.02
1.02
Gamma Quantile Mapping
0.98
1.00
1.02
1.03
1.00
Detrended Quantile Mapping
1.14
1.06
1.03
1.03
1.02
Quantile Delta Mapping
1.15
1.07
1.03
1.03
1.02
Scaled Distribution Mapping
0.71
0.89
0.96
0.96
0.97
CDF-transform
1.27
1.09
1.04
1.03
1.02
MVS with all-zero guard (variant)
0.93
0.98
1.01
1.01
1.00
Screening statistics for every method, target and score (within-method and family-wide Holm)
Screening rule (docs/36 rule applied as a screen): a method passes for a target and score if, on the leave-one-year-out 1993-2016 per-year scores, its mean improvement over mvs has a one-sided sign-flip p-value below 0.05 after Holm adjustment, and its mean score over 2017-2025 (fits on 1993-2016) is not worse. 'screen_pass': Holm across the 5 targets of one method. 'screen_pass_family': Holm across every method and target of the benchmark for that score. A screening pass is not an operational adoption decision (see the confirmation run).
Screening statistics, CRPS (method minus Mean-Variance Scaling; negative favours the method)
Method
Target
Δ CRPS 1993–2016 (mm)
95% interval
Years better
p (one-sided)
Holm p (method)
Holm p (all 60)
Δ 2017–2025
Screening
Linear Scaling
Feb
+1.06
+0.48 to +1.57
6/24
0.9992
1.0000
1.0000
+1.87
—
Linear Scaling
Mar
+0.78
-0.38 to +1.77
8/24
0.9097
1.0000
1.0000
+0.77
—
Linear Scaling
Apr
+0.38
-0.21 to +0.92
7/24
0.8955
1.0000
1.0000
+0.49
—
Linear Scaling
May
+0.09
-0.38 to +0.51
7/24
0.6468
1.0000
1.0000
+0.31
—
Linear Scaling
FMAM
+0.27
-0.58 to +1.08
7/24
0.7281
1.0000
1.0000
-0.23
—
Variance Scaling (unbounded)
Feb
-0.04
-0.06 to -0.02
19/24
0.0028
0.0139
0.1637
-0.02
✓
Variance Scaling (unbounded)
Mar
-0.07
-0.12 to -0.02
19/24
0.0037
0.0149
0.2158
-0.10
✓
Variance Scaling (unbounded)
Apr
-0.02
-0.07 to +0.03
13/24
0.2331
0.6992
1.0000
-0.01
—
Variance Scaling (unbounded)
May
+0.00
-0.03 to +0.03
10/24
0.5319
0.8480
1.0000
+0.04
—
Variance Scaling (unbounded)
FMAM
-0.01
-0.07 to +0.05
11/24
0.4240
0.8480
1.0000
+0.05
—
Square-root-space Mean-Variance Scaling
Feb
-0.28
-0.46 to -0.09
17/24
0.0045
0.0179
0.2545
-0.11
✓
Square-root-space Mean-Variance Scaling
Mar
-0.49
-0.82 to -0.19
15/24
0.0015
0.0076
0.0918
-0.58
✓
Square-root-space Mean-Variance Scaling
Apr
-0.08
-0.23 to +0.06
17/24
0.1440
0.3055
1.0000
-0.17
—
Square-root-space Mean-Variance Scaling
May
-0.13
-0.32 to +0.05
13/24
0.1018
0.3055
1.0000
+0.14
—
Square-root-space Mean-Variance Scaling
FMAM
-0.04
-0.12 to +0.05
11/24
0.2197
0.3055
1.0000
-0.14
—
Power Transformation
Feb
+0.04
-0.29 to +0.38
10/24
0.5978
1.0000
1.0000
+0.23
—
Power Transformation
Mar
-0.48
-0.94 to -0.03
13/24
0.0261
0.1042
1.0000
-0.58
—
Power Transformation
Apr
+0.00
-0.20 to +0.22
14/24
0.5065
1.0000
1.0000
-0.25
—
Power Transformation
May
-0.15
-0.28 to -0.02
16/24
0.0179
0.0895
0.9850
-0.09
—
Power Transformation
FMAM
+0.03
-0.17 to +0.22
8/24
0.6242
1.0000
1.0000
-0.04
—
Delta Change
Feb
+0.14
-0.33 to +0.63
11/24
0.7023
1.0000
1.0000
+0.63
—
Delta Change
Mar
+0.36
-0.47 to +1.19
9/24
0.7894
1.0000
1.0000
-0.14
—
Delta Change
Apr
+0.12
-0.29 to +0.54
10/24
0.7086
1.0000
1.0000
-0.01
—
Delta Change
May
-0.08
-0.42 to +0.25
11/24
0.3229
1.0000
1.0000
-0.15
—
Delta Change
FMAM
-0.21
-0.98 to +0.57
12/24
0.3090
1.0000
1.0000
+0.34
—
Local Intensity Scaling
Feb
+0.82
+0.33 to +1.27
6/24
0.9983
1.0000
1.0000
+1.58
—
Local Intensity Scaling
Mar
+0.64
-0.49 to +1.61
7/24
0.8699
1.0000
1.0000
+0.68
—
Local Intensity Scaling
Apr
+0.35
-0.23 to +0.86
7/24
0.8778
1.0000
1.0000
+0.47
—
Local Intensity Scaling
May
+0.09
-0.37 to +0.50
7/24
0.6445
1.0000
1.0000
+0.30
—
Local Intensity Scaling
FMAM
+0.24
-0.59 to +1.05
7/24
0.7117
1.0000
1.0000
-0.24
—
Empirical Quantile Mapping
Feb
-0.20
-0.41 to +0.01
14/24
0.0421
0.2105
1.0000
-0.08
—
Empirical Quantile Mapping
Mar
-0.33
-0.73 to +0.06
13/24
0.0632
0.2529
1.0000
-0.43
—
Empirical Quantile Mapping
Apr
+0.28
+0.05 to +0.51
7/24
0.9868
1.0000
1.0000
+0.17
—
Empirical Quantile Mapping
May
+0.20
-0.05 to +0.46
10/24
0.9287
1.0000
1.0000
+0.30
—
Empirical Quantile Mapping
FMAM
+0.71
+0.50 to +0.91
2/24
1.0000
1.0000
1.0000
+0.64
—
Gamma Quantile Mapping
Feb
-0.09
-0.26 to +0.08
13/24
0.1507
0.6029
1.0000
-0.07
—
Gamma Quantile Mapping
Mar
-0.45
-0.78 to -0.14
15/24
0.0045
0.0225
0.2545
-0.56
✓
Gamma Quantile Mapping
Apr
-0.08
-0.23 to +0.08
16/24
0.1814
0.6029
1.0000
-0.23
—
Gamma Quantile Mapping
May
-0.10
-0.32 to +0.10
10/24
0.1706
0.6029
1.0000
+0.20
—
Gamma Quantile Mapping
FMAM
-0.01
-0.13 to +0.12
10/24
0.4681
0.6029
1.0000
-0.16
—
Detrended Quantile Mapping
Feb
+0.26
-0.46 to +1.02
10/24
0.7370
1.0000
1.0000
+0.80
—
Detrended Quantile Mapping
Mar
+0.61
-0.45 to +1.83
8/24
0.8265
1.0000
1.0000
-0.32
—
Detrended Quantile Mapping
Apr
+0.59
+0.18 to +1.09
11/24
0.9932
1.0000
1.0000
+0.43
—
Detrended Quantile Mapping
May
+0.32
-0.09 to +0.71
7/24
0.9249
1.0000
1.0000
+0.31
—
Detrended Quantile Mapping
FMAM
+0.60
+0.02 to +1.17
6/24
0.9706
1.0000
1.0000
+0.73
—
Quantile Delta Mapping
Feb
-0.08
-0.92 to +0.81
12/24
0.4320
1.0000
1.0000
+0.39
—
Quantile Delta Mapping
Mar
+0.80
-0.53 to +2.29
8/24
0.8377
1.0000
1.0000
-0.25
—
Quantile Delta Mapping
Apr
+0.85
+0.19 to +1.67
9/24
0.9883
1.0000
1.0000
+0.58
—
Quantile Delta Mapping
May
+0.22
-0.22 to +0.66
7/24
0.8164
1.0000
1.0000
+0.29
—
Quantile Delta Mapping
FMAM
+0.57
-0.09 to +1.19
5/24
0.9438
1.0000
1.0000
+0.90
—
Scaled Distribution Mapping
Feb
+1.24
+0.77 to +1.73
4/24
1.0000
1.0000
1.0000
+1.92
—
Scaled Distribution Mapping
Mar
+1.14
-0.15 to +2.28
6/24
0.9568
1.0000
1.0000
+0.98
—
Scaled Distribution Mapping
Apr
+0.96
+0.33 to +1.56
3/24
0.9975
1.0000
1.0000
+1.01
—
Scaled Distribution Mapping
May
+0.41
-0.02 to +0.81
7/24
0.9649
1.0000
1.0000
+0.41
—
Scaled Distribution Mapping
FMAM
+0.80
+0.13 to +1.49
6/24
0.9811
1.0000
1.0000
+1.67
—
CDF-transform
Feb
+1.07
-0.32 to +2.56
8/24
0.9114
1.0000
1.0000
+1.68
—
CDF-transform
Mar
+0.83
-0.44 to +2.38
7/24
0.8465
1.0000
1.0000
-0.27
—
CDF-transform
Apr
+0.69
+0.16 to +1.34
9/24
0.9905
1.0000
1.0000
+0.59
—
CDF-transform
May
+0.24
-0.18 to +0.65
7/24
0.8575
1.0000
1.0000
+0.35
—
CDF-transform
FMAM
+0.58
-0.09 to +1.21
6/24
0.9461
1.0000
1.0000
+0.77
—
MVS with all-zero guard (variant)
Feb
+0.00
+0.00 to +0.00
0/24
1.0000
1.0000
— (variant)
+0.00
—
MVS with all-zero guard (variant)
Mar
+0.00
+0.00 to +0.00
0/24
1.0000
1.0000
— (variant)
+0.00
—
MVS with all-zero guard (variant)
Apr
+0.00
+0.00 to +0.00
0/24
1.0000
1.0000
— (variant)
+0.00
—
MVS with all-zero guard (variant)
May
+0.00
+0.00 to +0.00
0/24
1.0000
1.0000
— (variant)
+0.00
—
MVS with all-zero guard (variant)
FMAM
+0.00
+0.00 to +0.00
0/24
1.0000
1.0000
— (variant)
+0.00
—
Screening statistics, fair CRPS (method minus Mean-Variance Scaling; negative favours the method)
Method
Target
Δ fair CRPS 1993–2016 (mm)
95% interval
Years better
p (one-sided)
Holm p (method)
Holm p (all 60)
Δ 2017–2025
Screening
Linear Scaling
Feb
+0.87
+0.28 to +1.38
6/24
0.9968
1.0000
1.0000
+1.78
—
Linear Scaling
Mar
+0.40
-0.76 to +1.39
8/24
0.7518
1.0000
1.0000
+0.58
—
Linear Scaling
Apr
+0.15
-0.45 to +0.68
9/24
0.6837
1.0000
1.0000
+0.38
—
Linear Scaling
May
-0.01
-0.49 to +0.42
7/24
0.4797
1.0000
1.0000
+0.27
—
Linear Scaling
FMAM
-0.08
-0.94 to +0.74
8/24
0.4309
1.0000
1.0000
-0.39
—
Variance Scaling (unbounded)
Feb
-0.04
-0.07 to -0.02
19/24
0.0015
0.0061
0.0864
-0.02
✓
Variance Scaling (unbounded)
Mar
-0.08
-0.13 to -0.04
19/24
0.0011
0.0057
0.0676
-0.10
✓
Variance Scaling (unbounded)
Apr
-0.03
-0.08 to +0.02
13/24
0.1139
0.3417
1.0000
-0.02
—
Variance Scaling (unbounded)
May
-0.01
-0.04 to +0.02
12/24
0.2705
0.4002
1.0000
+0.03
—
Variance Scaling (unbounded)
FMAM
-0.03
-0.09 to +0.03
13/24
0.2001
0.4002
1.0000
+0.04
—
Square-root-space Mean-Variance Scaling
Feb
-0.30
-0.49 to -0.12
19/24
0.0020
0.0080
0.1123
-0.12
✓
Square-root-space Mean-Variance Scaling
Mar
-0.57
-0.90 to -0.27
17/24
0.0003
0.0015
0.0186
-0.62
✓✓
Square-root-space Mean-Variance Scaling
Apr
-0.13
-0.28 to +0.01
18/24
0.0454
0.1035
1.0000
-0.20
—
Square-root-space Mean-Variance Scaling
May
-0.18
-0.38 to -0.01
14/24
0.0345
0.1035
1.0000
+0.11
—
Square-root-space Mean-Variance Scaling
FMAM
-0.05
-0.13 to +0.04
11/24
0.1500
0.1500
1.0000
-0.14
—
Power Transformation
Feb
-0.01
-0.34 to +0.32
10/24
0.4783
1.0000
1.0000
+0.20
—
Power Transformation
Mar
-0.56
-1.02 to -0.10
14/24
0.0140
0.0562
0.7582
-0.62
—
Power Transformation
Apr
-0.03
-0.23 to +0.19
14/24
0.3856
1.0000
1.0000
-0.26
—
Power Transformation
May
-0.17
-0.30 to -0.04
18/24
0.0079
0.0396
0.4356
-0.10
✓
Power Transformation
FMAM
-0.00
-0.20 to +0.18
9/24
0.4980
1.0000
1.0000
-0.06
—
Delta Change
Feb
+0.06
-0.40 to +0.54
13/24
0.5990
1.0000
1.0000
+0.47
—
Delta Change
Mar
+0.19
-0.64 to +1.00
11/24
0.6617
1.0000
1.0000
-0.61
—
Delta Change
Apr
-0.05
-0.45 to +0.37
11/24
0.4122
1.0000
1.0000
-0.66
—
Delta Change
May
-0.25
-0.60 to +0.08
14/24
0.0772
0.3859
1.0000
-0.77
—
Delta Change
FMAM
-0.48
-1.26 to +0.31
14/24
0.1279
0.5117
1.0000
-0.74
—
Local Intensity Scaling
Feb
+0.67
+0.19 to +1.12
6/24
0.9940
1.0000
1.0000
+1.51
—
Local Intensity Scaling
Mar
+0.28
-0.86 to +1.26
8/24
0.6903
1.0000
1.0000
+0.50
—
Local Intensity Scaling
Apr
+0.12
-0.46 to +0.64
9/24
0.6538
1.0000
1.0000
+0.36
—
Local Intensity Scaling
May
-0.01
-0.48 to +0.41
7/24
0.4851
1.0000
1.0000
+0.26
—
Local Intensity Scaling
FMAM
-0.09
-0.94 to +0.71
8/24
0.4151
1.0000
1.0000
-0.40
—
Empirical Quantile Mapping
Feb
-0.22
-0.43 to -0.01
15/24
0.0293
0.1464
1.0000
-0.09
—
Empirical Quantile Mapping
Mar
-0.39
-0.80 to +0.01
13/24
0.0390
0.1559
1.0000
-0.47
—
Empirical Quantile Mapping
Apr
+0.26
+0.03 to +0.49
7/24
0.9799
1.0000
1.0000
+0.17
—
Empirical Quantile Mapping
May
+0.18
-0.08 to +0.45
10/24
0.9042
1.0000
1.0000
+0.29
—
Empirical Quantile Mapping
FMAM
+0.71
+0.51 to +0.92
2/24
1.0000
1.0000
1.0000
+0.65
—
Gamma Quantile Mapping
Feb
-0.11
-0.28 to +0.07
13/24
0.1137
0.2491
1.0000
-0.08
—
Gamma Quantile Mapping
Mar
-0.53
-0.85 to -0.21
16/24
0.0013
0.0067
0.0774
-0.60
✓
Gamma Quantile Mapping
Apr
-0.12
-0.27 to +0.04
18/24
0.0769
0.2491
1.0000
-0.25
—
Gamma Quantile Mapping
May
-0.17
-0.38 to +0.03
13/24
0.0623
0.2491
1.0000
+0.17
—
Gamma Quantile Mapping
FMAM
-0.00
-0.13 to +0.12
10/24
0.4808
0.4808
1.0000
-0.16
—
Detrended Quantile Mapping
Feb
+0.22
-0.49 to +0.98
11/24
0.7098
1.0000
1.0000
+0.79
—
Detrended Quantile Mapping
Mar
+0.53
-0.53 to +1.74
8/24
0.7935
1.0000
1.0000
-0.35
—
Detrended Quantile Mapping
Apr
+0.57
+0.15 to +1.06
11/24
0.9907
1.0000
1.0000
+0.42
—
Detrended Quantile Mapping
May
+0.29
-0.12 to +0.68
7/24
0.9085
1.0000
1.0000
+0.30
—
Detrended Quantile Mapping
FMAM
+0.60
+0.02 to +1.16
7/24
0.9696
1.0000
1.0000
+0.73
—
Quantile Delta Mapping
Feb
-0.13
-0.97 to +0.75
13/24
0.3860
1.0000
1.0000
+0.37
—
Quantile Delta Mapping
Mar
+0.70
-0.62 to +2.19
8/24
0.8065
1.0000
1.0000
-0.30
—
Quantile Delta Mapping
Apr
+0.80
+0.14 to +1.63
9/24
0.9826
1.0000
1.0000
+0.57
—
Quantile Delta Mapping
May
+0.17
-0.27 to +0.61
7/24
0.7622
1.0000
1.0000
+0.28
—
Quantile Delta Mapping
FMAM
+0.53
-0.13 to +1.16
6/24
0.9335
1.0000
1.0000
+0.89
—
Scaled Distribution Mapping
Feb
+1.26
+0.78 to +1.75
4/24
1.0000
1.0000
1.0000
+1.93
—
Scaled Distribution Mapping
Mar
+1.19
-0.10 to +2.33
6/24
0.9625
1.0000
1.0000
+0.98
—
Scaled Distribution Mapping
Apr
+1.04
+0.41 to +1.65
3/24
0.9987
1.0000
1.0000
+1.04
—
Scaled Distribution Mapping
May
+0.50
+0.07 to +0.91
7/24
0.9848
1.0000
1.0000
+0.44
—
Scaled Distribution Mapping
FMAM
+0.98
+0.30 to +1.67
6/24
0.9945
1.0000
1.0000
+1.74
—
CDF-transform
Feb
+1.03
-0.34 to +2.52
8/24
0.9052
1.0000
1.0000
+1.66
—
CDF-transform
Mar
+0.73
-0.54 to +2.27
7/24
0.8116
1.0000
1.0000
-0.31
—
CDF-transform
Apr
+0.65
+0.12 to +1.30
9/24
0.9851
1.0000
1.0000
+0.58
—
CDF-transform
May
+0.22
-0.19 to +0.63
7/24
0.8436
1.0000
1.0000
+0.34
—
CDF-transform
FMAM
+0.56
-0.11 to +1.19
6/24
0.9398
1.0000
1.0000
+0.76
—
MVS with all-zero guard (variant)
Feb
+0.00
+0.00 to +0.00
0/24
1.0000
1.0000
— (variant)
+0.00
—
MVS with all-zero guard (variant)
Mar
+0.00
+0.00 to +0.00
0/24
1.0000
1.0000
— (variant)
+0.00
—
MVS with all-zero guard (variant)
Apr
+0.00
+0.00 to +0.00
0/24
1.0000
1.0000
— (variant)
+0.00
—
MVS with all-zero guard (variant)
May
+0.00
+0.00 to +0.00
0/24
1.0000
1.0000
— (variant)
+0.00
—
MVS with all-zero guard (variant)
FMAM
+0.00
+0.00 to +0.00
0/24
1.0000
1.0000
— (variant)
+0.00
—
Screening statistics, RPS (no blend) (method minus Mean-Variance Scaling; negative favours the method)
Method
Target
Δ RPS (no blend) 1993–2016
95% interval
Years better
p (one-sided)
Holm p (method)
Holm p (all 60)
Δ 2017–2025
Screening
Linear Scaling
Feb
-0.0198
-0.1116 to +0.0684
13/24
0.3361
1.0000
1.0000
+0.1508
—
Linear Scaling
Mar
-0.0257
-0.0693 to +0.0147
12/24
0.1290
0.6450
1.0000
-0.0022
—
Linear Scaling
Apr
-0.0005
-0.0104 to +0.0081
11/24
0.4579
1.0000
1.0000
+0.0064
—
Linear Scaling
May
-0.0010
-0.0114 to +0.0087
11/24
0.4220
1.0000
1.0000
+0.0129
—
Linear Scaling
FMAM
-0.0009
-0.0060 to +0.0038
10/24
0.3737
1.0000
1.0000
+0.0023
—
Variance Scaling (unbounded)
Feb
-0.0045
-0.0090 to +0.0000
16/24
0.0325
0.1300
1.0000
-0.0074
—
Variance Scaling (unbounded)
Mar
-0.0034
-0.0056 to -0.0014
17/24
0.0017
0.0085
0.0898
-0.0045
✓
Variance Scaling (unbounded)
Apr
-0.0020
-0.0043 to +0.0002
12/24
0.0562
0.1685
1.0000
-0.0005
—
Variance Scaling (unbounded)
May
-0.0002
-0.0007 to +0.0003
11/24
0.2748
0.2828
1.0000
+0.0005
—
Variance Scaling (unbounded)
FMAM
-0.0006
-0.0015 to +0.0003
12/24
0.1414
0.2828
1.0000
+0.0005
—
Square-root-space Mean-Variance Scaling
Feb
-0.0771
-0.1090 to -0.0471
20/24
0.0000
0.0001
0.0009
-0.0362
✓✓
Square-root-space Mean-Variance Scaling
Mar
-0.0448
-0.0642 to -0.0267
19/24
0.0001
0.0002
0.0035
-0.0379
✓✓
Square-root-space Mean-Variance Scaling
Apr
-0.0026
-0.0050 to -0.0000
18/24
0.0294
0.0882
1.0000
-0.0049
—
Square-root-space Mean-Variance Scaling
May
-0.0037
-0.0091 to +0.0012
10/24
0.0921
0.1841
1.0000
+0.0054
—
Square-root-space Mean-Variance Scaling
FMAM
-0.0008
-0.0027 to +0.0010
13/24
0.1967
0.1967
1.0000
-0.0018
—
Power Transformation
Feb
-0.0674
-0.1032 to -0.0332
18/24
0.0003
0.0013
0.0185
-0.0226
✓✓
Power Transformation
Mar
-0.0393
-0.0577 to -0.0208
19/24
0.0002
0.0012
0.0137
-0.0352
✓✓
Power Transformation
Apr
-0.0001
-0.0066 to +0.0067
14/24
0.4870
0.8274
1.0000
-0.0088
—
Power Transformation
May
-0.0037
-0.0071 to -0.0005
16/24
0.0199
0.0598
0.9965
-0.0022
—
Power Transformation
FMAM
-0.0004
-0.0037 to +0.0030
11/24
0.4137
0.8274
1.0000
-0.0024
—
Delta Change
Feb
-0.0431
-0.1080 to +0.0226
15/24
0.1116
0.5580
1.0000
+0.0791
—
Delta Change
Mar
-0.0068
-0.0413 to +0.0268
13/24
0.3507
1.0000
1.0000
-0.0298
—
Delta Change
Apr
+0.0031
-0.0076 to +0.0137
9/24
0.7117
1.0000
1.0000
-0.0022
—
Delta Change
May
+0.0010
-0.0061 to +0.0081
14/24
0.6077
1.0000
1.0000
-0.0040
—
Delta Change
FMAM
+0.0010
-0.0076 to +0.0105
13/24
0.5824
1.0000
1.0000
+0.0086
—
Local Intensity Scaling
Feb
-0.0166
-0.1094 to +0.0724
13/24
0.3619
1.0000
1.0000
+0.1529
—
Local Intensity Scaling
Mar
-0.0257
-0.0716 to +0.0165
12/24
0.1400
0.6998
1.0000
-0.0050
—
Local Intensity Scaling
Apr
-0.0006
-0.0105 to +0.0080
11/24
0.4522
1.0000
1.0000
+0.0066
—
Local Intensity Scaling
May
-0.0007
-0.0112 to +0.0091
11/24
0.4476
1.0000
1.0000
+0.0131
—
Local Intensity Scaling
FMAM
-0.0009
-0.0060 to +0.0036
10/24
0.3624
1.0000
1.0000
+0.0021
—
Empirical Quantile Mapping
Feb
-0.0795
-0.1227 to -0.0379
17/24
0.0007
0.0036
0.0386
-0.0101
✓✓
Empirical Quantile Mapping
Mar
-0.0391
-0.0659 to -0.0135
17/24
0.0047
0.0189
0.2452
-0.0316
✓
Empirical Quantile Mapping
Apr
+0.0037
-0.0023 to +0.0097
9/24
0.8770
1.0000
1.0000
-0.0015
—
Empirical Quantile Mapping
May
+0.0017
-0.0047 to +0.0080
9/24
0.6966
1.0000
1.0000
+0.0041
—
Empirical Quantile Mapping
FMAM
+0.0049
+0.0014 to +0.0083
6/24
0.9924
1.0000
1.0000
+0.0061
—
Gamma Quantile Mapping
Feb
-0.0587
-0.0783 to -0.0395
21/24
0.0000
0.0000
0.0003
-0.0331
✓✓
Gamma Quantile Mapping
Mar
-0.0344
-0.0532 to -0.0164
16/24
0.0007
0.0026
0.0363
-0.0378
✓✓
Gamma Quantile Mapping
Apr
-0.0021
-0.0060 to +0.0022
17/24
0.1618
0.3236
1.0000
-0.0072
—
Gamma Quantile Mapping
May
-0.0034
-0.0071 to -0.0001
12/24
0.0389
0.1167
1.0000
+0.0024
—
Gamma Quantile Mapping
FMAM
-0.0007
-0.0036 to +0.0024
13/24
0.3359
0.3359
1.0000
-0.0027
—
Detrended Quantile Mapping
Feb
-0.0422
-0.1112 to +0.0264
15/24
0.1266
0.6331
1.0000
+0.0994
—
Detrended Quantile Mapping
Mar
-0.0086
-0.0436 to +0.0253
10/24
0.3186
1.0000
1.0000
-0.0283
—
Detrended Quantile Mapping
Apr
+0.0125
+0.0025 to +0.0237
9/24
0.9834
1.0000
1.0000
+0.0070
—
Detrended Quantile Mapping
May
+0.0043
-0.0055 to +0.0133
10/24
0.8024
1.0000
1.0000
+0.0042
—
Detrended Quantile Mapping
FMAM
+0.0042
-0.0038 to +0.0122
9/24
0.8285
1.0000
1.0000
+0.0083
—
Quantile Delta Mapping
Feb
-0.0736
-0.1341 to -0.0160
16/24
0.0121
0.0604
0.6163
+0.0341
—
Quantile Delta Mapping
Mar
-0.0165
-0.0529 to +0.0172
11/24
0.1901
0.7604
1.0000
-0.0204
—
Quantile Delta Mapping
Apr
+0.0184
+0.0040 to +0.0349
9/24
0.9850
1.0000
1.0000
+0.0095
—
Quantile Delta Mapping
May
+0.0029
-0.0074 to +0.0123
8/24
0.7060
1.0000
1.0000
+0.0057
—
Quantile Delta Mapping
FMAM
+0.0048
-0.0045 to +0.0138
8/24
0.8395
1.0000
1.0000
+0.0100
—
Scaled Distribution Mapping
Feb
+0.0130
-0.0902 to +0.1144
11/24
0.5964
1.0000
1.0000
+0.2076
—
Scaled Distribution Mapping
Mar
+0.0174
-0.0435 to +0.0728
10/24
0.7158
1.0000
1.0000
+0.0145
—
Scaled Distribution Mapping
Apr
+0.0198
+0.0085 to +0.0315
4/24
0.9990
1.0000
1.0000
+0.0171
—
Scaled Distribution Mapping
May
+0.0071
-0.0027 to +0.0167
10/24
0.9139
1.0000
1.0000
+0.0116
—
Scaled Distribution Mapping
FMAM
+0.0065
-0.0032 to +0.0166
10/24
0.8849
1.0000
1.0000
+0.0128
—
CDF-transform
Feb
-0.0134
-0.0921 to +0.0641
13/24
0.3701
1.0000
1.0000
+0.1167
—
CDF-transform
Mar
-0.0108
-0.0431 to +0.0239
13/24
0.2763
1.0000
1.0000
-0.0184
—
CDF-transform
Apr
+0.0145
+0.0036 to +0.0274
8/24
0.9898
1.0000
1.0000
+0.0133
—
CDF-transform
May
+0.0030
-0.0062 to +0.0117
9/24
0.7323
1.0000
1.0000
+0.0093
—
CDF-transform
FMAM
+0.0048
-0.0031 to +0.0125
7/24
0.8694
1.0000
1.0000
+0.0100
—
MVS with all-zero guard (variant)
Feb
+0.0000
+0.0000 to +0.0000
0/24
1.0000
1.0000
— (variant)
+0.0000
—
MVS with all-zero guard (variant)
Mar
+0.0000
+0.0000 to +0.0000
0/24
1.0000
1.0000
— (variant)
+0.0000
—
MVS with all-zero guard (variant)
Apr
+0.0000
+0.0000 to +0.0000
0/24
1.0000
1.0000
— (variant)
+0.0000
—
MVS with all-zero guard (variant)
May
+0.0000
+0.0000 to +0.0000
0/24
1.0000
1.0000
— (variant)
+0.0000
—
MVS with all-zero guard (variant)
FMAM
+0.0000
+0.0000 to +0.0000
0/24
1.0000
1.0000
— (variant)
+0.0000
—
How often limits, caps and fallbacks act
How often limits, caps and fallbacks act, leave-one-year-out 1993–2016 (mean over folds)
Method
Target
Activated (share of the corrected area, or of members / cells for events)
Linear Scaling
Feb
mean fallback: 0.6% of the area
Mean-Variance Scaling (operational)
Feb
sd fallback: 3.9% of the area; ratio lower limit: 20.2% of the area; ratio upper limit: 9.1% of the area; clipped at zero: 2.7%
Mean-Variance Scaling (operational)
Mar
ratio lower limit: 2.5% of the area; ratio upper limit: 9.1% of the area; clipped at zero: 1.3%
Mean-Variance Scaling (operational)
Apr
ratio lower limit: 0.2% of the area; ratio upper limit: 6.1% of the area; clipped at zero: 0.2%
Mean-Variance Scaling (operational)
May
ratio lower limit: 0.1% of the area; ratio upper limit: 6.2% of the area; clipped at zero: 0.4%
Mean-Variance Scaling (operational)
FMAM
ratio lower limit: 0.0% of the area; ratio upper limit: 6.6% of the area; clipped at zero: 0.0%
Variance Scaling (unbounded)
Feb
sd fallback: 3.9% of the area; clipped at zero: 1.8%
Variance Scaling (unbounded)
Mar
clipped at zero: 0.8%
Variance Scaling (unbounded)
Apr
clipped at zero: 0.2%
Variance Scaling (unbounded)
May
clipped at zero: 0.5%
Variance Scaling (unbounded)
FMAM
clipped at zero: 0.0%
Square-root-space Mean-Variance Scaling
Feb
ratio lower limit: 23.9% of the area; clipped at zero: 0.5%
Square-root-space Mean-Variance Scaling
Mar
ratio lower limit: 0.3% of the area; ratio upper limit: 0.2% of the area; clipped at zero: 0.4%
Square-root-space Mean-Variance Scaling
Apr
ratio lower limit: 0.1% of the area; ratio upper limit: 0.1% of the area; clipped at zero: 0.1%
Square-root-space Mean-Variance Scaling
May
ratio lower limit: 0.0% of the area; ratio upper limit: 0.1% of the area; clipped at zero: 0.0%
Square-root-space Mean-Variance Scaling
FMAM
ratio upper limit: 0.1% of the area
Power Transformation
Feb
b at bound: 16.6% of the area
Delta Change
Feb
mean fallback: 0.6% of the area; ratio capped: 3.3%
Delta Change
Mar
ratio capped: 0.1%
Local Intensity Scaling
Feb
always wet: 83.0% of the area; never wet: 2.8% of the area
Local Intensity Scaling
Mar
always wet: 88.6% of the area
Local Intensity Scaling
Apr
always wet: 85.7% of the area
Local Intensity Scaling
May
always wet: 90.6% of the area
Local Intensity Scaling
FMAM
always wet: 100.0% of the area
Empirical Quantile Mapping
Feb
model has dry: 100.0% of the area; obs has dry: 17.0% of the area; extrapolated: 0.2%
Empirical Quantile Mapping
Mar
model has dry: 97.8% of the area; obs has dry: 11.4% of the area; extrapolated: 0.2%
Empirical Quantile Mapping
Apr
model has dry: 60.2% of the area; obs has dry: 14.3% of the area; extrapolated: 0.2%
Empirical Quantile Mapping
May
model has dry: 23.4% of the area; obs has dry: 9.4% of the area; extrapolated: 0.3%
Empirical Quantile Mapping
FMAM
model has dry: 5.8% of the area; extrapolated: 0.3%
Gamma Quantile Mapping
Feb
gamma fallback: 3.6% of the area; model has dry: 100.0% of the area; obs has dry: 17.0% of the area
Gamma Quantile Mapping
Mar
gamma fallback: 0.1% of the area; model has dry: 97.8% of the area; obs has dry: 11.4% of the area
Gamma Quantile Mapping
Apr
model has dry: 60.2% of the area; obs has dry: 14.3% of the area
Gamma Quantile Mapping
May
model has dry: 23.4% of the area; obs has dry: 9.4% of the area
Gamma Quantile Mapping
FMAM
model has dry: 5.8% of the area
Detrended Quantile Mapping
Feb
model has dry: 100.0% of the area; obs has dry: 17.0% of the area; ratio capped: 3.3%; extrapolated: 0.1%
Detrended Quantile Mapping
Mar
model has dry: 97.8% of the area; obs has dry: 11.4% of the area; ratio capped: 0.1%; extrapolated: 0.1%
Detrended Quantile Mapping
Apr
model has dry: 60.2% of the area; obs has dry: 14.3% of the area; extrapolated: 0.2%
Detrended Quantile Mapping
May
model has dry: 23.4% of the area; obs has dry: 9.4% of the area; extrapolated: 0.3%
Detrended Quantile Mapping
FMAM
model has dry: 5.8% of the area; extrapolated: 0.3%
Quantile Delta Mapping
Feb
model has dry: 100.0% of the area; obs has dry: 17.0% of the area; low denominator: 49.4%; ratio capped: 0.7%
Quantile Delta Mapping
Mar
model has dry: 97.8% of the area; obs has dry: 11.4% of the area; low denominator: 19.9%; ratio capped: 0.2%
Quantile Delta Mapping
Apr
model has dry: 60.2% of the area; obs has dry: 14.3% of the area; low denominator: 3.5%; ratio capped: 0.1%
Quantile Delta Mapping
May
model has dry: 23.4% of the area; obs has dry: 9.4% of the area; low denominator: 2.3%; ratio capped: 0.0%
Quantile Delta Mapping
FMAM
model has dry: 5.8% of the area
Scaled Distribution Mapping
Feb
gamma fallback: 6.3% of the area; linear scaling fallback: 17.0%
Scaled Distribution Mapping
Mar
gamma fallback: 0.1% of the area; linear scaling fallback: 0.2%
CDF-transform
Feb
mean fallback: 0.6% of the area; at forecast range edge: 0.5%
CDF-transform
Mar
at forecast range edge: 1.0%
CDF-transform
Apr
at forecast range edge: 2.3%
CDF-transform
May
at forecast range edge: 4.9%
CDF-transform
FMAM
at forecast range edge: 2.3%
MVS with all-zero guard (variant)
Feb
sd fallback: 3.9% of the area; ratio lower limit: 20.2% of the area; ratio upper limit: 9.1% of the area; clipped at zero: 2.7%
MVS with all-zero guard (variant)
Mar
ratio lower limit: 2.5% of the area; ratio upper limit: 9.1% of the area; clipped at zero: 1.3%
MVS with all-zero guard (variant)
Apr
ratio lower limit: 0.2% of the area; ratio upper limit: 6.1% of the area; clipped at zero: 0.2%
MVS with all-zero guard (variant)
May
ratio lower limit: 0.1% of the area; ratio upper limit: 6.2% of the area; clipped at zero: 0.4%
MVS with all-zero guard (variant)
FMAM
ratio lower limit: 0.0% of the area; ratio upper limit: 6.6% of the area; clipped at zero: 0.0%
Where the amount differences come from: cells grouped by their training-year climate
Each cell is grouped by its CHIRPS totals in the fold’s training years only: every year exactly 0 mm; every year ≤ 1 mm (not all 0); some years dry and some wet; never dry. Contributions are area-weighted CRPS differences from Mean-Variance Scaling (mm; negative favours the method) and add up to the national difference. Leave-one-year-out 1993–2016, All Ethiopia.
Feb: contributions to the CRPS difference from Mean-Variance Scaling (mm)
Method
Total Δ CRPS
all 0 mm 0.0% of area
all ≤ 1 mm 2.8% of area
mixed 14.2% of area
always wet 83.0% of area
Linear Scaling
+1.060
+0.000
+0.001
+0.019
+1.041
Variance Scaling (unbounded)
-0.039
+0.000
-0.001
+0.000
-0.039
Square-root-space Mean-Variance Scaling
-0.275
+0.000
-0.001
-0.009
-0.265
Power Transformation
+0.044
+0.000
+0.000
+0.004
+0.040
Delta Change
+0.136
+0.000
+0.000
+0.007
+0.129
Local Intensity Scaling
+0.821
+0.000
+0.003
+0.021
+0.797
Empirical Quantile Mapping
-0.196
+0.000
+0.003
+0.020
-0.219
Gamma Quantile Mapping
-0.092
+0.000
+0.003
+0.018
-0.113
Detrended Quantile Mapping
+0.256
+0.000
+0.003
+0.021
+0.232
Quantile Delta Mapping
-0.077
+0.000
+0.003
+0.019
-0.099
Scaled Distribution Mapping
+1.245
+0.000
+0.001
+0.027
+1.217
CDF-transform
+1.069
+0.000
+0.002
+0.040
+1.027
MVS with all-zero guard (variant)
+0.000
+0.000
+0.000
+0.000
+0.000
Mar: contributions to the CRPS difference from Mean-Variance Scaling (mm)
Method
Total Δ CRPS
all 0 mm 0.0% of area
all ≤ 1 mm 0.0% of area
mixed 11.4% of area
always wet 88.6% of area
Linear Scaling
+0.784
+0.000
+0.000
-0.021
+0.805
Variance Scaling (unbounded)
-0.070
+0.000
+0.000
+0.002
-0.072
Square-root-space Mean-Variance Scaling
-0.490
+0.000
+0.000
-0.025
-0.465
Power Transformation
-0.485
+0.000
+0.000
-0.023
-0.462
Delta Change
+0.360
+0.000
+0.000
-0.012
+0.372
Local Intensity Scaling
+0.643
+0.000
+0.000
-0.017
+0.660
Empirical Quantile Mapping
-0.326
+0.000
+0.000
-0.015
-0.311
Gamma Quantile Mapping
-0.452
+0.000
+0.000
-0.015
-0.437
Detrended Quantile Mapping
+0.611
+0.000
+0.000
-0.003
+0.614
Quantile Delta Mapping
+0.797
+0.000
+0.000
-0.007
+0.804
Scaled Distribution Mapping
+1.142
+0.000
+0.000
+0.000
+1.142
CDF-transform
+0.828
+0.000
+0.000
-0.004
+0.832
MVS with all-zero guard (variant)
+0.000
+0.000
+0.000
+0.000
+0.000
Apr: contributions to the CRPS difference from Mean-Variance Scaling (mm)
Method
Total Δ CRPS
all 0 mm 0.0% of area
all ≤ 1 mm 0.0% of area
mixed 14.3% of area
always wet 85.7% of area
Linear Scaling
+0.383
+0.000
+0.000
+0.061
+0.322
Variance Scaling (unbounded)
-0.018
+0.000
+0.000
-0.008
-0.010
Square-root-space Mean-Variance Scaling
-0.081
+0.000
+0.000
-0.026
-0.055
Power Transformation
+0.002
+0.000
+0.000
-0.032
+0.034
Delta Change
+0.120
+0.000
+0.000
-0.017
+0.137
Local Intensity Scaling
+0.345
+0.000
+0.000
+0.062
+0.284
Empirical Quantile Mapping
+0.282
+0.000
+0.000
-0.019
+0.301
Gamma Quantile Mapping
-0.076
+0.000
+0.000
-0.041
-0.035
Detrended Quantile Mapping
+0.595
+0.000
+0.000
+0.033
+0.562
Quantile Delta Mapping
+0.851
+0.000
+0.000
+0.074
+0.777
Scaled Distribution Mapping
+0.958
+0.000
+0.000
+0.100
+0.858
CDF-transform
+0.694
+0.000
+0.000
+0.061
+0.632
MVS with all-zero guard (variant)
+0.000
+0.000
+0.000
+0.000
+0.000
May: contributions to the CRPS difference from Mean-Variance Scaling (mm)
Method
Total Δ CRPS
all 0 mm 0.0% of area
all ≤ 1 mm 0.0% of area
mixed 9.4% of area
always wet 90.6% of area
Linear Scaling
+0.091
+0.000
+0.000
-0.032
+0.123
Variance Scaling (unbounded)
+0.001
+0.000
+0.000
-0.001
+0.002
Square-root-space Mean-Variance Scaling
-0.127
+0.000
+0.000
-0.039
-0.088
Power Transformation
-0.146
+0.000
+0.000
-0.055
-0.091
Delta Change
-0.076
+0.000
+0.000
-0.040
-0.036
Local Intensity Scaling
+0.088
+0.000
+0.000
-0.024
+0.112
Empirical Quantile Mapping
+0.202
+0.000
+0.000
-0.046
+0.248
Gamma Quantile Mapping
-0.103
+0.000
+0.000
-0.050
-0.053
Detrended Quantile Mapping
+0.316
+0.000
+0.000
-0.035
+0.352
Quantile Delta Mapping
+0.215
+0.000
+0.000
-0.039
+0.254
Scaled Distribution Mapping
+0.410
+0.000
+0.000
-0.019
+0.429
CDF-transform
+0.239
+0.000
+0.000
-0.037
+0.276
MVS with all-zero guard (variant)
+0.000
+0.000
+0.000
+0.000
+0.000
FMAM: contributions to the CRPS difference from Mean-Variance Scaling (mm)
Method
Total Δ CRPS
all 0 mm 0.0% of area
all ≤ 1 mm 0.0% of area
mixed 0.0% of area
always wet 100.0% of area
Linear Scaling
+0.270
+0.000
+0.000
+0.000
+0.270
Variance Scaling (unbounded)
-0.006
+0.000
+0.000
+0.000
-0.006
Square-root-space Mean-Variance Scaling
-0.036
+0.000
+0.000
+0.000
-0.036
Power Transformation
+0.033
+0.000
+0.000
+0.000
+0.033
Delta Change
-0.205
+0.000
+0.000
+0.000
-0.205
Local Intensity Scaling
+0.245
+0.000
+0.000
+0.000
+0.245
Empirical Quantile Mapping
+0.708
+0.000
+0.000
+0.000
+0.708
Gamma Quantile Mapping
-0.005
+0.000
+0.000
+0.000
-0.005
Detrended Quantile Mapping
+0.600
+0.000
+0.000
+0.000
+0.600
Quantile Delta Mapping
+0.567
+0.000
+0.000
+0.000
+0.567
Scaled Distribution Mapping
+0.796
+0.000
+0.000
+0.000
+0.796
CDF-transform
+0.582
+0.000
+0.000
+0.000
+0.582
MVS with all-zero guard (variant)
+0.000
+0.000
+0.000
+0.000
+0.000
Confirmation: full pipeline and method selection
The screening isolates the amount correction. The confirmation evaluates what the site publishes: each method’s
corrected members go through the full probability pipeline (tercile counts, smoothing and the climatology blend), with every fit and
the blend weight inside the cross-validation folds. Two selection-aware procedures then choose a method for each
left-out year using only the other training years — SEL-P by the lowest inner blended RPS (probabilities),
SEL-A by the lowest inner CRPS (amounts) — so their scores include the effect of choosing among the
14 declared methods. ✓ = better than Mean-Variance Scaling with Holm-adjusted p < 0.05 (methods: across all
methods and targets; SEL-P/SEL-A: across the targets) and not worse over 2017–2025. Scope: All Ethiopia.
FMAM season through the full pipeline (outer leave-one-year-out 1993–2016; test years exploratory)
Method
Blended RPSS 1993–2016
Blended RPSS 2017–2025
BSS below 1993–2016
BSS above 1993–2016
Amount CRPSS 1993–2016
Amount CRPSS 2017–2025
Mean blend weight λ
Mean-Variance Scaling (operational)
+0.032
+0.017
+0.022
+0.043
+0.025
+0.016
0.26
Linear Scaling
+0.035
+0.015
+0.027
+0.042
+0.019
+0.020
0.31
Variance Scaling (unbounded)
+0.033
+0.016
+0.023
+0.043
+0.025
+0.015
0.25
Square-root-space Mean-Variance Scaling
+0.033
+0.019
+0.023
+0.044
+0.025
+0.018
0.25
Power Transformation
+0.032
+0.020
+0.020
+0.044
+0.024
+0.017
0.25
Delta Change
+0.029
+0.009
+0.017
+0.041
+0.029
+0.010
0.35
Local Intensity Scaling
+0.035
+0.016
+0.027
+0.043
+0.020
+0.020
0.31
Empirical Quantile Mapping
+0.021
+0.007
+0.012
+0.029
+0.011
+0.005
0.35
Gamma Quantile Mapping
+0.033
+0.021
+0.022
+0.044
+0.025
+0.019
0.25
Detrended Quantile Mapping
+0.029
+0.013
+0.018
+0.040
+0.013
+0.004
0.42
Quantile Delta Mapping
+0.031
+0.012
+0.019
+0.042
+0.013
+0.001
0.43
Scaled Distribution Mapping
+0.032
+0.011
+0.019
+0.044
+0.009
-0.012
0.46
CDF-transform
+0.030
+0.012
+0.021
+0.040
+0.013
+0.003
0.44
MVS with all-zero guard (variant)
+0.032
+0.017
+0.022
+0.043
+0.025
+0.016
0.26
SEL-P
+0.035
+0.016
+0.027
+0.043
+0.020
+0.020
—
SEL-A
+0.027
+0.009
+0.017
+0.037
+0.020
+0.010
—
Blended tercile RPSS by target, outer leave-one-year-out 1993–2016
Method
Feb
Mar
Apr
May
FMAM
Mean-Variance Scaling (operational)
+0.027
+0.002
+0.001
+0.028
+0.032
Linear Scaling
+0.041
+0.003
+0.001
+0.029
+0.035
Variance Scaling (unbounded)
+0.029
+0.003
+0.002
+0.028
+0.033
Square-root-space Mean-Variance Scaling
+0.073
+0.006
-0.000
+0.031
+0.033
Power Transformation
+0.062
+0.004
-0.003
+0.031
+0.032
Delta Change
+0.084
-0.008
-0.006
+0.020
+0.029
Local Intensity Scaling
+0.040
+0.002
+0.002
+0.028
+0.035
Empirical Quantile Mapping
+0.074
-0.003
-0.006
+0.018
+0.021
Gamma Quantile Mapping
+0.054
+0.003
-0.001
+0.031
+0.033
Detrended Quantile Mapping
+0.091
-0.005
-0.006
+0.019
+0.029
Quantile Delta Mapping
+0.082
-0.003
-0.007
+0.022
+0.031
Scaled Distribution Mapping
+0.047
-0.002
-0.004
+0.020
+0.032
CDF-transform
+0.088
+0.003
-0.005
+0.022
+0.030
MVS with all-zero guard (variant)
+0.027
+0.002
+0.001
+0.028
+0.032
SEL-P
+0.073
+0.004
+0.001
+0.031
+0.035
SEL-A
+0.073
+0.001
-0.002
+0.031
+0.027
Amount CRPSS by target in the confirmation design, and the selection-aware procedures
Amount CRPSS by target, outer leave-one-year-out 1993–2016
Method
Feb
Mar
Apr
May
FMAM
Mean-Variance Scaling (operational)
+0.070
-0.044
-0.016
+0.007
+0.025
Linear Scaling
-0.084
-0.083
-0.030
+0.004
+0.019
Variance Scaling (unbounded)
+0.076
-0.040
-0.016
+0.007
+0.025
Square-root-space Mean-Variance Scaling
+0.110
-0.019
-0.014
+0.011
+0.025
Power Transformation
+0.064
-0.020
-0.017
+0.012
+0.024
Delta Change
+0.051
-0.062
-0.021
+0.010
+0.029
Local Intensity Scaling
-0.049
-0.076
-0.029
+0.004
+0.020
Empirical Quantile Mapping
+0.099
-0.028
-0.026
+0.000
+0.011
Gamma Quantile Mapping
+0.084
-0.021
-0.014
+0.011
+0.025
Detrended Quantile Mapping
+0.033
-0.074
-0.037
-0.004
+0.013
Quantile Delta Mapping
+0.082
-0.084
-0.046
-0.000
+0.013
Scaled Distribution Mapping
-0.111
-0.101
-0.050
-0.007
+0.009
CDF-transform
-0.085
-0.085
-0.041
-0.001
+0.013
MVS with all-zero guard (variant)
+0.070
-0.044
-0.016
+0.007
+0.025
SEL-P
-0.076
-0.047
-0.030
+0.011
+0.020
SEL-A
+0.110 ✓
-0.030
-0.015
+0.012
+0.020
Selection-aware procedures against the operational method (Δ: RPS for SEL-P, CRPS for SEL-A; negative favours the procedure)
The operational correction limits the spread ratio r = σobs/σmodel to 0.5–2. This study runs the same
screening and confirmation for that correction with wider limits (1/3–3, 1/4–4) and none, all with the same fallback (r = 1 where
the model spread is below 1 mm), to see whether the limits are worth changing. ✓ = better than the operational limits with
Holm-adjusted p < 0.05 across the 3 alternatives × 5 targets and not worse over the test years.
Run at commit fb7425f.
Confirmed better than the operational limits — published (blended) probabilities: none;
rainfall amounts: MVS, ratio limits 1/3-3 (Feb), MVS, ratio limits 1/4-4 (Feb, Mar) and Variance Scaling (unbounded) (Feb, Mar).
Blended tercile RPSS through the full pipeline, outer leave-one-year-out 1993–2016
Method
Feb
Mar
Apr
May
FMAM
Mean-Variance Scaling (operational, 0.5–2)
+0.027
+0.002
+0.001
+0.028
+0.032
MVS, ratio limits 1/3-3
+0.029
+0.002
+0.001
+0.028
+0.033
MVS, ratio limits 1/4-4
+0.029
+0.003
+0.002
+0.028
+0.033
Variance Scaling (unbounded)
+0.029
+0.003
+0.002
+0.028
+0.033
Amount CRPSS, leave-one-year-out 1993–2016
Method
Feb
Mar
Apr
May
FMAM
Mean-Variance Scaling (operational, 0.5–2)
+0.070
-0.044
-0.016
+0.007
+0.025
MVS, ratio limits 1/3-3
+0.076 ✓
-0.041
-0.016
+0.007
+0.025
MVS, ratio limits 1/4-4
+0.076 ✓
-0.040 ✓
-0.016
+0.007
+0.025
Variance Scaling (unbounded)
+0.076 ✓
-0.040 ✓
-0.016
+0.007
+0.025
Where the operational limits act
Share of the corrected area, mean over the leave-one-year-out folds, 1993–2016
Target
Lower limit active (r would be < 0.5)
Upper limit active (r would be > 2)
Spread–error, operational
Spread–error, no limits
Feb
20%
9%
1.02
1.05
Mar
2%
9%
0.93
0.95
Apr
0%
6%
0.95
0.96
May
0%
6%
0.96
0.97
FMAM
0%
7%
0.98
0.99
Independent validation seasons: every method scored on the seasons after the benchmark (one season each; the suggestions need at least three)
2026: blended tercile RPSS against CHIRPS
Method
Feb
Mar
Apr
May
FMAM
Mean-Variance Scaling (operational)
-0.037
+0.049
+0.010
+0.028
-0.026
CDF-transform
-0.127
+0.131
+0.007
+0.026
-0.037
Delta Change
-0.115
+0.068
+0.012
+0.020
-0.025
Detrended Quantile Mapping
-0.143
+0.105
+0.010
+0.025
-0.027
Empirical Quantile Mapping
-0.099
+0.104
+0.008
+0.021
-0.032
Gamma Quantile Mapping
-0.133
+0.104
+0.014
+0.027
-0.018
Local Intensity Scaling
-0.037
+0.024
+0.001
+0.023
-0.042
Linear Scaling
-0.034
+0.025
+0.001
+0.023
-0.042
MVS with all-zero guard (variant)
-0.037
+0.049
+0.010
+0.028
-0.026
Power Transformation
-0.111
+0.126
+0.017
+0.028
-0.015
Quantile Delta Mapping
-0.117
+0.137
+0.007
+0.027
-0.025
Scaled Distribution Mapping
-0.041
+0.022
+0.004
+0.029
-0.027
Square-root-space Mean-Variance Scaling
-0.090
+0.133
+0.012
+0.028
-0.023
Variance Scaling (unbounded)
-0.034
+0.051
+0.010
+0.029
-0.032
2026: amount CRPSS against CHIRPS
Method
Feb
Mar
Apr
May
FMAM
Mean-Variance Scaling (operational)
-0.209
+0.101
+0.014
+0.032
-0.066
CDF-transform
-0.615
+0.198
-0.004
+0.019
-0.099
Delta Change
-0.326
+0.187
+0.037
+0.018
-0.067
Detrended Quantile Mapping
-0.397
+0.204
+0.017
+0.020
-0.083
Empirical Quantile Mapping
-0.164
+0.131
+0.018
+0.018
-0.078
Gamma Quantile Mapping
-0.263
+0.140
+0.020
+0.013
-0.059
Local Intensity Scaling
-0.477
+0.136
-0.054
-0.025
-0.103
Linear Scaling
-0.537
+0.137
-0.058
-0.027
-0.104
MVS with all-zero guard (variant)
-0.209
+0.101
+0.014
+0.032
-0.066
Power Transformation
-0.300
+0.157
+0.017
+0.025
-0.061
Quantile Delta Mapping
-0.410
+0.233
-0.005
+0.019
-0.086
Scaled Distribution Mapping
-0.445
+0.097
-0.012
+0.030
-0.086
Square-root-space Mean-Variance Scaling
-0.210
+0.135
+0.014
+0.017
-0.064
Variance Scaling (unbounded)
-0.199
+0.101
+0.010
+0.032
-0.072
Figures
Figures show the national aggregate (All Ethiopia) or per-cell maps of the whole country, whatever region is selected for the tables.
Interpretation — national aggregate (All Ethiopia)
All tested corrections improve national FMAM rainfall-amount CRPSS over raw ECMWF in 1993–2016 (raw -0.696; corrected +0.009 to +0.029). Performance varies for monthly tercile probabilities: 0 method–month combinations score below the raw model on RPSS.
Accounting for the whole search. With Holm adjustment across all 60 method–target comparisons, the amount (CRPS) screening passes are none, and the tercile (RPS) passes are Square-root-space Mean-Variance Scaling (Feb, Mar), Power Transformation (Feb, Mar), Empirical Quantile Mapping (Feb) and Gamma Quantile Mapping (Feb, Mar). Within-method passes that do not survive this check: Empirical Quantile Mapping Mar, Gamma Quantile Mapping Mar, Square-root-space Mean-Variance Scaling Feb, Square-root-space Mean-Variance Scaling Mar, Variance Scaling (unbounded) Feb and Variance Scaling (unbounded) Mar.
Empirical Quantile Mapping reproduces the CHIRPS distribution and, with the dry policy, its dry share (totals ≤ 1 mm: Feb 13.0% vs CHIRPS 12.9%); it passes the screening for Feb and Mar, but its FMAM amount skill is lower than Mean-Variance Scaling (+0.011 vs +0.025). A possible explanation is sampling noise in an empirical quantile function built from 23 CHIRPS values per fold; the results do not isolate it.
Scaled Distribution Mapping follows the published algorithm (Switanek et al. 2017, steps 1–7; checked numerically against an independent implementation of the steps). Where the model is drier than CHIRPS it cannot add rain: in Feb 51% of model members exceed 1 mm against 87% of CHIRPS years, and SDM, by design, keeps the model’s number of rain members, so its corrected dry share is 50% (CHIRPS 13%).
Delta Change has a high FMAM CRPSS in 1993–2016 (+0.029) but the gain does not pass the screening (Holm p = 1.00), it is lower in 2017–2025 (+0.010 vs +0.016), its ensemble is too wide (spread–error 1.04) and its tercile skill is low. It is the CHIRPS climatology rescaled by the forecast’s mean: historical scenarios, not corrected members.
The methods that use the forecast’s own distribution (Detrended Quantile Mapping, Quantile Delta Mapping, Scaled Distribution Mapping, CDF-transform) score lower on FMAM terciles (+0.019 to +0.024 vs +0.034) and none passes the season screening. A possible explanation is that the distribution of a single forecast’s 25–51 members is a noisy estimate of the “future” distribution these methods were designed for; the results do not isolate the cause. Where model quantiles are dry, QDM falls back to the CHIRPS quantile (members affected: Feb 49% and Mar 20%), so its quantile changes are only partly preserved.
May remains hard: every method has negative amount skill over 2017–2025.
No tested method demonstrates a statistically significant improvement over Mean-Variance Scaling for the published tercile probabilities under this validation protocol, although several have slightly higher point estimates. Choosing the method each year from training-only scores, the probability procedure (SEL-P) scores FMAM blended RPSS +0.035 against +0.032, confirmed for none. Amounts: the amount procedure (SEL-A) scores CRPSS +0.020 against +0.025, confirmed for Feb; fixed methods confirmed against the family of all declared methods and targets: none.
The climatology blend narrows the differences. Across the methods, FMAM RPSS (1993–2016) spans 0.014 after the blend against 0.016 for the unblended screening counts. A better amount correction is trusted more by the blend: in Feb the fitted weight on climatology is 0.35 with Square-root-space Mean-Variance Scaling against 0.73 with Mean-Variance Scaling.
Choosing by training scores can backfire. For FMAM, SEL-A chose Delta Change from the 1993–2016 scores; over 2017–2025 it has a worse mean CRPS (Δ +0.345 mm, 95% interval -0.929 to +1.631 mm; better than Mean-Variance Scaling in 5 of 9 years, with the largest losses in 2020 and 2021); for Feb, SEL-P chose CDF-transform from the 1993–2016 scores; over 2017–2025 it has a worse mean RPS (Δ +0.020, 95% interval -0.013 to +0.052; better than Mean-Variance Scaling in 3 of 9 years, with the largest losses in 2021 and 2018); for Apr, SEL-P chose Local Intensity Scaling from the 1993–2016 scores; over 2017–2025 it has a worse mean RPS (Δ +0.001, 95% interval -0.001 to +0.004; better than Mean-Variance Scaling in 5 of 9 years, with the largest losses in 2020 and 2021); for May, SEL-P chose Square-root-space Mean-Variance Scaling from the 1993–2016 scores; over 2017–2025 it has a worse mean RPS (Δ +0.007, 95% interval -0.004 to +0.020; better than Mean-Variance Scaling in 3 of 9 years, with the largest losses in 2021 and 2020); for FMAM, SEL-P chose Local Intensity Scaling from the 1993–2016 scores; over 2017–2025 it has a worse mean RPS (Δ +0.001, 95% interval -0.006 to +0.005; better than Mean-Variance Scaling in 2 of 9 years, with the largest losses in 2021 and 2018). These choices fail the no-harm rule; where the interval includes 0 they do not establish a significant deterioration. A method that ranks first on the training years is not, on that alone, a replacement.
No cell of All Ethiopia has exactly 0 mm in every training year, for any target, at 0.25° with CHIRPS. The all-zero guard (a separate MVS variant, outside the declared family) therefore never acts and equals Mean-Variance Scaling: the non-zero totals that Mean-Variance Scaling gives where every training year is 0 mm (its spread ratio cannot fall below 0.5) do not arise in these data. The guard remains a documented option; a finite history of zero rainfall does not make rain impossible.
3 of the 14 interpretation statements do not hold for this cycle’s results and are not shown (each is checked against the numbers before it is displayed).
Caveats
Screening skill is from 1993–2016 leave-one-year-out (clean) and 2017–2025 (exploratory: these years were seen while the operational method was chosen).
Screening tercile scores use smoothed member counts without the climatology blend; the confirmation scores the blended product.
Two multiplicity families are shown: within one method across its targets (✓) and across all methods and targets (✓✓). The confirmation’s selection-aware procedures include the method choice in the evaluation itself.
Scores are area-weighted over many correlated cells but tested year by year, so each year counts once.
The ordinary CRPS scores the delivered ensemble; the fair CRPS is a diagnostic under a sampling interpretation that DC’s rescaled years and methods tied to the forecast mean or ranks only approximate.
Results are national aggregates unless a table says otherwise; a method can rank differently in a region (switch the tables to the regional view).
Boé, J., Terray, L., Habets, F., & Martin, E. (2007). Statistical and dynamical downscaling of the Seine basin climate for hydro-meteorological studies. International Journal of Climatology, 27, 1643–1655. doi:10.1002/joc.1602
Cannon, A. J., Sobie, S. R., & Murdock, T. Q. (2015). Bias correction of GCM precipitation by quantile mapping: how well do methods preserve changes in quantiles and extremes? Journal of Climate, 28, 6938–6959. doi:10.1175/JCLI-D-14-00754.1
Delle Monache, L., Hacker, J. P., Zhou, Y., Deng, X., & Stull, R. B. (2006). Probabilistic aspects of meteorological and ozone regional ensemble forecasts. Journal of Geophysical Research: Atmospheres, 111, D24307. doi:10.1029/2005JD006917
Ferro, C. A. T. (2014). Fair scores for ensemble forecasts. Quarterly Journal of the Royal Meteorological Society, 140, 1917–1923. doi:10.1002/qj.2270
Gudmundsson, L., Bremnes, J. B., Haugen, J. E., & Engen-Skaugen, T. (2012). Technical Note: Downscaling RCM precipitation to the station scale using statistical transformations — a comparison of methods. Hydrology and Earth System Sciences, 16, 3383–3390. doi:10.5194/hess-16-3383-2012
Hay, L. E., Wilby, R. L., & Leavesley, G. H. (2000). A comparison of delta change and downscaled GCM scenarios for three mountainous basins in the United States. JAWRA Journal of the American Water Resources Association, 36, 387–397. doi:10.1111/j.1752-1688.2000.tb04276.x
Johnson, S. J., Stockdale, T. N., Ferranti, L., et al. (2019). SEAS5: the new ECMWF seasonal forecast system. Geoscientific Model Development, 12, 1087–1117. doi:10.5194/gmd-12-1087-2019
Leander, R., & Buishand, T. A. (2007). Resampling of regional climate model output for the simulation of extreme river flows. Journal of Hydrology, 332, 487–496. doi:10.1016/j.jhydrol.2006.08.006
Lenderink, G., Buishand, A., & van Deursen, W. (2007). Estimates of future discharges of the river Rhine using two scenario methodologies: direct versus delta approach. Hydrology and Earth System Sciences, 11, 1145–1159. doi:10.5194/hess-11-1145-2007
Manzanas, R., Gutiérrez, J. M., Bhend, J., et al. (2019). Bias adjustment and ensemble recalibration methods for seasonal forecasting: a comprehensive intercomparison using the C3S dataset. Climate Dynamics, 53, 1287–1305. doi:10.1007/s00382-019-04640-4
Michelangeli, P.-A., Vrac, M., & Loukos, H. (2009). Probabilistic downscaling approaches: application to wind cumulative distribution functions. Geophysical Research Letters, 36, L11708. doi:10.1029/2009GL038401
Piani, C., Weedon, G. P., Best, M., et al. (2010). Statistical bias correction of global simulated daily precipitation and temperature for the application of hydrological models. Journal of Hydrology, 395, 199–215. doi:10.1016/j.jhydrol.2010.10.024
Schmidli, J., Frei, C., & Vidale, P. L. (2006). Downscaling from GCM precipitation: a benchmark for dynamical and statistical downscaling methods. International Journal of Climatology, 26, 679–689. doi:10.1002/joc.1287
Switanek, M. B., Troch, P. A., Castro, C. L., et al. (2017). Scaled distribution mapping: a bias correction method that preserves raw climate model projected changes. Hydrology and Earth System Sciences, 21, 2649–2666. doi:10.5194/hess-21-2649-2017
Teutschbein, C., & Seibert, J. (2012). Bias correction of regional climate model simulations for hydrological climate-change impact studies: review and evaluation of different methods. Journal of Hydrology, 456–457, 12–29. doi:10.1016/j.jhydrol.2012.05.052
Themeßl, M. J., Gobiet, A., & Leuprecht, A. (2011). Empirical-statistical downscaling and error correction of daily precipitation from regional climate models. International Journal of Climatology, 31, 1530–1544. doi:10.1002/joc.2168
Torralba, V., Doblas-Reyes, F. J., MacLeod, D., Christel, I., & Davis, M. (2017). Seasonal climate prediction: a new source of information for the management of wind energy resources. Journal of Applied Meteorology and Climatology, 56, 1231–1247. doi:10.1175/JAMC-D-16-0204.1
Vrac, M., Drobinski, P., Merlo, A., et al. (2012). Dynamical and statistical downscaling of the French Mediterranean climate: uncertainty assessment. Natural Hazards and Earth System Sciences, 12, 2769–2784. doi:10.5194/nhess-12-2769-2012
DOIs checked against Crossref, 11 October 2026.
February initialization · FMAM and its months
Research benchmark. The published forecasts still use Mean-Variance Scaling (operational). This section
compares 12 other rainfall-amount bias-correction methods with it, member by member, for every grid cell and target:
a screening of the amount correction alone, then a confirmation through the full probability pipeline that also
accounts for how a method is chosen.
Suggested method
The platform suggests a bias-correction method for every target and product from the historical evidence (the confirmation
against CHIRPS, counting every method tried) and the independent validation seasons scored since (the shadow and validation
runs), by a rule fixed before those seasons are scored. A suggestion is advice for a decision: the published forecast
always uses Mean-Variance Scaling until a change is decided. 1 of 10 target–product combinations have a
candidate.
The rule
Candidate: A method is a candidate only if the confirmation (CHIRPS, outer leave-one-year-out over the training years, full pipeline) finds it better than the operational method with Holm-adjusted p < 0.05 across every declared method and target, and not worse over the test years. Variants outside the declared family are not candidates.
Choice: Among candidates, the method the selection-aware procedure chooses from all training years (training-only information); if that method is not a candidate, the candidate with the best training-period score. Other candidates are listed as alternatives: a confirmation establishes improvement against the operational method, not a ranking among candidates.
Validation: Independent validation seasons are forecast years scored after the benchmark (bias_validation.py). A candidate is 'recommended' once at least minimum_seasons have been scored for it and the operational method, and its mean score over them is not worse; with fewer seasons it stays a 'candidate'; with enough seasons and a worse mean it is 'not supported by validation'. Minimum: 3 seasons.
Suggested methods (national aggregate)
Target
Product
Suggested method
Status
Evidence
Feb
Published tercile probabilities
Square-root-space Mean-Variance Scaling
Candidate — validation 1 of 3 seasons
Square-root-space Mean-Variance Scaling is confirmed better than Mean-Variance Scaling for Feb (RPS difference -0.03669 over the training years, Holm p 0.0264; -0.006635 over the test years). Independent validation: 1 of 3 season(s), mean difference -0.006004.
Feb
Rainfall amounts
Mean-Variance Scaling
Keep the operational method
No method is confirmed better than Mean-Variance Scaling for Feb on the historical evidence.
Mar
Published tercile probabilities
Mean-Variance Scaling
Keep the operational method
No method is confirmed better than Mean-Variance Scaling for Mar on the historical evidence.
Mar
Rainfall amounts
Mean-Variance Scaling
Keep the operational method
No method is confirmed better than Mean-Variance Scaling for Mar on the historical evidence.
Apr
Published tercile probabilities
Mean-Variance Scaling
Keep the operational method
No method is confirmed better than Mean-Variance Scaling for Apr on the historical evidence.
Apr
Rainfall amounts
Mean-Variance Scaling
Keep the operational method
No method is confirmed better than Mean-Variance Scaling for Apr on the historical evidence.
May
Published tercile probabilities
Mean-Variance Scaling
Keep the operational method
No method is confirmed better than Mean-Variance Scaling for May on the historical evidence.
May
Rainfall amounts
Mean-Variance Scaling
Keep the operational method
No method is confirmed better than Mean-Variance Scaling for May on the historical evidence.
FMAM
Published tercile probabilities
Mean-Variance Scaling
Keep the operational method
No method is confirmed better than Mean-Variance Scaling for FMAM on the historical evidence.
FMAM
Rainfall amounts
Mean-Variance Scaling
Keep the operational method
No method is confirmed better than Mean-Variance Scaling for FMAM on the historical evidence.
Summary — national aggregate (All Ethiopia)
All tested corrections improve national FMAM rainfall-amount CRPSS over raw ECMWF in 1993–2016 (raw -0.585; corrected -0.059 to -0.005). Performance varies for monthly tercile probabilities: 0 method–month combinations score below the raw model on RPSS.
Accounting for the whole search. With Holm adjustment across all 60 method–target comparisons, the amount (CRPS) screening passes are none, and the tercile (RPS) passes are Square-root-space Mean-Variance Scaling (Feb, Mar), Power Transformation (Feb, Mar) and Empirical Quantile Mapping (Feb). Within-method passes that do not survive this check: Empirical Quantile Mapping Mar, Gamma Quantile Mapping Feb, Gamma Quantile Mapping Mar, Power Transformation May, Square-root-space Mean-Variance Scaling Feb, Square-root-space Mean-Variance Scaling Mar and Variance Scaling (unbounded) Feb.
What the evidence supports
Published tercile probabilities: confirmed against Mean-Variance Scaling (family-wide, full pipeline): Square-root-space Mean-Variance Scaling for Feb. The selection-aware procedure is confirmed for Feb.
Rainfall amounts: no tested method demonstrates a statistically significant improvement over Mean-Variance Scaling under this validation protocol (several have slightly higher point estimates); the selection-aware procedure is confirmed for Feb and Mar.
The operational method stays Mean-Variance Scaling until a change is decided by initialization, target and product, and recorded in the docs, on this evidence; confirmed improvements limited to some months may justify a per-target choice.
If amounts and probabilities come to use different correction paths, the product metadata must record both methods so that every output can be traced.
The same screening and confirmation run for the other cycles with one configuration file each (config/bias_correction/).
Data
Data used by the benchmark
Item
Details
Forecasts
ECMWF SEAS5 (system 51), initialized on 1 February; 25 members 1993–2016, 51 from 2017; remapped from 1° to the 0.25° CHIRPS grid by conservative remapping (each 1° cell fills a 4 × 4 block). Johnson et al. 2019
Observations
CHIRPS v3.0 monthly totals, averaged from 0.05° to 0.25°
Targets
Feb, Mar, Apr, May and the FMAM season; each corrected separately
Values
One total per member, grid cell and year (mm), the same inputs as the operational tool (data/processed/init02_<target>/)
Score coverage (amounts / probabilities, share of the national area)
Feb 100% / 85%; Mar 100% / 99%; Apr 100% / 100%; May 100% / 100%; FMAM 100% / 100%. Tercile scores need two distinct tercile boundaries defining three categories, a CHIRPS standard deviation of at least 1 mm and a lower boundary above 0 mm, so dry months have fewer probability cells.
Dry totals
≤ 1 mm in a month or season (not a dry day); exactly 0 mm is reported separately
Weighting
Every member is used; each training year has total weight 1/Y (each member of year y weighs 1/(Y·My)), so years with 25 and 51 members count equally. Each observed year weighs 1/Y.
Run
config/bias_correction/feb_fmam.json; 2026-10-12 12:26 UTC; commit 9f397927f5; scoring version 3
Methods
Each method is fitted per grid cell and target from the training years only and applied to each member of the scored year.
Methods that keep a “change signal” (DC, DQM, QDM, SDM, CDF-t) were designed for climate change, where a model’s reference period is
compared with a future period; here the “future” is the forecast itself: the target year’s ensemble against the model climatology.
How overlapping names were resolved
Delta Change appeared twice in the requested list; it is one method.
Mean–Variance Scaling is the operational method, with the project’s 0.5–2 ratio limits. Variance Scaling uses the same algebra and the same fallback (ratio 1 where the model spread is below 1 mm) without the limits, so the comparison isolates the limits.
Delta Change returns the CHIRPS training years rescaled by the forecast signal (ensemble mean / model climatology): historical scenarios, not corrected members. Applied to each member instead it would be identical to Linear Scaling.
Square-root-space MVS (a mean–variance scaling of √x) is distinct from Power Transformation (a·xb with b fitted to the coefficient of variation).
The raw model is scored as a baseline, not screened.
Dry totals and tied values
A total at or below 1 mm in the month or season is “dry” (not a dry day).
For the quantile-mapping methods (EQM, Gamma QM, DQM, QDM) the dry shares of the model climatology and of CHIRPS are estimated with
the equal-year weights; a forecast’s dry members are spread evenly over the model’s dry probability by rank (deterministic stratified
tie-breaking, with ties resolved by member index), and a probability within the CHIRPS dry share maps to 0 mm, also after any
extrapolation of the upper tail. Without this, tied zeros share one
probability and the corrected dry share does not follow CHIRPS. Tests cover repeated zeros, all-dry samples and very few wet values;
the dry-month table under Results compares the shares. CDF-t, LOCI and the scaling methods have no occurrence adjustment; SDM uses its
own rain-member rule (Switanek et al. 2017).
12 methods, the operational reference and the raw baseline
Method
Family
Definition (per cell and target)
Member-wise
Uses the forecast ensemble’s own distribution
Parameters
References
Raw ECMWF (no correction) raw
baseline
x' = x (the uncorrected model; baseline, not a candidate)
Model threshold with the observed frequency of totals above 1 mm, then intensity scaling above it (designed for daily rainfall; here monthly or seasonal totals)
x' = G_obs^-1(G_model(x)), G = dry mass (<= 1 mm) + gamma by weighted maximum likelihood, with the dry policy; linear scaling where fewer than 3 wet values
a * EQM(x / a), a = forecast ensemble mean / model mean (0.2-5): removes and reapplies the bounded ratio; exact preservation of the final mean anomaly is not guaranteed
x' = Q_obs(tau) * x / Q_model(tau), tau = rank of x in the forecast ensemble; change capped at 5 and replaced by Q_obs(tau) where Q_model(tau) <= 1 mm (both reported), so preservation is partial there
Switanek et al. (2017) precipitation steps 1-7: gamma fits, recurrence intervals interpolated to the forecast's length, scaled CDF, rain-member count; model climatology with equal-year weights
F_obs,f = F_obs(F_model^-1(F_forecast)); x' = F_obs,f^-1(F_forecast(x)); implementation choices: model and forecast first scaled to the CHIRPS mean, values stay within the scaled forecast range
Per-member totals of every target and year, and CHIRPS for 1993–2025.
bias_benchmark.py · run_calibration.load_inputs
2
Fit
For each cell and target, the method’s statistics from the training years only, with equal-year weights.
bias_methods.METHODS[key].fit
3
Apply
Correct every member of the scored year individually (member-wise).
bias_methods.METHODS[key].apply
4
Score
Ensemble CRPS (and fair CRPS), ensemble-mean errors, spread–error, rank histograms, tercile RPS, dry shares and distribution ratios, per cell; then area-weighted per year.
bias_benchmark.score_cells · summarise
5
Screen
Each method against Mean-Variance Scaling per target: one-sided sign-flip test on whole years, Holm within the method and across all methods, no harm in 2017–2025.
bias_benchmark.make_gates
6
Confirm
Every method through the full probability pipeline (blend weight fitted inside the folds), and selection-aware procedures that choose the method each year from training-only scores.
bias_confirmation.py
Evaluation designs (no amount method has a parameter tuned on scores)
Design
Fits
Scored
Role
Screening: training
leave-one-year-out within 1993–2016
each 1993–2016 year
clean evidence for the screening
Screening: test
1993–2016
2017–2025
exploratory (these years were seen before)
Screening: full
leave-one-year-out within 1993–2025
each year
per-cell maps and distribution checks (descriptive)
Confirmation
outer leave-one-year-out within 1993–2016; inside each fold the blend weight (inner leave-one-year-out) and, for SEL-P/SEL-A, the method choice
each 1993–2016 year
full pipeline; accounts for the method choice
Confirmation: test
1993–2016 (fits, blend weight and method choice)
2017–2025
exploratory
Forecast
1993–2025
2026 members
member-by-member comparison
Scores
Score
What it measures
Reference
CRPS / CRPSS
Error of the corrected ensemble’s empirical distribution, as delivered, in mm; skill against the CHIRPS training climatology (the training years as an ensemble). Primary amount score.
Fair CRPS / CRPSS
The same under the interpretation that the members are a sample of an underlying distribution; reported as a diagnostic and screened separately. The justification assumes exchangeable members, which DC’s rescaled years and methods tied to the forecast mean or ranks only approximate.
The published probability product: counts, smoothing and the climatology blend with its weight fitted inside the folds; category Brier skill for below and above normal; reliability tables
Dry shares and distribution ratios
Pooled out-of-fold corrected members (equal-year weights) against CHIRPS of the same years: shares at exactly 0 mm and at ≤ 1 mm; mean, standard deviation, 10th and 90th percentile ratios (area-weighted medians)
Screening results
Region for the result tables
Tables for: All Ethiopia. ✓ = screening pass within the method (Holm across its targets); ✓✓ = also passes with Holm across all methods and targets. A pass is screening evidence, not an adoption decision. Bold: the operational method. Skill is against the CHIRPS training climatology (0 = no better than climatology).
FMAM season at a glance — All Ethiopia
Method
Amount CRPSS
Tercile RPSS (no blend)
Diagnostics, leave-one-year-out 1993–2016
1993–2016
2017–2025
1993–2016
2017–2025
Mean bias (mm)
MAE (mm)
Correlation
Spread–error
Reliability index
Members ≤ 1 mm
Raw ECMWF (no correction)
-0.585
-0.666
-0.385
-0.636
-75.0
99.4
0.22
0.50
0.68
0.0%
Linear Scaling
-0.023
+0.086
+0.002
+0.094
+0.2
70.2
0.12
1.06
0.08
0.0%
Mean-Variance Scaling (operational)
-0.007
+0.071
+0.005
+0.096
+0.1
69.2
0.09
0.91
0.09
0.0%
Variance Scaling (unbounded)
-0.007
+0.070
+0.005
+0.095
+0.1
69.2
0.09
0.92
0.09
0.0%
Square-root-space Mean-Variance Scaling
-0.005
+0.073
+0.006
+0.101
+0.1
69.1
0.09
0.91
0.09
0.0%
Power Transformation
-0.008
+0.074
+0.004
+0.104
+0.0
69.2
0.10
0.92
0.09
0.0%
Delta Change
-0.010
+0.075
+0.001
+0.086
+0.2
70.2
0.12
1.00
0.03
0.0%
Local Intensity Scaling
-0.022
+0.086
+0.002
+0.094
+0.2
70.2
0.12
1.05
0.08
0.0%
Empirical Quantile Mapping
-0.018
+0.059
-0.005
+0.081
+0.1
69.2
0.09
0.92
0.10
0.0%
Gamma Quantile Mapping
-0.005
+0.073
+0.006
+0.103
+0.1
69.1
0.09
0.90
0.10
0.0%
Detrended Quantile Mapping
-0.035
+0.072
-0.023
+0.100
+0.2
70.5
0.12
0.91
0.11
0.0%
Quantile Delta Mapping
-0.048
+0.075
-0.034
+0.114
+2.0
70.7
0.13
0.92
0.15
0.0%
Scaled Distribution Mapping
-0.059
+0.063
-0.045
+0.111
-4.6
70.1
0.13
0.81
0.25
0.7%
CDF-transform
-0.041
+0.072
-0.030
+0.100
+0.6
70.6
0.12
0.91
0.10
0.0%
MVS with all-zero guard (variant)
-0.007
+0.071
+0.005
+0.096
+0.1
69.2
0.09
0.91
0.09
0.0%
Amount skill (CRPSS) by target, leave-one-year-out 1993–2016
Method
Feb
Mar
Apr
May
FMAM
Raw ECMWF (no correction)
-0.184
-0.288
-0.233
-0.238
-0.585
Linear Scaling
-0.031
-0.091
-0.011
-0.013
-0.023
Mean-Variance Scaling (operational)
+0.240
-0.034
-0.001
-0.005
-0.007
Variance Scaling (unbounded)
+0.246 ✓
-0.032
-0.000
-0.005
-0.007
Square-root-space Mean-Variance Scaling
+0.267 ✓
-0.017 ✓
+0.001
-0.002
-0.005
Power Transformation
+0.202
-0.020
-0.001
+0.000
-0.008
Delta Change
+0.091
-0.055
+0.001
+0.004
-0.010
Local Intensity Scaling
+0.040
-0.082
-0.011
-0.012
-0.022
Empirical Quantile Mapping
+0.248
-0.028
-0.012
-0.011
-0.018
Gamma Quantile Mapping
+0.245
-0.018
+0.001
-0.002
-0.005
Detrended Quantile Mapping
-0.016
-0.089
-0.024
-0.017
-0.035
Quantile Delta Mapping
+0.158
-0.113
-0.035
-0.019
-0.048
Scaled Distribution Mapping
-0.077
-0.105
-0.037
-0.023
-0.059
CDF-transform
-0.367
-0.112
-0.030
-0.021
-0.041
MVS with all-zero guard (variant)
+0.240
-0.034
-0.001
-0.005
-0.007
Tercile skill (RPSS of smoothed counts, no blend) by target, 1993–2016
Method
Feb
Mar
Apr
May
FMAM
Raw ECMWF (no correction)
-0.123
-0.224
-0.193
-0.213
-0.385
Linear Scaling
+0.044
-0.026
+0.000
+0.001
+0.002
Mean-Variance Scaling (operational)
+0.054
-0.058
-0.001
-0.002
+0.005
Variance Scaling (unbounded)
+0.049
-0.056
+0.001
-0.002
+0.005
Square-root-space Mean-Variance Scaling
+0.196 ✓✓
+0.016 ✓✓
+0.001
+0.008
+0.006
Power Transformation
+0.169 ✓✓
+0.004 ✓✓
-0.002
+0.008 ✓
+0.004
Delta Change
+0.056
-0.031
-0.002
+0.011
+0.001
Local Intensity Scaling
+0.039
-0.025
+0.000
-0.000
+0.002
Empirical Quantile Mapping
+0.182 ✓✓
-0.002 ✓
-0.011
-0.004
-0.005
Gamma Quantile Mapping
+0.136 ✓
-0.009 ✓
+0.000
+0.007
+0.006
Detrended Quantile Mapping
+0.042
-0.051
-0.025
-0.010
-0.023
Quantile Delta Mapping
+0.082
-0.044
-0.034
-0.012
-0.034
Scaled Distribution Mapping
-0.074
-0.102
-0.038
-0.024
-0.045
CDF-transform
+0.011
-0.064
-0.029
-0.015
-0.030
MVS with all-zero guard (variant)
+0.054
-0.058
-0.001
-0.002
+0.005
More scores by target: test years, fair CRPS, bias, correlation, spread, reliability, coverage
Amount skill (CRPSS), fit 1993–2016, scored 2017–2025
Method
Feb
Mar
Apr
May
FMAM
Raw ECMWF (no correction)
-0.502
-0.310
-0.303
-0.348
-0.666
Linear Scaling
-0.215
+0.046
-0.007
+0.014
+0.086
Mean-Variance Scaling (operational)
-0.002
+0.065
+0.004
+0.025
+0.071
Variance Scaling (unbounded)
-0.000
+0.068
+0.004
+0.023
+0.070
Square-root-space Mean-Variance Scaling
+0.011
+0.084
+0.009
+0.022
+0.073
Power Transformation
-0.039
+0.080
+0.011
+0.032
+0.074
Delta Change
-0.145
+0.093
-0.004
+0.033
+0.075
Local Intensity Scaling
-0.177
+0.049
-0.006
+0.014
+0.086
Empirical Quantile Mapping
+0.006
+0.072
+0.000
+0.019
+0.059
Gamma Quantile Mapping
+0.000
+0.082
+0.010
+0.020
+0.073
Detrended Quantile Mapping
-0.163
+0.088
-0.004
+0.024
+0.072
Quantile Delta Mapping
-0.079
+0.089
-0.006
+0.025
+0.075
Scaled Distribution Mapping
-0.257
+0.036
-0.018
+0.021
+0.063
CDF-transform
-0.261
+0.087
-0.006
+0.017
+0.072
MVS with all-zero guard (variant)
-0.002
+0.065
+0.004
+0.025
+0.071
Amount skill with the fair CRPS (diagnostic), 1993–2016
Method
Feb
Mar
Apr
May
FMAM
Raw ECMWF (no correction)
-0.212
-0.316
-0.255
-0.261
-0.624
Linear Scaling
-0.034
-0.087
-0.012
-0.016
-0.025
Mean-Variance Scaling (operational)
+0.232
-0.044
-0.007
-0.011
-0.014
Variance Scaling (unbounded)
+0.238
-0.042
-0.007
-0.012
-0.014
Square-root-space Mean-Variance Scaling
+0.261 ✓
-0.023 ✓
-0.004
-0.007
-0.013
Power Transformation
+0.196
-0.026
-0.007
-0.006
-0.015
Delta Change
+0.095
-0.057
+0.001
+0.004
-0.010
Local Intensity Scaling
+0.036
-0.079
-0.011
-0.016
-0.024
Empirical Quantile Mapping
+0.240
-0.037
-0.019
-0.017
-0.026
Gamma Quantile Mapping
+0.237
-0.026
-0.005
-0.007
-0.013
Detrended Quantile Mapping
-0.035
-0.099
-0.031
-0.023
-0.044
Quantile Delta Mapping
+0.153
-0.124
-0.042
-0.024
-0.058
Scaled Distribution Mapping
-0.096
-0.122
-0.048
-0.034
-0.074
CDF-transform
-0.404
-0.123
-0.037
-0.028
-0.050
MVS with all-zero guard (variant)
+0.232
-0.044
-0.007
-0.011
-0.014
Tercile skill (RPSS, no blend), fit 1993–2016, scored 2017–2025
Method
Feb
Mar
Apr
May
FMAM
Raw ECMWF (no correction)
-0.649
-0.303
-0.293
-0.356
-0.636
Linear Scaling
-0.360
+0.001
+0.000
-0.000
+0.094
Mean-Variance Scaling (operational)
-0.071
+0.005
+0.007
+0.023
+0.096
Variance Scaling (unbounded)
-0.034
+0.010
+0.007
+0.022
+0.095
Square-root-space Mean-Variance Scaling
+0.007
+0.062
+0.016
+0.017
+0.101
Power Transformation
-0.013
+0.053
+0.022
+0.036
+0.104
Delta Change
-0.308
+0.046
-0.010
+0.026
+0.086
Local Intensity Scaling
-0.364
+0.007
+0.000
-0.000
+0.094
Empirical Quantile Mapping
-0.018
+0.042
+0.005
+0.025
+0.081
Gamma Quantile Mapping
+0.012
+0.063
+0.019
+0.024
+0.103
Detrended Quantile Mapping
-0.327
+0.037
-0.009
+0.027
+0.100
Quantile Delta Mapping
-0.161
+0.045
-0.007
+0.027
+0.114
Scaled Distribution Mapping
-0.480
-0.024
-0.021
+0.013
+0.111
CDF-transform
-0.323
+0.026
-0.005
+0.013
+0.100
MVS with all-zero guard (variant)
-0.071
+0.005
+0.007
+0.023
+0.096
Ensemble-mean bias (mm), 1993–2016
Method
Feb
Mar
Apr
May
FMAM
Raw ECMWF (no correction)
-6.3
-22.7
-24.3
-21.8
-75.0
Linear Scaling
+0.6
+0.2
+0.1
+0.1
+0.2
Mean-Variance Scaling (operational)
+0.1
+0.2
-0.0
+0.1
+0.1
Variance Scaling (unbounded)
+0.1
+0.2
-0.0
+0.1
+0.1
Square-root-space Mean-Variance Scaling
+0.1
+0.1
-0.0
+0.1
+0.1
Power Transformation
-0.0
+0.1
-0.0
+0.1
+0.0
Delta Change
+0.1
+0.3
+0.1
+0.1
+0.2
Local Intensity Scaling
-0.1
-0.0
+0.1
+0.0
+0.2
Empirical Quantile Mapping
-0.0
+0.1
-0.0
+0.0
+0.1
Gamma Quantile Mapping
-0.1
+0.1
+0.0
+0.0
+0.1
Detrended Quantile Mapping
+0.8
+1.1
+0.4
+0.4
+0.2
Quantile Delta Mapping
+0.2
+2.7
+1.3
+0.9
+2.0
Scaled Distribution Mapping
-0.8
-5.5
-4.6
-4.4
-4.6
CDF-transform
+3.4
+2.3
+0.8
+0.8
+0.6
MVS with all-zero guard (variant)
+0.1
+0.2
-0.0
+0.1
+0.1
Correlation of the ensemble mean with CHIRPS over years, 1993–2016
Method
Feb
Mar
Apr
May
FMAM
Raw ECMWF (no correction)
+0.44
+0.10
+0.16
+0.15
+0.22
Linear Scaling
+0.40
+0.02
+0.03
+0.01
+0.12
Mean-Variance Scaling (operational)
+0.38
-0.02
+0.01
-0.00
+0.09
Variance Scaling (unbounded)
+0.36
-0.02
+0.01
-0.00
+0.09
Square-root-space Mean-Variance Scaling
+0.38
-0.01
+0.02
+0.00
+0.09
Power Transformation
+0.38
-0.00
+0.01
+0.00
+0.10
Delta Change
+0.41
+0.02
+0.03
+0.01
+0.12
Local Intensity Scaling
+0.40
+0.01
+0.03
+0.01
+0.12
Empirical Quantile Mapping
+0.36
-0.01
+0.01
-0.01
+0.09
Gamma Quantile Mapping
+0.37
-0.01
+0.01
+0.01
+0.09
Detrended Quantile Mapping
+0.41
+0.02
+0.03
+0.02
+0.12
Quantile Delta Mapping
+0.41
+0.03
+0.03
+0.02
+0.13
Scaled Distribution Mapping
+0.39
+0.03
+0.04
+0.01
+0.13
CDF-transform
+0.39
+0.03
+0.03
+0.01
+0.12
MVS with all-zero guard (variant)
+0.38
-0.02
+0.01
-0.00
+0.09
Spread–error ratio, 1993–2016 (1 = spread matches the error)
Score coverage, mean per year, 1993–2016 (share of the region’s area)
Target
Amount cells
Amount area
Probability cells
Probability area
Feb
1484
100%
1263
85%
Mar
1484
100%
1463
99%
Apr
1484
100%
1484
100%
May
1484
100%
1484
100%
FMAM
1484
100%
1484
100%
Dry months: shares of totals at exactly 0 mm and at ≤ 1 mm, CHIRPS and corrected
Area-weighted mean share over cells, pooled leave-one-year-out 1993–2025
Exactly 0 mm
≤ 1 mm
Feb: CHIRPS
0.2%
12.9%
Raw ECMWF (no correction)
8.7%
42.3%
Linear Scaling
8.7%
36.3%
Mean-Variance Scaling (operational)
4.6%
14.5%
Variance Scaling (unbounded)
1.9%
13.3%
Square-root-space Mean-Variance Scaling
0.8%
13.4%
Power Transformation
8.7%
19.9%
Delta Change
0.2%
19.4%
Local Intensity Scaling
17.7%
17.7%
Empirical Quantile Mapping
12.9%
12.9%
Gamma Quantile Mapping
11.1%
15.0%
Detrended Quantile Mapping
12.7%
20.4%
Quantile Delta Mapping
13.0%
16.2%
Scaled Distribution Mapping
34.2%
43.6%
CDF-transform
0.1%
21.2%
MVS with all-zero guard (variant)
4.6%
14.5%
Mar: CHIRPS
0.7%
5.1%
Raw ECMWF (no correction)
1.5%
18.2%
Linear Scaling
1.5%
14.2%
Mean-Variance Scaling (operational)
2.0%
3.9%
Variance Scaling (unbounded)
1.0%
3.7%
Square-root-space Mean-Variance Scaling
0.5%
5.4%
Power Transformation
1.5%
7.8%
Delta Change
0.7%
6.4%
Local Intensity Scaling
6.0%
6.0%
Empirical Quantile Mapping
5.1%
5.1%
Gamma Quantile Mapping
5.2%
7.5%
Detrended Quantile Mapping
4.8%
6.5%
Quantile Delta Mapping
5.1%
5.8%
Scaled Distribution Mapping
19.8%
20.3%
CDF-transform
0.3%
6.4%
MVS with all-zero guard (variant)
2.0%
3.9%
Apr: CHIRPS
0.2%
1.3%
Raw ECMWF (no correction)
0.2%
2.8%
Linear Scaling
0.2%
2.0%
Mean-Variance Scaling (operational)
0.3%
0.4%
Variance Scaling (unbounded)
0.3%
0.4%
Square-root-space Mean-Variance Scaling
0.1%
0.6%
Power Transformation
0.2%
0.7%
Delta Change
0.2%
1.4%
Local Intensity Scaling
1.4%
1.4%
Empirical Quantile Mapping
1.3%
1.4%
Gamma Quantile Mapping
1.4%
1.6%
Detrended Quantile Mapping
1.3%
1.4%
Quantile Delta Mapping
1.4%
1.6%
Scaled Distribution Mapping
4.1%
4.1%
CDF-transform
0.1%
1.2%
MVS with all-zero guard (variant)
0.3%
0.4%
May: CHIRPS
0.5%
1.3%
Raw ECMWF (no correction)
0.1%
2.2%
Linear Scaling
0.1%
1.5%
Mean-Variance Scaling (operational)
0.2%
0.2%
Variance Scaling (unbounded)
0.2%
0.2%
Square-root-space Mean-Variance Scaling
0.0%
0.3%
Power Transformation
0.1%
0.3%
Delta Change
0.5%
1.3%
Local Intensity Scaling
1.3%
1.3%
Empirical Quantile Mapping
1.3%
1.3%
Gamma Quantile Mapping
1.2%
1.4%
Detrended Quantile Mapping
1.2%
1.3%
Quantile Delta Mapping
1.3%
1.3%
Scaled Distribution Mapping
3.7%
3.7%
CDF-transform
0.1%
1.1%
MVS with all-zero guard (variant)
0.2%
0.2%
FMAM: CHIRPS
0.0%
0.0%
Raw ECMWF (no correction)
0.0%
0.0%
Linear Scaling
0.0%
0.0%
Mean-Variance Scaling (operational)
0.0%
0.0%
Variance Scaling (unbounded)
0.0%
0.0%
Square-root-space Mean-Variance Scaling
0.0%
0.0%
Power Transformation
0.0%
0.0%
Delta Change
0.0%
0.0%
Local Intensity Scaling
0.0%
0.0%
Empirical Quantile Mapping
0.0%
0.0%
Gamma Quantile Mapping
0.0%
0.0%
Detrended Quantile Mapping
0.0%
0.0%
Quantile Delta Mapping
0.0%
0.0%
Scaled Distribution Mapping
0.8%
0.8%
CDF-transform
0.0%
0.0%
MVS with all-zero guard (variant)
0.0%
0.0%
Distribution of the corrected members (mean, spread, 10th and 90th percentiles)
Mean of the corrected members / CHIRPS (area-weighted median of cell ratios, 1993–2025; 1 = same)
Method
Feb
Mar
Apr
May
FMAM
Raw ECMWF (no correction)
0.57
0.54
0.72
0.71
0.67
Linear Scaling
1.02
1.00
1.00
1.00
1.00
Mean-Variance Scaling (operational)
1.00
1.00
1.00
1.00
1.00
Variance Scaling (unbounded)
1.01
1.00
1.00
1.00
1.00
Square-root-space Mean-Variance Scaling
1.01
1.00
1.00
1.00
1.00
Power Transformation
1.00
1.00
1.00
1.00
1.00
Delta Change
1.01
1.00
1.00
1.00
1.00
Local Intensity Scaling
1.00
1.00
1.00
1.00
1.00
Empirical Quantile Mapping
1.00
1.00
1.00
1.00
1.00
Gamma Quantile Mapping
1.00
1.00
1.00
1.00
1.00
Detrended Quantile Mapping
1.02
1.01
1.00
1.00
1.00
Quantile Delta Mapping
1.00
1.04
1.01
1.01
1.00
Scaled Distribution Mapping
0.78
0.85
0.95
0.96
0.98
CDF-transform
1.14
1.04
1.01
1.01
1.00
MVS with all-zero guard (variant)
1.00
1.00
1.00
1.00
1.00
Standard deviation of the corrected members / CHIRPS (area-weighted median of cell ratios, 1993–2025; 1 = same)
Method
Feb
Mar
Apr
May
FMAM
Raw ECMWF (no correction)
1.07
0.75
0.86
0.83
0.75
Linear Scaling
1.85
1.44
1.20
1.18
1.11
Mean-Variance Scaling (operational)
1.04
1.01
1.00
1.00
1.00
Variance Scaling (unbounded)
1.04
1.01
1.00
1.00
1.00
Square-root-space Mean-Variance Scaling
1.04
1.04
1.01
1.04
0.99
Power Transformation
1.01
1.00
1.00
1.00
1.00
Delta Change
1.84
1.18
1.06
1.06
1.08
Local Intensity Scaling
1.64
1.39
1.20
1.18
1.11
Empirical Quantile Mapping
1.00
1.00
1.00
1.00
1.00
Gamma Quantile Mapping
0.92
1.00
1.01
1.03
0.98
Detrended Quantile Mapping
1.54
1.12
1.03
1.02
1.02
Quantile Delta Mapping
1.38
1.14
1.05
1.04
1.04
Scaled Distribution Mapping
1.45
0.94
0.92
0.94
0.94
CDF-transform
1.72
1.16
1.05
1.05
1.04
MVS with all-zero guard (variant)
1.04
1.01
1.00
1.00
1.00
10th percentile of the corrected members / CHIRPS (area-weighted median of cell ratios, 1993–2025; 1 = same)
Method
Feb
Mar
Apr
May
FMAM
Raw ECMWF (no correction)
0.03
0.12
0.52
0.62
0.58
Linear Scaling
0.06
0.23
0.72
0.89
0.87
Mean-Variance Scaling (operational)
1.07
1.36
1.04
1.05
0.96
Variance Scaling (unbounded)
1.13
1.35
1.03
1.05
0.96
Square-root-space Mean-Variance Scaling
0.82
0.96
0.96
0.99
0.96
Power Transformation
0.38
0.70
0.92
0.99
0.93
Delta Change
0.32
0.80
0.91
0.92
0.94
Local Intensity Scaling
0.20
0.33
0.71
0.86
0.87
Empirical Quantile Mapping
0.99
0.95
0.94
0.95
0.98
Gamma Quantile Mapping
0.69
0.89
0.95
0.97
0.96
Detrended Quantile Mapping
0.31
0.81
0.91
0.94
0.95
Quantile Delta Mapping
0.51
0.82
0.91
0.94
0.96
Scaled Distribution Mapping
0.00
0.00
0.90
0.94
0.97
CDF-transform
0.26
0.77
0.92
0.95
0.95
MVS with all-zero guard (variant)
1.07
1.36
1.04
1.05
0.96
90th percentile of the corrected members / CHIRPS (area-weighted median of cell ratios, 1993–2025; 1 = same)
Method
Feb
Mar
Apr
May
FMAM
Raw ECMWF (no correction)
0.80
0.65
0.79
0.77
0.71
Linear Scaling
1.43
1.23
1.10
1.09
1.04
Mean-Variance Scaling (operational)
1.03
1.01
1.01
1.01
1.00
Variance Scaling (unbounded)
0.99
1.01
1.01
1.01
1.01
Square-root-space Mean-Variance Scaling
1.09
1.03
1.03
1.03
1.00
Power Transformation
1.12
1.03
1.01
1.02
1.00
Delta Change
1.20
1.08
1.05
1.04
1.04
Local Intensity Scaling
1.25
1.20
1.10
1.09
1.04
Empirical Quantile Mapping
1.05
1.05
1.03
1.02
1.02
Gamma Quantile Mapping
1.00
1.01
1.02
1.03
1.00
Detrended Quantile Mapping
1.30
1.08
1.04
1.03
1.02
Quantile Delta Mapping
1.11
1.11
1.04
1.03
1.02
Scaled Distribution Mapping
0.96
0.91
0.96
0.96
0.97
CDF-transform
1.58
1.11
1.04
1.04
1.03
MVS with all-zero guard (variant)
1.03
1.01
1.01
1.01
1.00
Tables for: FMAM rainfall contribution domain. Screening marks are computed for the national aggregate (All Ethiopia) only. Bold: the operational method. Skill is against the CHIRPS training climatology (0 = no better than climatology).
FMAM season at a glance — FMAM rainfall contribution domain
Method
Amount CRPSS
Tercile RPSS (no blend)
Diagnostics, leave-one-year-out 1993–2016
1993–2016
2017–2025
1993–2016
2017–2025
Mean bias (mm)
MAE (mm)
Correlation
Spread–error
Reliability index
Members ≤ 1 mm
Raw ECMWF (no correction)
-0.702
-0.767
-0.473
-0.798
-92.3
110.6
0.21
0.46
0.83
0.0%
Linear Scaling
-0.034
+0.087
-0.008
+0.096
+0.2
74.4
0.11
1.05
0.08
0.0%
Mean-Variance Scaling (operational)
-0.017
+0.071
-0.005
+0.099
+0.1
73.1
0.09
0.90
0.10
0.0%
Variance Scaling (unbounded)
-0.017
+0.071
-0.005
+0.099
+0.1
73.1
0.09
0.91
0.10
0.0%
Square-root-space Mean-Variance Scaling
-0.015
+0.074
-0.005
+0.106
+0.1
73.0
0.09
0.89
0.11
0.0%
Power Transformation
-0.019
+0.076
-0.007
+0.110
+0.1
73.1
0.09
0.91
0.10
0.0%
Delta Change
-0.020
+0.074
-0.011
+0.082
+0.2
74.4
0.11
0.99
0.05
0.0%
Local Intensity Scaling
-0.034
+0.087
-0.008
+0.096
+0.2
74.4
0.11
1.05
0.08
0.0%
Empirical Quantile Mapping
-0.027
+0.060
-0.013
+0.085
+0.1
73.0
0.09
0.90
0.12
0.0%
Gamma Quantile Mapping
-0.015
+0.074
-0.004
+0.109
+0.1
72.9
0.09
0.88
0.12
0.0%
Detrended Quantile Mapping
-0.048
+0.073
-0.037
+0.101
+0.1
74.6
0.11
0.89
0.13
0.0%
Quantile Delta Mapping
-0.063
+0.076
-0.049
+0.117
+2.2
75.0
0.12
0.90
0.18
0.0%
Scaled Distribution Mapping
-0.076
+0.061
-0.063
+0.110
-4.3
74.4
0.12
0.79
0.28
0.5%
CDF-transform
-0.053
+0.074
-0.043
+0.102
+0.6
74.8
0.12
0.89
0.13
0.0%
MVS with all-zero guard (variant)
-0.017
+0.071
-0.005
+0.099
+0.1
73.1
0.09
0.90
0.10
0.0%
Amount skill (CRPSS) by target, leave-one-year-out 1993–2016
Method
Feb
Mar
Apr
May
FMAM
Raw ECMWF (no correction)
-0.150
-0.307
-0.266
-0.276
-0.702
Linear Scaling
-0.002
-0.095
-0.011
-0.007
-0.034
Mean-Variance Scaling (operational)
+0.260
-0.036
+0.001
-0.001
-0.017
Variance Scaling (unbounded)
+0.261
-0.034
+0.001
-0.002
-0.017
Square-root-space Mean-Variance Scaling
+0.284
-0.019
+0.002
+0.002
-0.015
Power Transformation
+0.217
-0.022
-0.000
+0.005
-0.019
Delta Change
+0.120
-0.058
-0.001
+0.010
-0.020
Local Intensity Scaling
+0.062
-0.087
-0.010
-0.007
-0.034
Empirical Quantile Mapping
+0.264
-0.031
-0.011
-0.008
-0.027
Gamma Quantile Mapping
+0.259
-0.021
+0.002
+0.003
-0.015
Detrended Quantile Mapping
+0.015
-0.093
-0.024
-0.011
-0.048
Quantile Delta Mapping
+0.182
-0.119
-0.035
-0.012
-0.063
Scaled Distribution Mapping
-0.041
-0.110
-0.037
-0.018
-0.076
CDF-transform
-0.343
-0.117
-0.029
-0.015
-0.053
MVS with all-zero guard (variant)
+0.260
-0.036
+0.001
-0.001
-0.017
Tercile skill (RPSS of smoothed counts, no blend) by target, 1993–2016
Method
Feb
Mar
Apr
May
FMAM
Raw ECMWF (no correction)
-0.129
-0.246
-0.238
-0.250
-0.473
Linear Scaling
+0.064
-0.023
+0.003
+0.003
-0.008
Mean-Variance Scaling (operational)
+0.067
-0.050
+0.004
-0.002
-0.005
Variance Scaling (unbounded)
+0.060
-0.046
+0.006
-0.002
-0.005
Square-root-space Mean-Variance Scaling
+0.227
+0.024
+0.004
+0.009
-0.005
Power Transformation
+0.196
+0.010
+0.001
+0.010
-0.007
Delta Change
+0.086
-0.031
-0.004
+0.018
-0.011
Local Intensity Scaling
+0.053
-0.022
+0.003
+0.002
-0.008
Empirical Quantile Mapping
+0.208
+0.004
-0.008
-0.002
-0.013
Gamma Quantile Mapping
+0.156
-0.007
+0.003
+0.009
-0.004
Detrended Quantile Mapping
+0.077
-0.050
-0.025
-0.006
-0.037
Quantile Delta Mapping
+0.106
-0.043
-0.034
-0.006
-0.049
Scaled Distribution Mapping
-0.044
-0.098
-0.038
-0.020
-0.063
CDF-transform
+0.054
-0.064
-0.028
-0.009
-0.043
MVS with all-zero guard (variant)
+0.067
-0.050
+0.004
-0.002
-0.005
More scores by target: test years, fair CRPS, bias, correlation, spread, reliability, coverage
Amount skill (CRPSS), fit 1993–2016, scored 2017–2025
Method
Feb
Mar
Apr
May
FMAM
Raw ECMWF (no correction)
-0.559
-0.323
-0.329
-0.442
-0.767
Linear Scaling
-0.243
+0.058
-0.003
-0.005
+0.087
Mean-Variance Scaling (operational)
-0.019
+0.073
+0.005
+0.007
+0.071
Variance Scaling (unbounded)
-0.017
+0.076
+0.005
+0.005
+0.071
Square-root-space Mean-Variance Scaling
-0.009
+0.093
+0.010
+0.007
+0.074
Power Transformation
-0.063
+0.090
+0.012
+0.015
+0.076
Delta Change
-0.172
+0.103
-0.005
+0.015
+0.074
Local Intensity Scaling
-0.206
+0.060
-0.003
-0.005
+0.087
Empirical Quantile Mapping
-0.008
+0.081
+0.003
+0.004
+0.060
Gamma Quantile Mapping
-0.017
+0.091
+0.011
+0.007
+0.074
Detrended Quantile Mapping
-0.195
+0.099
-0.002
+0.006
+0.073
Quantile Delta Mapping
-0.108
+0.102
-0.004
+0.008
+0.076
Scaled Distribution Mapping
-0.278
+0.043
-0.018
-0.000
+0.061
CDF-transform
-0.305
+0.100
-0.004
-0.001
+0.074
MVS with all-zero guard (variant)
-0.019
+0.073
+0.005
+0.007
+0.071
Amount skill with the fair CRPS (diagnostic), 1993–2016
Method
Feb
Mar
Apr
May
FMAM
Raw ECMWF (no correction)
-0.179
-0.337
-0.291
-0.303
-0.748
Linear Scaling
-0.004
-0.091
-0.011
-0.011
-0.037
Mean-Variance Scaling (operational)
+0.252
-0.046
-0.005
-0.008
-0.025
Variance Scaling (unbounded)
+0.253
-0.044
-0.005
-0.008
-0.025
Square-root-space Mean-Variance Scaling
+0.278
-0.026
-0.003
-0.002
-0.024
Power Transformation
+0.211
-0.029
-0.006
-0.001
-0.026
Delta Change
+0.125
-0.060
-0.001
+0.011
-0.021
Local Intensity Scaling
+0.058
-0.084
-0.011
-0.011
-0.036
Empirical Quantile Mapping
+0.256
-0.039
-0.018
-0.014
-0.036
Gamma Quantile Mapping
+0.252
-0.029
-0.004
-0.002
-0.024
Detrended Quantile Mapping
-0.003
-0.104
-0.031
-0.017
-0.058
Quantile Delta Mapping
+0.177
-0.130
-0.042
-0.017
-0.073
Scaled Distribution Mapping
-0.060
-0.127
-0.048
-0.029
-0.091
CDF-transform
-0.379
-0.128
-0.036
-0.022
-0.063
MVS with all-zero guard (variant)
+0.252
-0.046
-0.005
-0.008
-0.025
Tercile skill (RPSS, no blend), fit 1993–2016, scored 2017–2025
Method
Feb
Mar
Apr
May
FMAM
Raw ECMWF (no correction)
-0.757
-0.345
-0.356
-0.445
-0.798
Linear Scaling
-0.410
+0.023
+0.010
-0.023
+0.096
Mean-Variance Scaling (operational)
-0.104
+0.049
+0.016
+0.001
+0.099
Variance Scaling (unbounded)
-0.088
+0.059
+0.016
+0.000
+0.099
Square-root-space Mean-Variance Scaling
-0.046
+0.104
+0.025
-0.002
+0.106
Power Transformation
-0.083
+0.096
+0.030
+0.017
+0.110
Delta Change
-0.366
+0.076
-0.011
+0.004
+0.082
Local Intensity Scaling
-0.428
+0.030
+0.010
-0.023
+0.096
Empirical Quantile Mapping
-0.065
+0.078
+0.014
+0.005
+0.085
Gamma Quantile Mapping
-0.057
+0.104
+0.027
+0.005
+0.109
Detrended Quantile Mapping
-0.404
+0.078
-0.002
+0.002
+0.101
Quantile Delta Mapping
-0.203
+0.089
+0.000
+0.002
+0.117
Scaled Distribution Mapping
-0.533
-0.003
-0.016
-0.015
+0.110
CDF-transform
-0.405
+0.076
+0.004
-0.010
+0.102
MVS with all-zero guard (variant)
-0.104
+0.049
+0.016
+0.001
+0.099
Ensemble-mean bias (mm), 1993–2016
Method
Feb
Mar
Apr
May
FMAM
Raw ECMWF (no correction)
-8.5
-27.9
-31.2
-24.8
-92.3
Linear Scaling
+0.7
+0.3
+0.1
+0.0
+0.2
Mean-Variance Scaling (operational)
+0.1
+0.2
-0.0
+0.0
+0.1
Variance Scaling (unbounded)
+0.1
+0.2
-0.0
+0.0
+0.1
Square-root-space Mean-Variance Scaling
+0.1
+0.2
-0.0
+0.0
+0.1
Power Transformation
-0.0
+0.1
-0.0
+0.0
+0.1
Delta Change
+0.1
+0.3
+0.1
+0.0
+0.2
Local Intensity Scaling
-0.1
-0.0
+0.1
+0.0
+0.2
Empirical Quantile Mapping
-0.0
+0.2
-0.0
+0.0
+0.1
Gamma Quantile Mapping
-0.1
+0.1
+0.0
+0.0
+0.1
Detrended Quantile Mapping
+1.0
+1.3
+0.4
+0.3
+0.1
Quantile Delta Mapping
+0.1
+3.1
+1.4
+0.8
+2.2
Scaled Distribution Mapping
-1.0
-6.1
-5.1
-4.4
-4.3
CDF-transform
+4.2
+2.7
+0.9
+0.6
+0.6
MVS with all-zero guard (variant)
+0.1
+0.2
-0.0
+0.0
+0.1
Correlation of the ensemble mean with CHIRPS over years, 1993–2016
Method
Feb
Mar
Apr
May
FMAM
Raw ECMWF (no correction)
+0.49
+0.10
+0.16
+0.17
+0.21
Linear Scaling
+0.45
+0.01
+0.04
+0.03
+0.11
Mean-Variance Scaling (operational)
+0.42
-0.02
+0.02
+0.02
+0.09
Variance Scaling (unbounded)
+0.42
-0.02
+0.02
+0.02
+0.09
Square-root-space Mean-Variance Scaling
+0.43
-0.01
+0.02
+0.02
+0.09
Power Transformation
+0.45
-0.00
+0.02
+0.02
+0.09
Delta Change
+0.46
+0.01
+0.04
+0.03
+0.11
Local Intensity Scaling
+0.45
+0.01
+0.04
+0.03
+0.11
Empirical Quantile Mapping
+0.42
-0.01
+0.01
+0.02
+0.09
Gamma Quantile Mapping
+0.42
-0.01
+0.02
+0.03
+0.09
Detrended Quantile Mapping
+0.46
+0.02
+0.04
+0.04
+0.11
Quantile Delta Mapping
+0.45
+0.03
+0.04
+0.04
+0.12
Scaled Distribution Mapping
+0.44
+0.02
+0.04
+0.03
+0.12
CDF-transform
+0.44
+0.03
+0.04
+0.03
+0.12
MVS with all-zero guard (variant)
+0.42
-0.02
+0.02
+0.02
+0.09
Spread–error ratio, 1993–2016 (1 = spread matches the error)
Score coverage, mean per year, 1993–2016 (share of the region’s area)
Target
Amount cells
Amount area
Probability cells
Probability area
Feb
1120
100%
1018
91%
Mar
1120
100%
1117
100%
Apr
1120
100%
1120
100%
May
1120
100%
1120
100%
FMAM
1120
100%
1120
100%
Dry months: shares of totals at exactly 0 mm and at ≤ 1 mm, CHIRPS and corrected
Area-weighted mean share over cells, pooled leave-one-year-out 1993–2025
Exactly 0 mm
≤ 1 mm
Feb: CHIRPS
0.2%
11.6%
Raw ECMWF (no correction)
9.1%
41.5%
Linear Scaling
9.1%
34.6%
Mean-Variance Scaling (operational)
3.8%
12.4%
Variance Scaling (unbounded)
1.7%
11.8%
Square-root-space Mean-Variance Scaling
0.5%
11.6%
Power Transformation
9.1%
19.1%
Delta Change
0.2%
17.5%
Local Intensity Scaling
17.4%
17.4%
Empirical Quantile Mapping
11.6%
11.6%
Gamma Quantile Mapping
10.0%
13.6%
Detrended Quantile Mapping
11.4%
18.6%
Quantile Delta Mapping
11.7%
14.8%
Scaled Distribution Mapping
34.3%
42.6%
CDF-transform
0.1%
19.9%
MVS with all-zero guard (variant)
3.8%
12.4%
Mar: CHIRPS
0.1%
2.5%
Raw ECMWF (no correction)
1.1%
16.3%
Linear Scaling
1.1%
11.6%
Mean-Variance Scaling (operational)
1.1%
2.0%
Variance Scaling (unbounded)
1.1%
2.0%
Square-root-space Mean-Variance Scaling
0.2%
3.1%
Power Transformation
1.1%
6.0%
Delta Change
0.1%
3.7%
Local Intensity Scaling
3.5%
3.5%
Empirical Quantile Mapping
2.5%
2.5%
Gamma Quantile Mapping
2.5%
4.8%
Detrended Quantile Mapping
2.2%
3.7%
Quantile Delta Mapping
2.5%
3.0%
Scaled Distribution Mapping
17.5%
17.9%
CDF-transform
0.1%
3.9%
MVS with all-zero guard (variant)
1.1%
2.0%
Apr: CHIRPS
0.1%
0.5%
Raw ECMWF (no correction)
0.1%
1.9%
Linear Scaling
0.1%
1.1%
Mean-Variance Scaling (operational)
0.3%
0.3%
Variance Scaling (unbounded)
0.3%
0.3%
Square-root-space Mean-Variance Scaling
0.0%
0.1%
Power Transformation
0.1%
0.2%
Delta Change
0.1%
0.5%
Local Intensity Scaling
0.5%
0.5%
Empirical Quantile Mapping
0.5%
0.5%
Gamma Quantile Mapping
0.5%
0.5%
Detrended Quantile Mapping
0.4%
0.5%
Quantile Delta Mapping
0.5%
0.6%
Scaled Distribution Mapping
2.9%
2.9%
CDF-transform
0.0%
0.4%
MVS with all-zero guard (variant)
0.3%
0.3%
May: CHIRPS
0.4%
1.2%
Raw ECMWF (no correction)
0.1%
2.2%
Linear Scaling
0.1%
1.4%
Mean-Variance Scaling (operational)
0.2%
0.3%
Variance Scaling (unbounded)
0.2%
0.3%
Square-root-space Mean-Variance Scaling
0.0%
0.2%
Power Transformation
0.1%
0.2%
Delta Change
0.4%
1.2%
Local Intensity Scaling
1.2%
1.2%
Empirical Quantile Mapping
1.2%
1.2%
Gamma Quantile Mapping
1.2%
1.3%
Detrended Quantile Mapping
1.1%
1.2%
Quantile Delta Mapping
1.2%
1.3%
Scaled Distribution Mapping
3.7%
3.7%
CDF-transform
0.1%
1.1%
MVS with all-zero guard (variant)
0.2%
0.3%
FMAM: CHIRPS
0.0%
0.0%
Raw ECMWF (no correction)
0.0%
0.0%
Linear Scaling
0.0%
0.0%
Mean-Variance Scaling (operational)
0.0%
0.0%
Variance Scaling (unbounded)
0.0%
0.0%
Square-root-space Mean-Variance Scaling
0.0%
0.0%
Power Transformation
0.0%
0.0%
Delta Change
0.0%
0.0%
Local Intensity Scaling
0.0%
0.0%
Empirical Quantile Mapping
0.0%
0.0%
Gamma Quantile Mapping
0.0%
0.0%
Detrended Quantile Mapping
0.0%
0.0%
Quantile Delta Mapping
0.0%
0.0%
Scaled Distribution Mapping
0.8%
0.8%
CDF-transform
0.0%
0.0%
MVS with all-zero guard (variant)
0.0%
0.0%
Distribution of the corrected members (mean, spread, 10th and 90th percentiles)
Mean of the corrected members / CHIRPS (area-weighted median of cell ratios, 1993–2025; 1 = same)
Method
Feb
Mar
Apr
May
FMAM
Raw ECMWF (no correction)
0.51
0.50
0.68
0.67
0.64
Linear Scaling
1.02
1.00
1.00
1.00
1.00
Mean-Variance Scaling (operational)
1.01
1.00
1.00
1.00
1.00
Variance Scaling (unbounded)
1.01
1.00
1.00
1.00
1.00
Square-root-space Mean-Variance Scaling
1.01
1.00
1.00
1.00
1.00
Power Transformation
1.00
1.00
1.00
1.00
1.00
Delta Change
1.01
1.00
1.00
1.00
1.00
Local Intensity Scaling
1.00
1.00
1.00
1.00
1.00
Empirical Quantile Mapping
1.00
1.00
1.00
1.00
1.00
Gamma Quantile Mapping
1.00
1.00
1.00
1.00
1.00
Detrended Quantile Mapping
1.02
1.01
1.00
1.00
1.00
Quantile Delta Mapping
0.98
1.04
1.01
1.01
1.00
Scaled Distribution Mapping
0.79
0.88
0.96
0.96
0.98
CDF-transform
1.15
1.03
1.01
1.01
1.00
MVS with all-zero guard (variant)
1.01
1.00
1.00
1.00
1.00
Standard deviation of the corrected members / CHIRPS (area-weighted median of cell ratios, 1993–2025; 1 = same)
Method
Feb
Mar
Apr
May
FMAM
Raw ECMWF (no correction)
0.91
0.70
0.77
0.78
0.70
Linear Scaling
1.80
1.41
1.17
1.14
1.09
Mean-Variance Scaling (operational)
1.03
1.00
1.00
1.00
1.00
Variance Scaling (unbounded)
1.03
1.01
1.00
1.00
1.00
Square-root-space Mean-Variance Scaling
1.03
1.03
1.01
1.03
0.99
Power Transformation
1.02
1.00
1.00
1.00
1.00
Delta Change
1.84
1.19
1.06
1.05
1.08
Local Intensity Scaling
1.64
1.37
1.17
1.13
1.09
Empirical Quantile Mapping
1.01
1.00
1.00
1.00
1.00
Gamma Quantile Mapping
0.93
0.99
1.00
1.03
0.98
Detrended Quantile Mapping
1.54
1.11
1.02
1.02
1.02
Quantile Delta Mapping
1.36
1.14
1.04
1.04
1.03
Scaled Distribution Mapping
1.40
0.94
0.92
0.93
0.94
CDF-transform
1.69
1.15
1.05
1.04
1.04
MVS with all-zero guard (variant)
1.03
1.00
1.00
1.00
1.00
10th percentile of the corrected members / CHIRPS (area-weighted median of cell ratios, 1993–2025; 1 = same)
Method
Feb
Mar
Apr
May
FMAM
Raw ECMWF (no correction)
0.02
0.11
0.53
0.63
0.55
Linear Scaling
0.05
0.22
0.75
0.91
0.89
Mean-Variance Scaling (operational)
1.11
1.36
1.01
1.02
0.96
Variance Scaling (unbounded)
1.15
1.33
1.00
1.02
0.96
Square-root-space Mean-Variance Scaling
0.85
0.95
0.96
0.98
0.96
Power Transformation
0.36
0.70
0.93
0.99
0.94
Delta Change
0.30
0.80
0.91
0.93
0.94
Local Intensity Scaling
0.17
0.32
0.76
0.89
0.89
Empirical Quantile Mapping
0.99
0.96
0.94
0.95
0.98
Gamma Quantile Mapping
0.67
0.91
0.96
0.97
0.96
Detrended Quantile Mapping
0.29
0.82
0.92
0.95
0.96
Quantile Delta Mapping
0.50
0.82
0.93
0.95
0.96
Scaled Distribution Mapping
0.00
0.44
0.93
0.95
0.97
CDF-transform
0.23
0.76
0.92
0.96
0.95
MVS with all-zero guard (variant)
1.11
1.36
1.01
1.02
0.96
90th percentile of the corrected members / CHIRPS (area-weighted median of cell ratios, 1993–2025; 1 = same)
Method
Feb
Mar
Apr
May
FMAM
Raw ECMWF (no correction)
0.70
0.60
0.73
0.72
0.66
Linear Scaling
1.41
1.24
1.09
1.07
1.04
Mean-Variance Scaling (operational)
1.02
1.01
1.01
1.01
1.01
Variance Scaling (unbounded)
0.99
1.01
1.01
1.01
1.01
Square-root-space Mean-Variance Scaling
1.08
1.04
1.02
1.03
1.00
Power Transformation
1.14
1.03
1.01
1.01
1.01
Delta Change
1.19
1.08
1.05
1.04
1.04
Local Intensity Scaling
1.26
1.21
1.09
1.07
1.03
Empirical Quantile Mapping
1.06
1.05
1.02
1.02
1.02
Gamma Quantile Mapping
1.01
1.01
1.02
1.03
1.00
Detrended Quantile Mapping
1.33
1.08
1.03
1.03
1.02
Quantile Delta Mapping
1.11
1.11
1.03
1.03
1.02
Scaled Distribution Mapping
0.96
0.93
0.96
0.96
0.98
CDF-transform
1.61
1.11
1.04
1.03
1.02
MVS with all-zero guard (variant)
1.02
1.01
1.01
1.01
1.01
Screening statistics for every method, target and score (within-method and family-wide Holm)
Screening rule (docs/36 rule applied as a screen): a method passes for a target and score if, on the leave-one-year-out 1993-2016 per-year scores, its mean improvement over mvs has a one-sided sign-flip p-value below 0.05 after Holm adjustment, and its mean score over 2017-2025 (fits on 1993-2016) is not worse. 'screen_pass': Holm across the 5 targets of one method. 'screen_pass_family': Holm across every method and target of the benchmark for that score. A screening pass is not an operational adoption decision (see the confirmation run).
Screening statistics, CRPS (method minus Mean-Variance Scaling; negative favours the method)
Method
Target
Δ CRPS 1993–2016 (mm)
95% interval
Years better
p (one-sided)
Holm p (method)
Holm p (all 60)
Δ 2017–2025
Screening
Linear Scaling
Feb
+1.87
+1.47 to +2.31
0/24
1.0000
1.0000
1.0000
+1.54
—
Linear Scaling
Mar
+1.14
+0.13 to +2.05
5/24
0.9840
1.0000
1.0000
+0.44
—
Linear Scaling
Apr
+0.31
-0.16 to +0.75
9/24
0.8957
1.0000
1.0000
+0.34
—
Linear Scaling
May
+0.23
-0.20 to +0.62
7/24
0.8608
1.0000
1.0000
+0.28
—
Linear Scaling
FMAM
+0.83
-0.21 to +1.79
6/24
0.9342
1.0000
1.0000
-0.87
—
Variance Scaling (unbounded)
Feb
-0.04
-0.07 to -0.01
20/24
0.0098
0.0491
0.5797
-0.01
✓
Variance Scaling (unbounded)
Mar
-0.03
-0.06 to +0.01
15/24
0.0625
0.2500
1.0000
-0.06
—
Variance Scaling (unbounded)
Apr
-0.00
-0.04 to +0.02
10/24
0.3800
1.0000
1.0000
-0.01
—
Variance Scaling (unbounded)
May
+0.01
-0.01 to +0.03
10/24
0.8918
1.0000
1.0000
+0.03
—
Variance Scaling (unbounded)
FMAM
+0.03
-0.01 to +0.06
7/24
0.9352
1.0000
1.0000
+0.03
—
Square-root-space Mean-Variance Scaling
Feb
-0.18
-0.29 to -0.07
20/24
0.0026
0.0132
0.1578
-0.10
✓
Square-root-space Mean-Variance Scaling
Mar
-0.34
-0.63 to -0.08
16/24
0.0112
0.0448
0.6493
-0.46
✓
Square-root-space Mean-Variance Scaling
Apr
-0.05
-0.16 to +0.06
15/24
0.1964
0.4568
1.0000
-0.15
—
Square-root-space Mean-Variance Scaling
May
-0.08
-0.26 to +0.09
10/24
0.1950
0.4568
1.0000
+0.07
—
Square-root-space Mean-Variance Scaling
FMAM
-0.06
-0.18 to +0.05
14/24
0.1523
0.4568
1.0000
-0.14
—
Power Transformation
Feb
+0.26
+0.07 to +0.46
5/24
0.9912
1.0000
1.0000
+0.27
—
Power Transformation
Mar
-0.28
-0.70 to +0.14
14/24
0.1058
0.4230
1.0000
-0.36
—
Power Transformation
Apr
+0.03
-0.12 to +0.18
13/24
0.6338
1.0000
1.0000
-0.21
—
Power Transformation
May
-0.14
-0.27 to -0.01
15/24
0.0251
0.1253
1.0000
-0.19
—
Power Transformation
FMAM
+0.08
-0.09 to +0.26
7/24
0.8180
1.0000
1.0000
-0.21
—
Delta Change
Feb
+1.02
+0.71 to +1.34
3/24
1.0000
1.0000
1.0000
+1.03
—
Delta Change
Mar
+0.44
-0.35 to +1.18
8/24
0.8573
1.0000
1.0000
-0.67
—
Delta Change
Apr
-0.03
-0.56 to +0.51
11/24
0.4567
1.0000
1.0000
+0.24
—
Delta Change
May
-0.25
-0.62 to +0.11
13/24
0.0996
0.4978
1.0000
-0.21
—
Delta Change
FMAM
+0.17
-0.95 to +1.21
9/24
0.6096
1.0000
1.0000
-0.22
—
Local Intensity Scaling
Feb
+1.38
+1.10 to +1.64
1/24
1.0000
1.0000
1.0000
+1.26
—
Local Intensity Scaling
Mar
+0.97
-0.01 to +1.84
5/24
0.9718
1.0000
1.0000
+0.36
—
Local Intensity Scaling
Apr
+0.29
-0.18 to +0.71
9/24
0.8826
1.0000
1.0000
+0.31
—
Local Intensity Scaling
May
+0.22
-0.20 to +0.60
8/24
0.8524
1.0000
1.0000
+0.27
—
Local Intensity Scaling
FMAM
+0.79
-0.23 to +1.74
6/24
0.9285
1.0000
1.0000
-0.87
—
Empirical Quantile Mapping
Feb
-0.06
-0.25 to +0.15
15/24
0.2912
1.0000
1.0000
-0.06
—
Empirical Quantile Mapping
Mar
-0.11
-0.46 to +0.23
14/24
0.2748
1.0000
1.0000
-0.16
—
Empirical Quantile Mapping
Apr
+0.33
+0.16 to +0.52
5/24
0.9995
1.0000
1.0000
+0.11
—
Empirical Quantile Mapping
May
+0.18
-0.11 to +0.45
9/24
0.8920
1.0000
1.0000
+0.13
—
Empirical Quantile Mapping
FMAM
+0.55
+0.31 to +0.81
5/24
0.9998
1.0000
1.0000
+0.69
—
Gamma Quantile Mapping
Feb
-0.03
-0.18 to +0.12
13/24
0.3439
0.9859
1.0000
-0.02
—
Gamma Quantile Mapping
Mar
-0.31
-0.60 to -0.05
15/24
0.0190
0.0948
1.0000
-0.40
—
Gamma Quantile Mapping
Apr
-0.04
-0.15 to +0.08
14/24
0.2778
0.9859
1.0000
-0.19
—
Gamma Quantile Mapping
May
-0.06
-0.26 to +0.12
10/24
0.2703
0.9859
1.0000
+0.12
—
Gamma Quantile Mapping
FMAM
-0.07
-0.25 to +0.12
13/24
0.2465
0.9859
1.0000
-0.14
—
Detrended Quantile Mapping
Feb
+1.76
+1.13 to +2.49
2/24
1.0000
1.0000
1.0000
+1.16
—
Detrended Quantile Mapping
Mar
+1.10
-0.08 to +2.33
8/24
0.9548
1.0000
1.0000
-0.53
—
Detrended Quantile Mapping
Apr
+0.68
+0.03 to +1.52
8/24
0.9562
1.0000
1.0000
+0.25
—
Detrended Quantile Mapping
May
+0.35
-0.05 to +0.75
7/24
0.9542
1.0000
1.0000
+0.01
—
Detrended Quantile Mapping
FMAM
+1.44
+0.41 to +2.54
7/24
0.9904
1.0000
1.0000
-0.04
—
Quantile Delta Mapping
Feb
+0.56
+0.19 to +0.98
6/24
0.9962
1.0000
1.0000
+0.56
—
Quantile Delta Mapping
Mar
+1.59
+0.11 to +3.29
6/24
0.9660
1.0000
1.0000
-0.55
—
Quantile Delta Mapping
Apr
+1.00
+0.15 to +2.11
8/24
0.9778
1.0000
1.0000
+0.29
—
Quantile Delta Mapping
May
+0.41
-0.05 to +0.88
8/24
0.9535
1.0000
1.0000
-0.01
—
Quantile Delta Mapping
FMAM
+2.09
+0.90 to +3.45
5/24
0.9989
1.0000
1.0000
-0.22
—
Scaled Distribution Mapping
Feb
+2.18
+1.63 to +2.80
0/24
1.0000
1.0000
1.0000
+1.84
—
Scaled Distribution Mapping
Mar
+1.43
+0.10 to +2.84
6/24
0.9729
1.0000
1.0000
+0.68
—
Scaled Distribution Mapping
Apr
+1.04
+0.45 to +1.65
6/24
0.9987
1.0000
1.0000
+0.67
—
Scaled Distribution Mapping
May
+0.55
+0.03 to +1.09
7/24
0.9698
1.0000
1.0000
+0.09
—
Scaled Distribution Mapping
FMAM
+2.64
+1.21 to +4.21
5/24
0.9991
1.0000
1.0000
+0.46
—
CDF-transform
Feb
+4.17
+1.84 to +7.59
2/24
1.0000
1.0000
1.0000
+1.87
—
CDF-transform
Mar
+1.57
+0.21 to +3.07
7/24
0.9794
1.0000
1.0000
-0.51
—
CDF-transform
Apr
+0.84
+0.07 to +1.83
8/24
0.9631
1.0000
1.0000
+0.31
—
CDF-transform
May
+0.49
+0.09 to +0.88
7/24
0.9890
1.0000
1.0000
+0.18
—
CDF-transform
FMAM
+1.72
+0.56 to +2.99
7/24
0.9945
1.0000
1.0000
-0.09
—
MVS with all-zero guard (variant)
Feb
+0.00
+0.00 to +0.00
0/24
1.0000
1.0000
— (variant)
+0.00
—
MVS with all-zero guard (variant)
Mar
+0.00
+0.00 to +0.00
0/24
1.0000
1.0000
— (variant)
+0.00
—
MVS with all-zero guard (variant)
Apr
+0.00
+0.00 to +0.00
0/24
1.0000
1.0000
— (variant)
+0.00
—
MVS with all-zero guard (variant)
May
+0.00
+0.00 to +0.00
0/24
1.0000
1.0000
— (variant)
+0.00
—
MVS with all-zero guard (variant)
FMAM
+0.00
+0.00 to +0.00
0/24
1.0000
1.0000
— (variant)
+0.00
—
Screening statistics, fair CRPS (method minus Mean-Variance Scaling; negative favours the method)
Method
Target
Δ fair CRPS 1993–2016 (mm)
95% interval
Years better
p (one-sided)
Holm p (method)
Holm p (all 60)
Δ 2017–2025
Screening
Linear Scaling
Feb
+1.75
+1.36 to +2.16
1/24
1.0000
1.0000
1.0000
+1.49
—
Linear Scaling
Mar
+0.82
-0.19 to +1.71
6/24
0.9432
1.0000
1.0000
+0.28
—
Linear Scaling
Apr
+0.12
-0.36 to +0.56
9/24
0.6778
1.0000
1.0000
+0.23
—
Linear Scaling
May
+0.12
-0.31 to +0.51
9/24
0.7129
1.0000
1.0000
+0.22
—
Linear Scaling
FMAM
+0.51
-0.53 to +1.49
7/24
0.8272
1.0000
1.0000
-1.02
—
Variance Scaling (unbounded)
Feb
-0.04
-0.07 to -0.00
20/24
0.0138
0.0690
0.7731
-0.01
—
Variance Scaling (unbounded)
Mar
-0.03
-0.07 to -0.00
17/24
0.0278
0.1114
1.0000
-0.07
—
Variance Scaling (unbounded)
Apr
-0.01
-0.04 to +0.02
11/24
0.2115
0.6344
1.0000
-0.01
—
Variance Scaling (unbounded)
May
+0.01
-0.01 to +0.02
11/24
0.6999
1.0000
1.0000
+0.03
—
Variance Scaling (unbounded)
FMAM
+0.02
-0.01 to +0.05
9/24
0.8296
1.0000
1.0000
+0.02
—
Square-root-space Mean-Variance Scaling
Feb
-0.19
-0.30 to -0.07
19/24
0.0021
0.0106
0.1266
-0.10
✓
Square-root-space Mean-Variance Scaling
Mar
-0.40
-0.69 to -0.13
17/24
0.0044
0.0175
0.2587
-0.48
✓
Square-root-space Mean-Variance Scaling
Apr
-0.09
-0.19 to +0.02
16/24
0.0696
0.2088
1.0000
-0.17
—
Square-root-space Mean-Variance Scaling
May
-0.13
-0.31 to +0.03
13/24
0.0739
0.2088
1.0000
+0.04
—
Square-root-space Mean-Variance Scaling
FMAM
-0.06
-0.17 to +0.06
13/24
0.1819
0.2088
1.0000
-0.14
—
Power Transformation
Feb
+0.24
+0.05 to +0.45
6/24
0.9848
1.0000
1.0000
+0.25
—
Power Transformation
Mar
-0.34
-0.77 to +0.09
14/24
0.0714
0.2855
1.0000
-0.39
—
Power Transformation
Apr
+0.00
-0.14 to +0.16
15/24
0.5076
1.0000
1.0000
-0.22
—
Power Transformation
May
-0.16
-0.30 to -0.03
15/24
0.0132
0.0659
0.7513
-0.20
—
Power Transformation
FMAM
+0.06
-0.12 to +0.24
8/24
0.7506
1.0000
1.0000
-0.22
—
Delta Change
Feb
+0.90
+0.60 to +1.19
3/24
1.0000
1.0000
1.0000
+0.88
—
Delta Change
Mar
+0.26
-0.52 to +1.01
10/24
0.7361
1.0000
1.0000
-1.13
—
Delta Change
Apr
-0.22
-0.74 to +0.32
13/24
0.2229
0.8915
1.0000
-0.40
—
Delta Change
May
-0.44
-0.81 to -0.07
15/24
0.0164
0.0819
0.9006
-0.85
—
Delta Change
FMAM
-0.18
-1.31 to +0.87
11/24
0.3797
1.0000
1.0000
-1.32
—
Local Intensity Scaling
Feb
+1.29
+1.02 to +1.55
1/24
1.0000
1.0000
1.0000
+1.22
—
Local Intensity Scaling
Mar
+0.67
-0.31 to +1.53
6/24
0.9114
1.0000
1.0000
+0.22
—
Local Intensity Scaling
Apr
+0.10
-0.37 to +0.52
9/24
0.6536
1.0000
1.0000
+0.22
—
Local Intensity Scaling
May
+0.12
-0.31 to +0.50
9/24
0.7091
1.0000
1.0000
+0.22
—
Local Intensity Scaling
FMAM
+0.48
-0.54 to +1.44
7/24
0.8170
1.0000
1.0000
-1.02
—
Empirical Quantile Mapping
Feb
-0.06
-0.25 to +0.15
15/24
0.2996
1.0000
1.0000
-0.06
—
Empirical Quantile Mapping
Mar
-0.14
-0.50 to +0.20
14/24
0.2172
1.0000
1.0000
-0.18
—
Empirical Quantile Mapping
Apr
+0.32
+0.14 to +0.50
5/24
0.9991
1.0000
1.0000
+0.10
—
Empirical Quantile Mapping
May
+0.16
-0.13 to +0.44
10/24
0.8620
1.0000
1.0000
+0.12
—
Empirical Quantile Mapping
FMAM
+0.57
+0.33 to +0.83
6/24
0.9999
1.0000
1.0000
+0.70
—
Gamma Quantile Mapping
Feb
-0.03
-0.18 to +0.12
12/24
0.3339
0.6484
1.0000
-0.02
—
Gamma Quantile Mapping
Mar
-0.36
-0.65 to -0.09
16/24
0.0102
0.0511
0.5928
-0.42
—
Gamma Quantile Mapping
Apr
-0.07
-0.18 to +0.05
16/24
0.1378
0.4726
1.0000
-0.20
—
Gamma Quantile Mapping
May
-0.12
-0.32 to +0.06
11/24
0.1182
0.4726
1.0000
+0.09
—
Gamma Quantile Mapping
FMAM
-0.05
-0.23 to +0.14
13/24
0.3242
0.6484
1.0000
-0.13
—
Detrended Quantile Mapping
Feb
+1.76
+1.13 to +2.48
2/24
1.0000
1.0000
1.0000
+1.16
—
Detrended Quantile Mapping
Mar
+1.05
-0.13 to +2.27
9/24
0.9478
1.0000
1.0000
-0.55
—
Detrended Quantile Mapping
Apr
+0.66
+0.01 to +1.49
8/24
0.9489
1.0000
1.0000
+0.24
—
Detrended Quantile Mapping
May
+0.32
-0.07 to +0.71
7/24
0.9393
1.0000
1.0000
-0.00
—
Detrended Quantile Mapping
FMAM
+1.44
+0.41 to +2.54
7/24
0.9905
1.0000
1.0000
-0.03
—
Quantile Delta Mapping
Feb
+0.52
+0.15 to +0.93
6/24
0.9935
1.0000
1.0000
+0.55
—
Quantile Delta Mapping
Mar
+1.54
+0.06 to +3.23
6/24
0.9607
1.0000
1.0000
-0.57
—
Quantile Delta Mapping
Apr
+0.97
+0.12 to +2.07
8/24
0.9712
1.0000
1.0000
+0.28
—
Quantile Delta Mapping
May
+0.37
-0.10 to +0.83
8/24
0.9297
1.0000
1.0000
-0.02
—
Quantile Delta Mapping
FMAM
+2.10
+0.91 to +3.47
5/24
0.9989
1.0000
1.0000
-0.20
—
Scaled Distribution Mapping
Feb
+2.16
+1.63 to +2.75
0/24
1.0000
1.0000
1.0000
+1.86
—
Scaled Distribution Mapping
Mar
+1.50
+0.16 to +2.91
6/24
0.9776
1.0000
1.0000
+0.70
—
Scaled Distribution Mapping
Apr
+1.13
+0.54 to +1.74
4/24
0.9994
1.0000
1.0000
+0.71
—
Scaled Distribution Mapping
May
+0.63
+0.10 to +1.17
6/24
0.9843
1.0000
1.0000
+0.12
—
Scaled Distribution Mapping
FMAM
+2.86
+1.43 to +4.45
5/24
0.9995
1.0000
1.0000
+0.55
—
CDF-transform
Feb
+4.19
+1.84 to +7.61
2/24
1.0000
1.0000
1.0000
+1.87
—
CDF-transform
Mar
+1.51
+0.15 to +3.01
8/24
0.9753
1.0000
1.0000
-0.53
—
CDF-transform
Apr
+0.80
+0.03 to +1.80
8/24
0.9550
1.0000
1.0000
+0.30
—
CDF-transform
May
+0.46
+0.07 to +0.85
7/24
0.9855
1.0000
1.0000
+0.17
—
CDF-transform
FMAM
+1.72
+0.55 to +2.99
7/24
0.9943
1.0000
1.0000
-0.08
—
MVS with all-zero guard (variant)
Feb
+0.00
+0.00 to +0.00
0/24
1.0000
1.0000
— (variant)
+0.00
—
MVS with all-zero guard (variant)
Mar
+0.00
+0.00 to +0.00
0/24
1.0000
1.0000
— (variant)
+0.00
—
MVS with all-zero guard (variant)
Apr
+0.00
+0.00 to +0.00
0/24
1.0000
1.0000
— (variant)
+0.00
—
MVS with all-zero guard (variant)
May
+0.00
+0.00 to +0.00
0/24
1.0000
1.0000
— (variant)
+0.00
—
MVS with all-zero guard (variant)
FMAM
+0.00
+0.00 to +0.00
0/24
1.0000
1.0000
— (variant)
+0.00
—
Screening statistics, RPS (no blend) (method minus Mean-Variance Scaling; negative favours the method)
Method
Target
Δ RPS (no blend) 1993–2016
95% interval
Years better
p (one-sided)
Holm p (method)
Holm p (all 60)
Δ 2017–2025
Screening
Linear Scaling
Feb
+0.0048
-0.0565 to +0.0655
11/24
0.5573
1.0000
1.0000
+0.1243
—
Linear Scaling
Mar
-0.0146
-0.0495 to +0.0187
11/24
0.2105
1.0000
1.0000
+0.0018
—
Linear Scaling
Apr
-0.0005
-0.0071 to +0.0054
11/24
0.4385
1.0000
1.0000
+0.0030
—
Linear Scaling
May
-0.0012
-0.0120 to +0.0085
9/24
0.4108
1.0000
1.0000
+0.0099
—
Linear Scaling
FMAM
+0.0014
-0.0034 to +0.0060
10/24
0.7151
1.0000
1.0000
+0.0008
—
Variance Scaling (unbounded)
Feb
+0.0024
-0.0080 to +0.0129
10/24
0.6630
0.7444
1.0000
-0.0161
—
Variance Scaling (unbounded)
Mar
-0.0009
-0.0027 to +0.0011
14/24
0.1848
0.7390
1.0000
-0.0021
—
Variance Scaling (unbounded)
Apr
-0.0008
-0.0023 to +0.0004
11/24
0.1196
0.5979
1.0000
-0.0001
—
Variance Scaling (unbounded)
May
-0.0001
-0.0005 to +0.0002
14/24
0.2148
0.7390
1.0000
+0.0004
—
Variance Scaling (unbounded)
FMAM
-0.0001
-0.0005 to +0.0004
13/24
0.3722
0.7444
1.0000
+0.0003
—
Square-root-space Mean-Variance Scaling
Feb
-0.0644
-0.0891 to -0.0401
21/24
0.0000
0.0001
0.0006
-0.0334
✓✓
Square-root-space Mean-Variance Scaling
Mar
-0.0337
-0.0467 to -0.0211
21/24
0.0000
0.0001
0.0006
-0.0258
✓✓
Square-root-space Mean-Variance Scaling
Apr
-0.0009
-0.0027 to +0.0011
14/24
0.1925
0.3849
1.0000
-0.0041
—
Square-root-space Mean-Variance Scaling
May
-0.0044
-0.0094 to +0.0001
11/24
0.0448
0.1344
1.0000
+0.0025
—
Square-root-space Mean-Variance Scaling
FMAM
-0.0005
-0.0028 to +0.0019
12/24
0.3587
0.3849
1.0000
-0.0026
—
Power Transformation
Feb
-0.0520
-0.0810 to -0.0243
18/24
0.0006
0.0022
0.0311
-0.0251
✓✓
Power Transformation
Mar
-0.0280
-0.0415 to -0.0142
18/24
0.0004
0.0020
0.0232
-0.0216
✓✓
Power Transformation
Apr
+0.0006
-0.0047 to +0.0065
14/24
0.5814
1.0000
1.0000
-0.0067
—
Power Transformation
May
-0.0046
-0.0086 to -0.0009
15/24
0.0136
0.0409
0.7093
-0.0054
✓
Power Transformation
FMAM
+0.0005
-0.0034 to +0.0042
11/24
0.5959
1.0000
1.0000
-0.0040
—
Delta Change
Feb
-0.0006
-0.0603 to +0.0597
11/24
0.4911
1.0000
1.0000
+0.1017
—
Delta Change
Mar
-0.0121
-0.0442 to +0.0196
11/24
0.2368
0.9723
1.0000
-0.0183
—
Delta Change
Apr
+0.0003
-0.0084 to +0.0086
9/24
0.5306
1.0000
1.0000
+0.0078
—
Delta Change
May
-0.0057
-0.0181 to +0.0062
13/24
0.1945
0.9723
1.0000
-0.0012
—
Delta Change
FMAM
+0.0021
-0.0088 to +0.0136
10/24
0.6343
1.0000
1.0000
+0.0045
—
Local Intensity Scaling
Feb
+0.0070
-0.0553 to +0.0699
11/24
0.5829
1.0000
1.0000
+0.1259
—
Local Intensity Scaling
Mar
-0.0150
-0.0513 to +0.0189
11/24
0.2116
1.0000
1.0000
-0.0012
—
Local Intensity Scaling
Apr
-0.0004
-0.0069 to +0.0054
10/24
0.4494
1.0000
1.0000
+0.0030
—
Local Intensity Scaling
May
-0.0008
-0.0117 to +0.0089
9/24
0.4391
1.0000
1.0000
+0.0100
—
Local Intensity Scaling
FMAM
+0.0014
-0.0033 to +0.0058
10/24
0.7109
1.0000
1.0000
+0.0008
—
Empirical Quantile Mapping
Feb
-0.0580
-0.0861 to -0.0296
18/24
0.0004
0.0020
0.0232
-0.0229
✓✓
Empirical Quantile Mapping
Mar
-0.0253
-0.0442 to -0.0076
14/24
0.0073
0.0294
0.3890
-0.0165
✓
Empirical Quantile Mapping
Apr
+0.0046
-0.0003 to +0.0099
10/24
0.9522
1.0000
1.0000
+0.0011
—
Empirical Quantile Mapping
May
+0.0009
-0.0053 to +0.0071
11/24
0.6134
1.0000
1.0000
-0.0009
—
Empirical Quantile Mapping
FMAM
+0.0045
+0.0002 to +0.0090
7/24
0.9683
1.0000
1.0000
+0.0066
—
Gamma Quantile Mapping
Feb
-0.0370
-0.0594 to -0.0156
18/24
0.0011
0.0053
0.0588
-0.0359
✓
Gamma Quantile Mapping
Mar
-0.0221
-0.0357 to -0.0085
16/24
0.0024
0.0097
0.1304
-0.0260
✓
Gamma Quantile Mapping
Apr
-0.0006
-0.0037 to +0.0028
14/24
0.3640
0.7281
1.0000
-0.0055
—
Gamma Quantile Mapping
May
-0.0040
-0.0077 to -0.0006
16/24
0.0190
0.0571
0.9708
-0.0005
—
Gamma Quantile Mapping
FMAM
-0.0006
-0.0044 to +0.0032
10/24
0.3933
0.7281
1.0000
-0.0036
—
Detrended Quantile Mapping
Feb
+0.0057
-0.0519 to +0.0653
11/24
0.5723
1.0000
1.0000
+0.1099
—
Detrended Quantile Mapping
Mar
-0.0031
-0.0360 to +0.0291
12/24
0.4265
1.0000
1.0000
-0.0147
—
Detrended Quantile Mapping
Apr
+0.0109
-0.0018 to +0.0266
8/24
0.9177
1.0000
1.0000
+0.0072
—
Detrended Quantile Mapping
May
+0.0034
-0.0066 to +0.0131
9/24
0.7404
1.0000
1.0000
-0.0017
—
Detrended Quantile Mapping
FMAM
+0.0125
+0.0003 to +0.0259
11/24
0.9621
1.0000
1.0000
-0.0020
—
Quantile Delta Mapping
Feb
-0.0127
-0.0666 to +0.0408
11/24
0.3246
1.0000
1.0000
+0.0386
—
Quantile Delta Mapping
Mar
-0.0065
-0.0370 to +0.0226
11/24
0.3405
1.0000
1.0000
-0.0180
—
Quantile Delta Mapping
Apr
+0.0148
-0.0005 to +0.0334
8/24
0.9457
1.0000
1.0000
+0.0066
—
Quantile Delta Mapping
May
+0.0047
-0.0062 to +0.0149
9/24
0.7985
1.0000
1.0000
-0.0017
—
Quantile Delta Mapping
FMAM
+0.0176
+0.0044 to +0.0315
9/24
0.9879
1.0000
1.0000
-0.0083
—
Scaled Distribution Mapping
Feb
+0.0579
-0.0184 to +0.1357
9/24
0.9180
1.0000
1.0000
+0.1757
—
Scaled Distribution Mapping
Mar
+0.0200
-0.0265 to +0.0668
9/24
0.7928
1.0000
1.0000
+0.0130
—
Scaled Distribution Mapping
Apr
+0.0166
+0.0037 to +0.0305
10/24
0.9878
1.0000
1.0000
+0.0127
—
Scaled Distribution Mapping
May
+0.0100
-0.0039 to +0.0244
8/24
0.9054
1.0000
1.0000
+0.0042
—
Scaled Distribution Mapping
FMAM
+0.0227
+0.0057 to +0.0405
7/24
0.9892
1.0000
1.0000
-0.0069
—
CDF-transform
Feb
+0.0194
-0.0382 to +0.0800
12/24
0.7331
1.0000
1.0000
+0.1083
—
CDF-transform
Mar
+0.0028
-0.0311 to +0.0367
12/24
0.5622
1.0000
1.0000
-0.0096
—
CDF-transform
Apr
+0.0127
-0.0011 to +0.0296
8/24
0.9353
1.0000
1.0000
+0.0054
—
CDF-transform
May
+0.0057
-0.0038 to +0.0148
9/24
0.8763
1.0000
1.0000
+0.0040
—
CDF-transform
FMAM
+0.0158
+0.0039 to +0.0297
10/24
0.9876
1.0000
1.0000
-0.0018
—
MVS with all-zero guard (variant)
Feb
+0.0000
+0.0000 to +0.0000
0/24
1.0000
1.0000
— (variant)
+0.0000
—
MVS with all-zero guard (variant)
Mar
+0.0000
+0.0000 to +0.0000
0/24
1.0000
1.0000
— (variant)
+0.0000
—
MVS with all-zero guard (variant)
Apr
+0.0000
+0.0000 to +0.0000
0/24
1.0000
1.0000
— (variant)
+0.0000
—
MVS with all-zero guard (variant)
May
+0.0000
+0.0000 to +0.0000
0/24
1.0000
1.0000
— (variant)
+0.0000
—
MVS with all-zero guard (variant)
FMAM
+0.0000
+0.0000 to +0.0000
0/24
1.0000
1.0000
— (variant)
+0.0000
—
How often limits, caps and fallbacks act
How often limits, caps and fallbacks act, leave-one-year-out 1993–2016 (mean over folds)
Method
Target
Activated (share of the corrected area, or of members / cells for events)
Linear Scaling
Feb
mean fallback: 0.0% of the area
Mean-Variance Scaling (operational)
Feb
sd fallback: 0.2% of the area; ratio lower limit: 31.5% of the area; ratio upper limit: 2.7% of the area; clipped at zero: 5.1%
Mean-Variance Scaling (operational)
Mar
ratio lower limit: 3.8% of the area; ratio upper limit: 5.5% of the area; clipped at zero: 2.4%
Mean-Variance Scaling (operational)
Apr
ratio lower limit: 0.3% of the area; ratio upper limit: 4.7% of the area; clipped at zero: 0.4%
Mean-Variance Scaling (operational)
May
ratio lower limit: 0.2% of the area; ratio upper limit: 4.3% of the area; clipped at zero: 0.4%
Mean-Variance Scaling (operational)
FMAM
ratio lower limit: 0.1% of the area; ratio upper limit: 3.3% of the area; clipped at zero: 0.0%
Variance Scaling (unbounded)
Feb
sd fallback: 0.2% of the area; clipped at zero: 1.4%
Variance Scaling (unbounded)
Mar
clipped at zero: 1.4%
Variance Scaling (unbounded)
Apr
clipped at zero: 0.4%
Variance Scaling (unbounded)
May
clipped at zero: 0.4%
Variance Scaling (unbounded)
FMAM
clipped at zero: 0.0%
Square-root-space Mean-Variance Scaling
Feb
ratio lower limit: 30.0% of the area; clipped at zero: 0.8%
Square-root-space Mean-Variance Scaling
Mar
ratio lower limit: 0.5% of the area; ratio upper limit: 0.1% of the area; clipped at zero: 0.5%
Square-root-space Mean-Variance Scaling
Apr
ratio lower limit: 0.1% of the area; clipped at zero: 0.1%
Square-root-space Mean-Variance Scaling
May
ratio lower limit: 0.0% of the area; ratio upper limit: 0.0% of the area; clipped at zero: 0.0%
Square-root-space Mean-Variance Scaling
FMAM
ratio lower limit: 0.0% of the area; clipped at zero: 0.0%
Power Transformation
Feb
b at bound: 12.6% of the area
Delta Change
Feb
mean fallback: 0.0% of the area; ratio capped: 18.2%
Delta Change
Mar
ratio capped: 1.1%
Local Intensity Scaling
Feb
always wet: 83.0% of the area; never wet: 2.8% of the area
Local Intensity Scaling
Mar
always wet: 88.6% of the area
Local Intensity Scaling
Apr
always wet: 85.7% of the area
Local Intensity Scaling
May
always wet: 90.6% of the area
Local Intensity Scaling
FMAM
always wet: 100.0% of the area
Empirical Quantile Mapping
Feb
model has dry: 100.0% of the area; obs has dry: 17.0% of the area; extrapolated: 0.4%
Empirical Quantile Mapping
Mar
model has dry: 97.8% of the area; obs has dry: 11.4% of the area; extrapolated: 0.2%
Empirical Quantile Mapping
Apr
model has dry: 59.8% of the area; obs has dry: 14.3% of the area; extrapolated: 0.3%
Empirical Quantile Mapping
May
model has dry: 24.9% of the area; obs has dry: 9.4% of the area; extrapolated: 0.3%
Empirical Quantile Mapping
FMAM
model has dry: 3.0% of the area; extrapolated: 0.4%
Gamma Quantile Mapping
Feb
gamma fallback: 3.6% of the area; model has dry: 100.0% of the area; obs has dry: 17.0% of the area
Gamma Quantile Mapping
Mar
gamma fallback: 0.1% of the area; model has dry: 97.8% of the area; obs has dry: 11.4% of the area
Gamma Quantile Mapping
Apr
model has dry: 59.8% of the area; obs has dry: 14.3% of the area
Gamma Quantile Mapping
May
model has dry: 24.9% of the area; obs has dry: 9.4% of the area
Gamma Quantile Mapping
FMAM
model has dry: 3.0% of the area
Detrended Quantile Mapping
Feb
model has dry: 100.0% of the area; obs has dry: 17.0% of the area; ratio capped: 18.2%; extrapolated: 0.1%
Detrended Quantile Mapping
Mar
model has dry: 97.8% of the area; obs has dry: 11.4% of the area; ratio capped: 1.1%; extrapolated: 0.2%
Detrended Quantile Mapping
Apr
model has dry: 59.8% of the area; obs has dry: 14.3% of the area; extrapolated: 0.2%
Detrended Quantile Mapping
May
model has dry: 24.9% of the area; obs has dry: 9.4% of the area; extrapolated: 0.2%
Detrended Quantile Mapping
FMAM
model has dry: 3.0% of the area; extrapolated: 0.2%
Quantile Delta Mapping
Feb
model has dry: 100.0% of the area; obs has dry: 17.0% of the area; low denominator: 42.4%; ratio capped: 4.6%
Quantile Delta Mapping
Mar
model has dry: 97.8% of the area; obs has dry: 11.4% of the area; low denominator: 18.4%; ratio capped: 0.8%
Quantile Delta Mapping
Apr
model has dry: 59.8% of the area; obs has dry: 14.3% of the area; low denominator: 2.6%; ratio capped: 0.2%
Quantile Delta Mapping
May
model has dry: 24.9% of the area; obs has dry: 9.4% of the area; low denominator: 2.2%; ratio capped: 0.0%
Quantile Delta Mapping
FMAM
model has dry: 3.0% of the area; ratio capped: 0.1%
Scaled Distribution Mapping
Feb
gamma fallback: 6.3% of the area; linear scaling fallback: 17.6%
Scaled Distribution Mapping
Mar
gamma fallback: 0.1% of the area; linear scaling fallback: 0.4%
CDF-transform
Feb
mean fallback: 0.0% of the area; at forecast range edge: 0.6%
CDF-transform
Mar
at forecast range edge: 1.0%
CDF-transform
Apr
at forecast range edge: 2.4%
CDF-transform
May
at forecast range edge: 4.8%
CDF-transform
FMAM
at forecast range edge: 2.2%
MVS with all-zero guard (variant)
Feb
sd fallback: 0.2% of the area; ratio lower limit: 31.5% of the area; ratio upper limit: 2.7% of the area; clipped at zero: 5.1%
MVS with all-zero guard (variant)
Mar
ratio lower limit: 3.8% of the area; ratio upper limit: 5.5% of the area; clipped at zero: 2.4%
MVS with all-zero guard (variant)
Apr
ratio lower limit: 0.3% of the area; ratio upper limit: 4.7% of the area; clipped at zero: 0.4%
MVS with all-zero guard (variant)
May
ratio lower limit: 0.2% of the area; ratio upper limit: 4.3% of the area; clipped at zero: 0.4%
MVS with all-zero guard (variant)
FMAM
ratio lower limit: 0.1% of the area; ratio upper limit: 3.3% of the area; clipped at zero: 0.0%
Where the amount differences come from: cells grouped by their training-year climate
Each cell is grouped by its CHIRPS totals in the fold’s training years only: every year exactly 0 mm; every year ≤ 1 mm (not all 0); some years dry and some wet; never dry. Contributions are area-weighted CRPS differences from Mean-Variance Scaling (mm; negative favours the method) and add up to the national difference. Leave-one-year-out 1993–2016, All Ethiopia.
Feb: contributions to the CRPS difference from Mean-Variance Scaling (mm)
Method
Total Δ CRPS
all 0 mm 0.0% of area
all ≤ 1 mm 2.8% of area
mixed 14.2% of area
always wet 83.0% of area
Linear Scaling
+1.865
+0.000
+0.000
+0.021
+1.844
Variance Scaling (unbounded)
-0.042
+0.000
-0.002
-0.006
-0.033
Square-root-space Mean-Variance Scaling
-0.184
+0.000
-0.001
-0.012
-0.171
Power Transformation
+0.261
+0.000
-0.001
+0.000
+0.262
Delta Change
+1.024
+0.000
+0.000
-0.015
+1.038
Local Intensity Scaling
+1.377
+0.000
+0.001
+0.017
+1.358
Empirical Quantile Mapping
-0.056
+0.000
+0.001
+0.013
-0.071
Gamma Quantile Mapping
-0.031
+0.000
+0.001
+0.017
-0.049
Detrended Quantile Mapping
+1.764
+0.000
+0.001
+0.017
+1.746
Quantile Delta Mapping
+0.562
+0.000
+0.001
-0.010
+0.571
Scaled Distribution Mapping
+2.177
+0.000
+0.000
+0.009
+2.167
CDF-transform
+4.174
+0.000
+0.005
+0.142
+4.028
MVS with all-zero guard (variant)
+0.000
+0.000
+0.000
+0.000
+0.000
Mar: contributions to the CRPS difference from Mean-Variance Scaling (mm)
Method
Total Δ CRPS
all 0 mm 0.0% of area
all ≤ 1 mm 0.0% of area
mixed 11.4% of area
always wet 88.6% of area
Linear Scaling
+1.144
+0.000
+0.000
-0.014
+1.158
Variance Scaling (unbounded)
-0.027
+0.000
+0.000
+0.003
-0.030
Square-root-space Mean-Variance Scaling
-0.341
+0.000
+0.000
-0.018
-0.323
Power Transformation
-0.281
+0.000
+0.000
-0.015
-0.266
Delta Change
+0.436
+0.000
+0.000
-0.019
+0.455
Local Intensity Scaling
+0.973
+0.000
+0.000
-0.010
+0.983
Empirical Quantile Mapping
-0.107
+0.000
+0.000
-0.006
-0.101
Gamma Quantile Mapping
-0.312
+0.000
+0.000
-0.007
-0.305
Detrended Quantile Mapping
+1.105
+0.000
+0.000
+0.007
+1.098
Quantile Delta Mapping
+1.595
+0.000
+0.000
+0.001
+1.593
Scaled Distribution Mapping
+1.433
+0.000
+0.000
+0.003
+1.429
CDF-transform
+1.573
+0.000
+0.000
+0.006
+1.567
MVS with all-zero guard (variant)
+0.000
+0.000
+0.000
+0.000
+0.000
Apr: contributions to the CRPS difference from Mean-Variance Scaling (mm)
Method
Total Δ CRPS
all 0 mm 0.0% of area
all ≤ 1 mm 0.0% of area
mixed 14.3% of area
always wet 85.7% of area
Linear Scaling
+0.314
+0.000
+0.000
+0.059
+0.255
Variance Scaling (unbounded)
-0.005
+0.000
+0.000
-0.000
-0.004
Square-root-space Mean-Variance Scaling
-0.050
+0.000
+0.000
-0.008
-0.041
Power Transformation
+0.026
+0.000
+0.000
-0.008
+0.034
Delta Change
-0.030
+0.000
+0.000
-0.044
+0.013
Local Intensity Scaling
+0.286
+0.000
+0.000
+0.063
+0.222
Empirical Quantile Mapping
+0.335
+0.000
+0.000
+0.016
+0.319
Gamma Quantile Mapping
-0.036
+0.000
+0.000
-0.018
-0.019
Detrended Quantile Mapping
+0.680
+0.000
+0.000
+0.048
+0.631
Quantile Delta Mapping
+1.000
+0.000
+0.000
+0.117
+0.883
Scaled Distribution Mapping
+1.036
+0.000
+0.000
+0.077
+0.959
CDF-transform
+0.839
+0.000
+0.000
+0.098
+0.742
MVS with all-zero guard (variant)
+0.000
+0.000
+0.000
+0.000
+0.000
May: contributions to the CRPS difference from Mean-Variance Scaling (mm)
Method
Total Δ CRPS
all 0 mm 0.0% of area
all ≤ 1 mm 0.0% of area
mixed 9.4% of area
always wet 90.6% of area
Linear Scaling
+0.233
+0.000
+0.000
-0.012
+0.245
Variance Scaling (unbounded)
+0.012
+0.000
+0.000
+0.000
+0.012
Square-root-space Mean-Variance Scaling
-0.078
+0.000
+0.000
-0.024
-0.054
Power Transformation
-0.140
+0.000
+0.000
-0.058
-0.083
Delta Change
-0.252
+0.000
+0.000
-0.010
-0.242
Local Intensity Scaling
+0.223
+0.000
+0.000
+0.002
+0.221
Empirical Quantile Mapping
+0.180
+0.000
+0.000
-0.055
+0.235
Gamma Quantile Mapping
-0.062
+0.000
+0.000
-0.046
-0.016
Detrended Quantile Mapping
+0.354
+0.000
+0.000
-0.008
+0.362
Quantile Delta Mapping
+0.414
+0.000
+0.000
-0.001
+0.416
Scaled Distribution Mapping
+0.546
+0.000
+0.000
-0.007
+0.553
CDF-transform
+0.488
+0.000
+0.000
+0.009
+0.480
MVS with all-zero guard (variant)
+0.000
+0.000
+0.000
+0.000
+0.000
FMAM: contributions to the CRPS difference from Mean-Variance Scaling (mm)
Method
Total Δ CRPS
all 0 mm 0.0% of area
all ≤ 1 mm 0.0% of area
mixed 0.0% of area
always wet 100.0% of area
Linear Scaling
+0.825
+0.000
+0.000
+0.000
+0.825
Variance Scaling (unbounded)
+0.026
+0.000
+0.000
+0.000
+0.026
Square-root-space Mean-Variance Scaling
-0.063
+0.000
+0.000
+0.000
-0.063
Power Transformation
+0.085
+0.000
+0.000
+0.000
+0.085
Delta Change
+0.166
+0.000
+0.000
+0.000
+0.166
Local Intensity Scaling
+0.787
+0.000
+0.000
+0.000
+0.787
Empirical Quantile Mapping
+0.550
+0.000
+0.000
+0.000
+0.550
Gamma Quantile Mapping
-0.069
+0.000
+0.000
+0.000
-0.069
Detrended Quantile Mapping
+1.436
+0.000
+0.000
+0.000
+1.436
Quantile Delta Mapping
+2.095
+0.000
+0.000
+0.000
+2.095
Scaled Distribution Mapping
+2.638
+0.000
+0.000
+0.000
+2.638
CDF-transform
+1.721
+0.000
+0.000
+0.000
+1.721
MVS with all-zero guard (variant)
+0.000
+0.000
+0.000
+0.000
+0.000
Confirmation: full pipeline and method selection
The screening isolates the amount correction. The confirmation evaluates what the site publishes: each method’s
corrected members go through the full probability pipeline (tercile counts, smoothing and the climatology blend), with every fit and
the blend weight inside the cross-validation folds. Two selection-aware procedures then choose a method for each
left-out year using only the other training years — SEL-P by the lowest inner blended RPS (probabilities),
SEL-A by the lowest inner CRPS (amounts) — so their scores include the effect of choosing among the
14 declared methods. ✓ = better than Mean-Variance Scaling with Holm-adjusted p < 0.05 (methods: across all
methods and targets; SEL-P/SEL-A: across the targets) and not worse over 2017–2025. Scope: All Ethiopia.
FMAM season through the full pipeline (outer leave-one-year-out 1993–2016; test years exploratory)
Method
Blended RPSS 1993–2016
Blended RPSS 2017–2025
BSS below 1993–2016
BSS above 1993–2016
Amount CRPSS 1993–2016
Amount CRPSS 2017–2025
Mean blend weight λ
Mean-Variance Scaling (operational)
+0.021
+0.059
+0.017
+0.025
-0.007
+0.071
0.49
Linear Scaling
+0.021
+0.057
+0.018
+0.024
-0.023
+0.086
0.52
Variance Scaling (unbounded)
+0.021
+0.058
+0.017
+0.025
-0.007
+0.070
0.49
Square-root-space Mean-Variance Scaling
+0.021
+0.062
+0.018
+0.025
-0.005
+0.073
0.49
Power Transformation
+0.021
+0.062
+0.016
+0.025
-0.008
+0.074
0.50
Delta Change
+0.017
+0.049
+0.015
+0.020
-0.010
+0.075
0.55
Local Intensity Scaling
+0.021
+0.057
+0.018
+0.024
-0.022
+0.086
0.52
Empirical Quantile Mapping
+0.012
+0.044
+0.008
+0.015
-0.018
+0.059
0.56
Gamma Quantile Mapping
+0.022
+0.063
+0.019
+0.025
-0.005
+0.073
0.49
Detrended Quantile Mapping
+0.017
+0.054
+0.012
+0.022
-0.035
+0.072
0.61
Quantile Delta Mapping
+0.018
+0.060
+0.014
+0.022
-0.048
+0.075
0.63
Scaled Distribution Mapping
+0.019
+0.058
+0.015
+0.023
-0.059
+0.063
0.65
CDF-transform
+0.016
+0.054
+0.010
+0.021
-0.041
+0.072
0.61
MVS with all-zero guard (variant)
+0.021
+0.059
+0.017
+0.025
-0.007
+0.071
0.49
SEL-P
+0.020
+0.063
+0.015
+0.025
-0.017
+0.073
—
SEL-A
+0.019
+0.063
+0.015
+0.023
-0.011
+0.073
—
Blended tercile RPSS by target, outer leave-one-year-out 1993–2016
Method
Feb
Mar
Apr
May
FMAM
Mean-Variance Scaling (operational)
+0.126
+0.011
+0.009
+0.008
+0.021
Linear Scaling
+0.140
+0.016
+0.011
+0.010
+0.021
Variance Scaling (unbounded)
+0.124
+0.012
+0.010
+0.008
+0.021
Square-root-space Mean-Variance Scaling
+0.207 ✓
+0.025
+0.007
+0.008
+0.021
Power Transformation
+0.193
+0.020
+0.004
+0.007
+0.021
Delta Change
+0.155
+0.014
+0.004
+0.006
+0.017
Local Intensity Scaling
+0.138
+0.015
+0.011
+0.009
+0.021
Empirical Quantile Mapping
+0.190
+0.011
-0.002
-0.007
+0.012
Gamma Quantile Mapping
+0.160
+0.018
+0.007
+0.007
+0.022
Detrended Quantile Mapping
+0.166
+0.016
+0.001
-0.000
+0.017
Quantile Delta Mapping
+0.135
+0.016
+0.002
+0.001
+0.018
Scaled Distribution Mapping
+0.124
+0.010
+0.005
+0.002
+0.019
CDF-transform
+0.165
+0.021
+0.000
+0.000
+0.016
MVS with all-zero guard (variant)
+0.126
+0.011
+0.009
+0.008
+0.021
SEL-P
+0.207 ✓
+0.019
+0.006
-0.003
+0.020
SEL-A
+0.207
+0.025
+0.001
-0.002
+0.019
Amount CRPSS by target in the confirmation design, and the selection-aware procedures
Amount CRPSS by target, outer leave-one-year-out 1993–2016
Method
Feb
Mar
Apr
May
FMAM
Mean-Variance Scaling (operational)
+0.240
-0.034
-0.001
-0.005
-0.007
Linear Scaling
-0.031
-0.091
-0.011
-0.013
-0.023
Variance Scaling (unbounded)
+0.246
-0.032
-0.000
-0.005
-0.007
Square-root-space Mean-Variance Scaling
+0.267
-0.017
+0.001
-0.002
-0.005
Power Transformation
+0.202
-0.020
-0.001
+0.000
-0.008
Delta Change
+0.091
-0.055
+0.001
+0.004
-0.010
Local Intensity Scaling
+0.040
-0.082
-0.011
-0.012
-0.022
Empirical Quantile Mapping
+0.248
-0.028
-0.012
-0.011
-0.018
Gamma Quantile Mapping
+0.245
-0.018
+0.001
-0.002
-0.005
Detrended Quantile Mapping
-0.016
-0.089
-0.024
-0.017
-0.035
Quantile Delta Mapping
+0.158
-0.113
-0.035
-0.019
-0.048
Scaled Distribution Mapping
-0.077
-0.105
-0.037
-0.023
-0.059
CDF-transform
-0.367
-0.112
-0.030
-0.021
-0.041
MVS with all-zero guard (variant)
+0.240
-0.034
-0.001
-0.005
-0.007
SEL-P
+0.267
-0.034
-0.014
-0.007
-0.017
SEL-A
+0.267 ✓
-0.017 ✓
-0.011
-0.002
-0.011
Selection-aware procedures against the operational method (Δ: RPS for SEL-P, CRPS for SEL-A; negative favours the procedure)
The operational correction limits the spread ratio r = σobs/σmodel to 0.5–2. This study runs the same
screening and confirmation for that correction with wider limits (1/3–3, 1/4–4) and none, all with the same fallback (r = 1 where
the model spread is below 1 mm), to see whether the limits are worth changing. ✓ = better than the operational limits with
Holm-adjusted p < 0.05 across the 3 alternatives × 5 targets and not worse over the test years.
Run at commit fb7425f.
Confirmed better than the operational limits — published (blended) probabilities: none;
rainfall amounts: none.
Blended tercile RPSS through the full pipeline, outer leave-one-year-out 1993–2016
Method
Feb
Mar
Apr
May
FMAM
Mean-Variance Scaling (operational, 0.5–2)
+0.126
+0.011
+0.009
+0.008
+0.021
MVS, ratio limits 1/3-3
+0.126
+0.012
+0.010
+0.008
+0.021
MVS, ratio limits 1/4-4
+0.125
+0.012
+0.010
+0.008
+0.021
Variance Scaling (unbounded)
+0.124
+0.012
+0.010
+0.008
+0.021
Amount CRPSS, leave-one-year-out 1993–2016
Method
Feb
Mar
Apr
May
FMAM
Mean-Variance Scaling (operational, 0.5–2)
+0.240
-0.034
-0.001
-0.005
-0.007
MVS, ratio limits 1/3-3
+0.245
-0.032
-0.000
-0.005
-0.007
MVS, ratio limits 1/4-4
+0.246
-0.032
-0.000
-0.005
-0.007
Variance Scaling (unbounded)
+0.246
-0.032
-0.000
-0.005
-0.007
Where the operational limits act
Share of the corrected area, mean over the leave-one-year-out folds, 1993–2016
Target
Lower limit active (r would be < 0.5)
Upper limit active (r would be > 2)
Spread–error, operational
Spread–error, no limits
Feb
32%
3%
0.96
0.96
Mar
4%
6%
0.91
0.92
Apr
0%
5%
0.95
0.95
May
0%
4%
0.96
0.97
FMAM
0%
3%
0.91
0.92
Shadow forecast
Not a published forecast. For each new cycle of this initialization, the shadow method runs through the
same probability pipeline as the published forecast (all reference years; blend weight from leave-one-year-out), next to it, and is
scored once CHIRPS for the target is available. Each scored season is independent evidence that enters the suggestion above.
Feb 2026: Square-root-space Mean-Variance Scaling
The published method run alongside reproduces the published forecast: largest probability difference 1.9e-08, blend weight difference 5.7e-09.
Feb 2026 against CHIRPS (one season)
Method
Region
RPSS
BSS below
BSS above
Amount CRPSS
Favoured category observed
λ
Mean-Variance Scaling (published)
All Ethiopia
-0.012
-0.074
+0.062
+0.015
40%
0.50
Mean-Variance Scaling (published)
FMAM rainfall contribution domain
+0.002
-0.051
+0.063
+0.020
42%
0.50
Square-root-space Mean-Variance Scaling (shadow)
All Ethiopia
+0.003
-0.059
+0.077
+0.028
40%
0.35
Square-root-space Mean-Variance Scaling (shadow)
FMAM rainfall contribution domain
+0.037
-0.025
+0.109
+0.042
44%
0.35
Favoured category of the published method and of the shadow, the observed category and the per-cell RPS difference.Independent validation seasons: every method scored on the seasons after the benchmark (one season each; the suggestions need at least three)
2026: blended tercile RPSS against CHIRPS
Method
Feb
Mar
Apr
May
FMAM
Mean-Variance Scaling (operational)
-0.012
+0.057
-0.134
+0.002
-0.013
CDF-transform
-0.012
+0.127
-0.134
-0.015
+0.000
Delta Change
+0.005
+0.041
-0.114
-0.034
-0.020
Detrended Quantile Mapping
+0.008
+0.085
-0.128
-0.027
+0.006
Empirical Quantile Mapping
-0.002
+0.081
-0.132
-0.016
-0.013
Gamma Quantile Mapping
-0.071
+0.092
-0.156
-0.007
-0.004
Local Intensity Scaling
-0.004
+0.001
-0.151
-0.002
-0.016
Linear Scaling
+0.004
+0.007
-0.159
-0.002
-0.016
MVS with all-zero guard (variant)
-0.012
+0.057
-0.134
+0.002
-0.013
Power Transformation
-0.013
+0.116
-0.168
-0.009
-0.003
Quantile Delta Mapping
+0.018
+0.105
-0.135
-0.025
+0.011
Scaled Distribution Mapping
-0.001
+0.004
-0.116
-0.020
+0.006
Square-root-space Mean-Variance Scaling
+0.003
+0.100
-0.170
-0.005
-0.008
Variance Scaling (unbounded)
+0.005
+0.059
-0.131
+0.003
-0.014
2026: amount CRPSS against CHIRPS
Method
Feb
Mar
Apr
May
FMAM
Mean-Variance Scaling (operational)
+0.015
+0.067
-0.486
-0.032
-0.091
CDF-transform
-0.343
+0.133
-0.633
-0.075
-0.090
Delta Change
-0.165
+0.077
-0.479
-0.061
-0.099
Detrended Quantile Mapping
-0.211
+0.102
-0.591
-0.085
-0.080
Empirical Quantile Mapping
+0.080
+0.082
-0.507
-0.054
-0.099
Gamma Quantile Mapping
-0.008
+0.094
-0.490
-0.057
-0.080
Local Intensity Scaling
-0.282
+0.092
-0.574
-0.091
-0.106
Linear Scaling
-0.351
+0.093
-0.579
-0.093
-0.107
MVS with all-zero guard (variant)
+0.015
+0.067
-0.486
-0.032
-0.091
Power Transformation
-0.060
+0.110
-0.500
-0.048
-0.088
Quantile Delta Mapping
-0.115
+0.129
-0.661
-0.088
-0.097
Scaled Distribution Mapping
-0.394
+0.018
-0.581
-0.064
-0.107
Square-root-space Mean-Variance Scaling
+0.028
+0.091
-0.495
-0.051
-0.085
Variance Scaling (unbounded)
+0.024
+0.067
-0.489
-0.031
-0.094
Figures
Figures show the national aggregate (All Ethiopia) or per-cell maps of the whole country, whatever region is selected for the tables.
Interpretation — national aggregate (All Ethiopia)
All tested corrections improve national FMAM rainfall-amount CRPSS over raw ECMWF in 1993–2016 (raw -0.585; corrected -0.059 to -0.005). Performance varies for monthly tercile probabilities: 0 method–month combinations score below the raw model on RPSS.
Accounting for the whole search. With Holm adjustment across all 60 method–target comparisons, the amount (CRPS) screening passes are none, and the tercile (RPS) passes are Square-root-space Mean-Variance Scaling (Feb, Mar), Power Transformation (Feb, Mar) and Empirical Quantile Mapping (Feb). Within-method passes that do not survive this check: Empirical Quantile Mapping Mar, Gamma Quantile Mapping Feb, Gamma Quantile Mapping Mar, Power Transformation May, Square-root-space Mean-Variance Scaling Feb, Square-root-space Mean-Variance Scaling Mar and Variance Scaling (unbounded) Feb.
Empirical Quantile Mapping reproduces the CHIRPS distribution and, with the dry policy, its dry share (totals ≤ 1 mm: Feb 12.9% vs CHIRPS 12.9%); it passes the screening for Feb and Mar, but its FMAM amount skill is lower than Mean-Variance Scaling (-0.018 vs -0.007). A possible explanation is sampling noise in an empirical quantile function built from 23 CHIRPS values per fold; the results do not isolate it.
Scaled Distribution Mapping follows the published algorithm (Switanek et al. 2017, steps 1–7; checked numerically against an independent implementation of the steps). Where the model is drier than CHIRPS it cannot add rain: in Feb 58% of model members exceed 1 mm against 87% of CHIRPS years, and SDM, by design, keeps the model’s number of rain members, so its corrected dry share is 44% (CHIRPS 13%).
The methods that use the forecast’s own distribution (Detrended Quantile Mapping, Quantile Delta Mapping, Scaled Distribution Mapping, CDF-transform) score lower on FMAM terciles (-0.045 to -0.023 vs +0.005) and none passes the season screening. A possible explanation is that the distribution of a single forecast’s 25–51 members is a noisy estimate of the “future” distribution these methods were designed for; the results do not isolate the cause. Where model quantiles are dry, QDM falls back to the CHIRPS quantile (members affected: Feb 42% and Mar 18%), so its quantile changes are only partly preserved.
Published probabilities: confirmed better than Mean-Variance Scaling: Square-root-space Mean-Variance Scaling (Feb). Choosing the method each year from training-only scores, the probability procedure (SEL-P) scores FMAM blended RPSS +0.020 against +0.021, confirmed for Feb. Amounts: the amount procedure (SEL-A) scores CRPSS -0.011 against -0.007, confirmed for Feb and Mar; fixed methods confirmed against the family of all declared methods and targets: none.
The climatology blend narrows the differences. Across the methods, FMAM RPSS (1993–2016) spans 0.010 after the blend against 0.051 for the unblended screening counts. A better amount correction is trusted more by the blend: in Mar the fitted weight on climatology is 0.47 with Square-root-space Mean-Variance Scaling against 0.71 with Mean-Variance Scaling.
Choosing by training scores can backfire. For Apr, SEL-P chose Linear Scaling from the 1993–2016 scores; over 2017–2025 it has a worse mean RPS (Δ +0.000, 95% interval -0.004 to +0.004; better than Mean-Variance Scaling in 4 of 9 years, with the largest losses in 2021 and 2020); for May, SEL-P chose Square-root-space Mean-Variance Scaling from the 1993–2016 scores; over 2017–2025 it has a worse mean RPS (Δ +0.001, 95% interval -0.006 to +0.009; better than Mean-Variance Scaling in 5 of 9 years, with the largest losses in 2021 and 2025). These choices fail the no-harm rule; where the interval includes 0 they do not establish a significant deterioration. A method that ranks first on the training years is not, on that alone, a replacement.
No cell of All Ethiopia has exactly 0 mm in every training year, for any target, at 0.25° with CHIRPS. The all-zero guard (a separate MVS variant, outside the declared family) therefore never acts and equals Mean-Variance Scaling: the non-zero totals that Mean-Variance Scaling gives where every training year is 0 mm (its spread ratio cannot fall below 0.5) do not arise in these data. The guard remains a documented option; a finite history of zero rainfall does not make rain impossible.
5 of the 14 interpretation statements do not hold for this cycle’s results and are not shown (each is checked against the numbers before it is displayed).
Caveats
Screening skill is from 1993–2016 leave-one-year-out (clean) and 2017–2025 (exploratory: these years were seen while the operational method was chosen).
Screening tercile scores use smoothed member counts without the climatology blend; the confirmation scores the blended product.
Two multiplicity families are shown: within one method across its targets (✓) and across all methods and targets (✓✓). The confirmation’s selection-aware procedures include the method choice in the evaluation itself.
Scores are area-weighted over many correlated cells but tested year by year, so each year counts once.
The ordinary CRPS scores the delivered ensemble; the fair CRPS is a diagnostic under a sampling interpretation that DC’s rescaled years and methods tied to the forecast mean or ranks only approximate.
Results are national aggregates unless a table says otherwise; a method can rank differently in a region (switch the tables to the regional view).
Boé, J., Terray, L., Habets, F., & Martin, E. (2007). Statistical and dynamical downscaling of the Seine basin climate for hydro-meteorological studies. International Journal of Climatology, 27, 1643–1655. doi:10.1002/joc.1602
Cannon, A. J., Sobie, S. R., & Murdock, T. Q. (2015). Bias correction of GCM precipitation by quantile mapping: how well do methods preserve changes in quantiles and extremes? Journal of Climate, 28, 6938–6959. doi:10.1175/JCLI-D-14-00754.1
Delle Monache, L., Hacker, J. P., Zhou, Y., Deng, X., & Stull, R. B. (2006). Probabilistic aspects of meteorological and ozone regional ensemble forecasts. Journal of Geophysical Research: Atmospheres, 111, D24307. doi:10.1029/2005JD006917
Ferro, C. A. T. (2014). Fair scores for ensemble forecasts. Quarterly Journal of the Royal Meteorological Society, 140, 1917–1923. doi:10.1002/qj.2270
Gudmundsson, L., Bremnes, J. B., Haugen, J. E., & Engen-Skaugen, T. (2012). Technical Note: Downscaling RCM precipitation to the station scale using statistical transformations — a comparison of methods. Hydrology and Earth System Sciences, 16, 3383–3390. doi:10.5194/hess-16-3383-2012
Hay, L. E., Wilby, R. L., & Leavesley, G. H. (2000). A comparison of delta change and downscaled GCM scenarios for three mountainous basins in the United States. JAWRA Journal of the American Water Resources Association, 36, 387–397. doi:10.1111/j.1752-1688.2000.tb04276.x
Johnson, S. J., Stockdale, T. N., Ferranti, L., et al. (2019). SEAS5: the new ECMWF seasonal forecast system. Geoscientific Model Development, 12, 1087–1117. doi:10.5194/gmd-12-1087-2019
Leander, R., & Buishand, T. A. (2007). Resampling of regional climate model output for the simulation of extreme river flows. Journal of Hydrology, 332, 487–496. doi:10.1016/j.jhydrol.2006.08.006
Lenderink, G., Buishand, A., & van Deursen, W. (2007). Estimates of future discharges of the river Rhine using two scenario methodologies: direct versus delta approach. Hydrology and Earth System Sciences, 11, 1145–1159. doi:10.5194/hess-11-1145-2007
Manzanas, R., Gutiérrez, J. M., Bhend, J., et al. (2019). Bias adjustment and ensemble recalibration methods for seasonal forecasting: a comprehensive intercomparison using the C3S dataset. Climate Dynamics, 53, 1287–1305. doi:10.1007/s00382-019-04640-4
Michelangeli, P.-A., Vrac, M., & Loukos, H. (2009). Probabilistic downscaling approaches: application to wind cumulative distribution functions. Geophysical Research Letters, 36, L11708. doi:10.1029/2009GL038401
Piani, C., Weedon, G. P., Best, M., et al. (2010). Statistical bias correction of global simulated daily precipitation and temperature for the application of hydrological models. Journal of Hydrology, 395, 199–215. doi:10.1016/j.jhydrol.2010.10.024
Schmidli, J., Frei, C., & Vidale, P. L. (2006). Downscaling from GCM precipitation: a benchmark for dynamical and statistical downscaling methods. International Journal of Climatology, 26, 679–689. doi:10.1002/joc.1287
Switanek, M. B., Troch, P. A., Castro, C. L., et al. (2017). Scaled distribution mapping: a bias correction method that preserves raw climate model projected changes. Hydrology and Earth System Sciences, 21, 2649–2666. doi:10.5194/hess-21-2649-2017
Teutschbein, C., & Seibert, J. (2012). Bias correction of regional climate model simulations for hydrological climate-change impact studies: review and evaluation of different methods. Journal of Hydrology, 456–457, 12–29. doi:10.1016/j.jhydrol.2012.05.052
Themeßl, M. J., Gobiet, A., & Leuprecht, A. (2011). Empirical-statistical downscaling and error correction of daily precipitation from regional climate models. International Journal of Climatology, 31, 1530–1544. doi:10.1002/joc.2168
Torralba, V., Doblas-Reyes, F. J., MacLeod, D., Christel, I., & Davis, M. (2017). Seasonal climate prediction: a new source of information for the management of wind energy resources. Journal of Applied Meteorology and Climatology, 56, 1231–1247. doi:10.1175/JAMC-D-16-0204.1
Vrac, M., Drobinski, P., Merlo, A., et al. (2012). Dynamical and statistical downscaling of the French Mediterranean climate: uncertainty assessment. Natural Hazards and Earth System Sciences, 12, 2769–2784. doi:10.5194/nhess-12-2769-2012
DOIs checked against Crossref, 11 October 2026.
May initialization · JJAS and its months
Research benchmark. The published forecasts still use Mean-Variance Scaling (operational). This section
compares 12 other rainfall-amount bias-correction methods with it, member by member, for every grid cell and target:
a screening of the amount correction alone, then a confirmation through the full probability pipeline that also
accounts for how a method is chosen.
Suggested method
The platform suggests a bias-correction method for every target and product from the historical evidence (the confirmation
against CHIRPS, counting every method tried) and the independent validation seasons scored since (the shadow and validation
runs), by a rule fixed before those seasons are scored. A suggestion is advice for a decision: the published forecast
always uses Mean-Variance Scaling until a change is decided. 2 of 10 target–product combinations have a
candidate.
The rule
Candidate: A method is a candidate only if the confirmation (CHIRPS, outer leave-one-year-out over the training years, full pipeline) finds it better than the operational method with Holm-adjusted p < 0.05 across every declared method and target, and not worse over the test years. Variants outside the declared family are not candidates.
Choice: Among candidates, the method the selection-aware procedure chooses from all training years (training-only information); if that method is not a candidate, the candidate with the best training-period score. Other candidates are listed as alternatives: a confirmation establishes improvement against the operational method, not a ranking among candidates.
Validation: Independent validation seasons are forecast years scored after the benchmark (bias_validation.py). A candidate is 'recommended' once at least minimum_seasons have been scored for it and the operational method, and its mean score over them is not worse; with fewer seasons it stays a 'candidate'; with enough seasons and a worse mean it is 'not supported by validation'. Minimum: 3 seasons.
Suggested methods (national aggregate)
Target
Product
Suggested method
Status
Evidence
Jun
Published tercile probabilities
Mean-Variance Scaling
Keep the operational method
No method is confirmed better than Mean-Variance Scaling for Jun on the historical evidence.
Jun
Rainfall amounts
Mean-Variance Scaling
Keep the operational method
No method is confirmed better than Mean-Variance Scaling for Jun on the historical evidence.
Jul
Published tercile probabilities
Mean-Variance Scaling
Keep the operational method
No method is confirmed better than Mean-Variance Scaling for Jul on the historical evidence.
Jul
Rainfall amounts
Variance Scaling (unbounded)
Candidate — validation 1 of 3 seasons
Variance Scaling (unbounded) is confirmed better than Mean-Variance Scaling for Jul (CRPS (mm) difference -0.1386 over the training years, Holm p 0; -0.1399 over the test years). Independent validation: 1 of 3 season(s), mean difference -0.4168.
Aug
Published tercile probabilities
Mean-Variance Scaling
Keep the operational method
No method is confirmed better than Mean-Variance Scaling for Aug on the historical evidence.
Aug
Rainfall amounts
Variance Scaling (unbounded)
Candidate — validation 1 of 3 seasons
Variance Scaling (unbounded) is confirmed better than Mean-Variance Scaling for Aug (CRPS (mm) difference -0.129 over the training years, Holm p 0; -0.08487 over the test years). Independent validation: 1 of 3 season(s), mean difference -0.1859. Also confirmed: Square-root-space Mean-Variance Scaling, Power Transformation, Gamma Quantile Mapping.
Sep
Published tercile probabilities
Mean-Variance Scaling
Keep the operational method
No method is confirmed better than Mean-Variance Scaling for Sep on the historical evidence.
Sep
Rainfall amounts
Mean-Variance Scaling
Keep the operational method
No method is confirmed better than Mean-Variance Scaling for Sep on the historical evidence.
JJAS
Published tercile probabilities
Mean-Variance Scaling
Keep the operational method
No method is confirmed better than Mean-Variance Scaling for JJAS on the historical evidence.
JJAS
Rainfall amounts
Mean-Variance Scaling
Keep the operational method
No method is confirmed better than Mean-Variance Scaling for JJAS on the historical evidence.
Summary — national aggregate (All Ethiopia)
All tested corrections improve national JJAS rainfall-amount CRPSS over raw ECMWF in 1993–2016 (raw -1.311; corrected -0.078 to -0.025). Performance varies for monthly tercile probabilities: 0 method–month combinations score below the raw model on RPSS.
Accounting for the whole search. With Holm adjustment across all 60 method–target comparisons, the amount (CRPS) screening passes are Variance Scaling (unbounded) (Jul, Aug), Square-root-space Mean-Variance Scaling (Aug), Power Transformation (Aug) and Gamma Quantile Mapping (Aug), and the tercile (RPS) passes are none. Within-method passes that do not survive this check: Gamma Quantile Mapping Jun, Gamma Quantile Mapping Sep, Power Transformation Jul, Power Transformation Jun, Square-root-space Mean-Variance Scaling JJAS, Square-root-space Mean-Variance Scaling Jul, Square-root-space Mean-Variance Scaling Jun, Square-root-space Mean-Variance Scaling Sep and Variance Scaling (unbounded) Sep.
What the evidence supports
Published tercile probabilities: no tested method demonstrates a statistically significant improvement over Mean-Variance Scaling under this validation protocol (several have slightly higher point estimates); the selection-aware procedure is confirmed for none.
Rainfall amounts: confirmed against Mean-Variance Scaling (family-wide, full pipeline): Variance Scaling (unbounded) for Jul and Aug; Square-root-space Mean-Variance Scaling for Aug; Power Transformation for Aug; Gamma Quantile Mapping for Aug. The selection-aware procedure is confirmed for Jun, Aug and Sep. These comparisons establish improvement against the reference, not that one candidate is better than another.
The operational method stays Mean-Variance Scaling until a change is decided by initialization, target and product, and recorded in the docs, on this evidence; confirmed improvements limited to some months may justify a per-target choice.
If amounts and probabilities come to use different correction paths, the product metadata must record both methods so that every output can be traced.
The same screening and confirmation run for the other cycles with one configuration file each (config/bias_correction/).
Data
Data used by the benchmark
Item
Details
Forecasts
ECMWF SEAS5 (system 51), initialized on 1 May; 25 members 1993–2016, 51 from 2017; remapped from 1° to the 0.25° CHIRPS grid by conservative remapping (each 1° cell fills a 4 × 4 block). Johnson et al. 2019
Observations
CHIRPS v3.0 monthly totals, averaged from 0.05° to 0.25°
Targets
Jun, Jul, Aug, Sep and the JJAS season; each corrected separately
Values
One total per member, grid cell and year (mm), the same inputs as the operational tool (data/processed/init05_<target>/)
Score coverage (amounts / probabilities, share of the national area)
Jun 100% / 100%; Jul 100% / 82%; Aug 100% / 86%; Sep 100% / 100%; JJAS 100% / 100%. Tercile scores need two distinct tercile boundaries defining three categories, a CHIRPS standard deviation of at least 1 mm and a lower boundary above 0 mm, so dry months have fewer probability cells.
Dry totals
≤ 1 mm in a month or season (not a dry day); exactly 0 mm is reported separately
Weighting
Every member is used; each training year has total weight 1/Y (each member of year y weighs 1/(Y·My)), so years with 25 and 51 members count equally. Each observed year weighs 1/Y.
Run
config/bias_correction/may_jjas.json; 2026-10-12 08:17 UTC; commit 9f397927f5; scoring version 3
Methods
Each method is fitted per grid cell and target from the training years only and applied to each member of the scored year.
Methods that keep a “change signal” (DC, DQM, QDM, SDM, CDF-t) were designed for climate change, where a model’s reference period is
compared with a future period; here the “future” is the forecast itself: the target year’s ensemble against the model climatology.
How overlapping names were resolved
Delta Change appeared twice in the requested list; it is one method.
Mean–Variance Scaling is the operational method, with the project’s 0.5–2 ratio limits. Variance Scaling uses the same algebra and the same fallback (ratio 1 where the model spread is below 1 mm) without the limits, so the comparison isolates the limits.
Delta Change returns the CHIRPS training years rescaled by the forecast signal (ensemble mean / model climatology): historical scenarios, not corrected members. Applied to each member instead it would be identical to Linear Scaling.
Square-root-space MVS (a mean–variance scaling of √x) is distinct from Power Transformation (a·xb with b fitted to the coefficient of variation).
The raw model is scored as a baseline, not screened.
Dry totals and tied values
A total at or below 1 mm in the month or season is “dry” (not a dry day).
For the quantile-mapping methods (EQM, Gamma QM, DQM, QDM) the dry shares of the model climatology and of CHIRPS are estimated with
the equal-year weights; a forecast’s dry members are spread evenly over the model’s dry probability by rank (deterministic stratified
tie-breaking, with ties resolved by member index), and a probability within the CHIRPS dry share maps to 0 mm, also after any
extrapolation of the upper tail. Without this, tied zeros share one
probability and the corrected dry share does not follow CHIRPS. Tests cover repeated zeros, all-dry samples and very few wet values;
the dry-month table under Results compares the shares. CDF-t, LOCI and the scaling methods have no occurrence adjustment; SDM uses its
own rain-member rule (Switanek et al. 2017).
12 methods, the operational reference and the raw baseline
Method
Family
Definition (per cell and target)
Member-wise
Uses the forecast ensemble’s own distribution
Parameters
References
Raw ECMWF (no correction) raw
baseline
x' = x (the uncorrected model; baseline, not a candidate)
Model threshold with the observed frequency of totals above 1 mm, then intensity scaling above it (designed for daily rainfall; here monthly or seasonal totals)
x' = G_obs^-1(G_model(x)), G = dry mass (<= 1 mm) + gamma by weighted maximum likelihood, with the dry policy; linear scaling where fewer than 3 wet values
a * EQM(x / a), a = forecast ensemble mean / model mean (0.2-5): removes and reapplies the bounded ratio; exact preservation of the final mean anomaly is not guaranteed
x' = Q_obs(tau) * x / Q_model(tau), tau = rank of x in the forecast ensemble; change capped at 5 and replaced by Q_obs(tau) where Q_model(tau) <= 1 mm (both reported), so preservation is partial there
Switanek et al. (2017) precipitation steps 1-7: gamma fits, recurrence intervals interpolated to the forecast's length, scaled CDF, rain-member count; model climatology with equal-year weights
F_obs,f = F_obs(F_model^-1(F_forecast)); x' = F_obs,f^-1(F_forecast(x)); implementation choices: model and forecast first scaled to the CHIRPS mean, values stay within the scaled forecast range
Per-member totals of every target and year, and CHIRPS for 1993–2025.
bias_benchmark.py · run_calibration.load_inputs
2
Fit
For each cell and target, the method’s statistics from the training years only, with equal-year weights.
bias_methods.METHODS[key].fit
3
Apply
Correct every member of the scored year individually (member-wise).
bias_methods.METHODS[key].apply
4
Score
Ensemble CRPS (and fair CRPS), ensemble-mean errors, spread–error, rank histograms, tercile RPS, dry shares and distribution ratios, per cell; then area-weighted per year.
bias_benchmark.score_cells · summarise
5
Screen
Each method against Mean-Variance Scaling per target: one-sided sign-flip test on whole years, Holm within the method and across all methods, no harm in 2017–2025.
bias_benchmark.make_gates
6
Confirm
Every method through the full probability pipeline (blend weight fitted inside the folds), and selection-aware procedures that choose the method each year from training-only scores.
bias_confirmation.py
Evaluation designs (no amount method has a parameter tuned on scores)
Design
Fits
Scored
Role
Screening: training
leave-one-year-out within 1993–2016
each 1993–2016 year
clean evidence for the screening
Screening: test
1993–2016
2017–2025
exploratory (these years were seen before)
Screening: full
leave-one-year-out within 1993–2025
each year
per-cell maps and distribution checks (descriptive)
Confirmation
outer leave-one-year-out within 1993–2016; inside each fold the blend weight (inner leave-one-year-out) and, for SEL-P/SEL-A, the method choice
each 1993–2016 year
full pipeline; accounts for the method choice
Confirmation: test
1993–2016 (fits, blend weight and method choice)
2017–2025
exploratory
Forecast
1993–2025
2026 members
member-by-member comparison
Scores
Score
What it measures
Reference
CRPS / CRPSS
Error of the corrected ensemble’s empirical distribution, as delivered, in mm; skill against the CHIRPS training climatology (the training years as an ensemble). Primary amount score.
Fair CRPS / CRPSS
The same under the interpretation that the members are a sample of an underlying distribution; reported as a diagnostic and screened separately. The justification assumes exchangeable members, which DC’s rescaled years and methods tied to the forecast mean or ranks only approximate.
The published probability product: counts, smoothing and the climatology blend with its weight fitted inside the folds; category Brier skill for below and above normal; reliability tables
Dry shares and distribution ratios
Pooled out-of-fold corrected members (equal-year weights) against CHIRPS of the same years: shares at exactly 0 mm and at ≤ 1 mm; mean, standard deviation, 10th and 90th percentile ratios (area-weighted medians)
Screening results
Region for the result tables
Tables for: All Ethiopia. ✓ = screening pass within the method (Holm across its targets); ✓✓ = also passes with Holm across all methods and targets. A pass is screening evidence, not an adoption decision. Bold: the operational method. Skill is against the CHIRPS training climatology (0 = no better than climatology).
JJAS season at a glance — All Ethiopia
Method
Amount CRPSS
Tercile RPSS (no blend)
Diagnostics, leave-one-year-out 1993–2016
1993–2016
2017–2025
1993–2016
2017–2025
Mean bias (mm)
MAE (mm)
Correlation
Spread–error
Reliability index
Members ≤ 1 mm
Raw ECMWF (no correction)
-1.311
-1.266
-0.511
-0.412
+8.8
134.5
0.18
0.39
0.66
0.0%
Linear Scaling
-0.059
-0.082
-0.027
-0.004
+0.1
67.3
0.08
0.87
0.09
0.0%
Mean-Variance Scaling (operational)
-0.028
-0.018
-0.017
+0.003
-0.0
66.2
0.08
0.83
0.09
0.5%
Variance Scaling (unbounded)
-0.027
-0.016
-0.016
+0.005
-0.0
66.1
0.07
0.83
0.11
0.2%
Square-root-space Mean-Variance Scaling
-0.025 ✓
-0.014
-0.017
+0.004
-0.0
66.0
0.08
0.82
0.12
0.0%
Power Transformation
-0.027
-0.016
-0.017
-0.000
-0.0
66.1
0.07
0.83
0.12
0.0%
Delta Change
-0.030
-0.058
-0.015
-0.034
+0.1
67.3
0.08
0.98
0.05
0.0%
Local Intensity Scaling
-0.059
-0.081
-0.028
-0.003
+0.1
67.3
0.08
0.87
0.10
0.0%
Empirical Quantile Mapping
-0.040
-0.032
-0.024
-0.008
+0.1
65.8
0.06
0.83
0.14
0.0%
Gamma Quantile Mapping
-0.025
-0.012
-0.019
+0.003
-0.1
66.0
0.07
0.82
0.15
0.0%
Detrended Quantile Mapping
-0.056
-0.078
-0.044
-0.055
-0.7
67.3
0.08
0.83
0.17
0.0%
Quantile Delta Mapping
-0.062
-0.097
-0.062
-0.062
+1.2
67.6
0.08
0.84
0.21
0.0%
Scaled Distribution Mapping
-0.078
-0.110
-0.080
-0.079
-4.2
67.4
0.09
0.81
0.32
0.7%
CDF-transform
-0.061
-0.081
-0.061
-0.059
-0.1
67.4
0.08
0.78
0.21
0.0%
MVS with all-zero guard (variant)
-0.028
-0.018
-0.017
+0.003
-0.0
66.2
0.08
0.83
0.09
0.5%
Amount skill (CRPSS) by target, leave-one-year-out 1993–2016
Method
Jun
Jul
Aug
Sep
JJAS
Raw ECMWF (no correction)
-0.788
-0.613
-0.764
-0.816
-1.311
Linear Scaling
-0.121
-0.029
-0.064
-0.090
-0.059
Mean-Variance Scaling (operational)
-0.096
-0.007
-0.028
-0.060
-0.028
Variance Scaling (unbounded)
-0.093
-0.000 ✓✓
-0.021 ✓✓
-0.058 ✓
-0.027
Square-root-space Mean-Variance Scaling
-0.088 ✓
-0.003 ✓
-0.023 ✓✓
-0.057 ✓
-0.025 ✓
Power Transformation
-0.091
-0.001 ✓
-0.022 ✓✓
-0.060
-0.027
Delta Change
-0.105
+0.001
-0.043
-0.067
-0.030
Local Intensity Scaling
-0.118
-0.028
-0.061
-0.087
-0.059
Empirical Quantile Mapping
-0.100
-0.017
-0.035
-0.067
-0.040
Gamma Quantile Mapping
-0.088 ✓
-0.006
-0.021 ✓✓
-0.056 ✓
-0.025
Detrended Quantile Mapping
-0.134
-0.026
-0.064
-0.090
-0.056
Quantile Delta Mapping
-0.145
-0.025
-0.071
-0.098
-0.062
Scaled Distribution Mapping
-0.162
-0.037
-0.084
-0.107
-0.078
CDF-transform
-0.138
-0.026
-0.065
-0.098
-0.061
MVS with all-zero guard (variant)
-0.096
-0.007
-0.028
-0.060
-0.028
Tercile skill (RPSS of smoothed counts, no blend) by target, 1993–2016
Method
Jun
Jul
Aug
Sep
JJAS
Raw ECMWF (no correction)
-0.450
-0.394
-0.405
-0.383
-0.511
Linear Scaling
-0.118
-0.046
-0.040
-0.072
-0.027
Mean-Variance Scaling (operational)
-0.113
-0.029
-0.031
-0.064
-0.017
Variance Scaling (unbounded)
-0.109
-0.024
-0.026
-0.058
-0.016
Square-root-space Mean-Variance Scaling
-0.101 ✓
-0.026
-0.027
-0.058
-0.017
Power Transformation
-0.100 ✓
-0.026
-0.027
-0.058
-0.017
Delta Change
-0.155
-0.042
-0.062
-0.099
-0.015
Local Intensity Scaling
-0.127
-0.045
-0.039
-0.072
-0.028
Empirical Quantile Mapping
-0.098
-0.035
-0.032
-0.057
-0.024
Gamma Quantile Mapping
-0.108
-0.027
-0.026
-0.057
-0.019
Detrended Quantile Mapping
-0.185
-0.071
-0.086
-0.122
-0.044
Quantile Delta Mapping
-0.176
-0.075
-0.090
-0.123
-0.062
Scaled Distribution Mapping
-0.213
-0.091
-0.114
-0.144
-0.080
CDF-transform
-0.193
-0.077
-0.093
-0.140
-0.061
MVS with all-zero guard (variant)
-0.113
-0.029
-0.031
-0.064
-0.017
More scores by target: test years, fair CRPS, bias, correlation, spread, reliability, coverage
Amount skill (CRPSS), fit 1993–2016, scored 2017–2025
Method
Jun
Jul
Aug
Sep
JJAS
Raw ECMWF (no correction)
-0.550
-0.566
-0.610
-0.641
-1.266
Linear Scaling
-0.065
-0.035
+0.019
-0.086
-0.082
Mean-Variance Scaling (operational)
-0.030
-0.000
+0.055
-0.034
-0.018
Variance Scaling (unbounded)
-0.026
+0.006
+0.059
-0.031
-0.016
Square-root-space Mean-Variance Scaling
-0.021
+0.003
+0.058
-0.031
-0.014
Power Transformation
-0.021
+0.004
+0.055
-0.029
-0.016
Delta Change
-0.057
-0.009
+0.055
-0.067
-0.058
Local Intensity Scaling
-0.063
-0.034
+0.020
-0.083
-0.081
Empirical Quantile Mapping
-0.030
-0.003
+0.052
-0.040
-0.032
Gamma Quantile Mapping
-0.021
-0.001
+0.057
-0.029
-0.012
Detrended Quantile Mapping
-0.076
-0.033
+0.042
-0.070
-0.078
Quantile Delta Mapping
-0.091
-0.046
+0.030
-0.071
-0.097
Scaled Distribution Mapping
-0.102
-0.057
+0.021
-0.079
-0.110
CDF-transform
-0.089
-0.034
+0.036
-0.076
-0.081
MVS with all-zero guard (variant)
-0.030
-0.000
+0.055
-0.034
-0.018
Amount skill with the fair CRPS (diagnostic), 1993–2016
Method
Jun
Jul
Aug
Sep
JJAS
Raw ECMWF (no correction)
-0.831
-0.650
-0.802
-0.855
-1.379
Linear Scaling
-0.131
-0.040
-0.070
-0.096
-0.070
Mean-Variance Scaling (operational)
-0.109
-0.014
-0.035
-0.069
-0.039
Variance Scaling (unbounded)
-0.106
-0.008 ✓✓
-0.029 ✓✓
-0.068 ✓
-0.038
Square-root-space Mean-Variance Scaling
-0.101 ✓
-0.010 ✓
-0.030 ✓✓
-0.066 ✓
-0.037 ✓
Power Transformation
-0.104
-0.008 ✓
-0.029
-0.069
-0.038
Delta Change
-0.109
+0.001 ✓
-0.045
-0.069
-0.031
Local Intensity Scaling
-0.129
-0.040
-0.068
-0.094
-0.070
Empirical Quantile Mapping
-0.114
-0.025
-0.044
-0.077
-0.052
Gamma Quantile Mapping
-0.101 ✓
-0.012
-0.029 ✓✓
-0.066 ✓
-0.037
Detrended Quantile Mapping
-0.148
-0.034
-0.074
-0.100
-0.068
Quantile Delta Mapping
-0.160
-0.033
-0.080
-0.108
-0.074
Scaled Distribution Mapping
-0.183
-0.048
-0.098
-0.122
-0.095
CDF-transform
-0.154
-0.037
-0.076
-0.110
-0.075
MVS with all-zero guard (variant)
-0.109
-0.014
-0.035
-0.069
-0.039
Tercile skill (RPSS, no blend), fit 1993–2016, scored 2017–2025
Method
Jun
Jul
Aug
Sep
JJAS
Raw ECMWF (no correction)
-0.327
-0.305
-0.345
-0.326
-0.412
Linear Scaling
-0.025
+0.007
+0.060
-0.065
-0.004
Mean-Variance Scaling (operational)
-0.056
+0.022
+0.066
-0.041
+0.003
Variance Scaling (unbounded)
-0.049
+0.026
+0.071
-0.036
+0.005
Square-root-space Mean-Variance Scaling
-0.032
+0.022
+0.065
-0.034
+0.004
Power Transformation
-0.033
+0.018
+0.061
-0.029
-0.000
Delta Change
-0.088
+0.022
+0.034
-0.086
-0.034
Local Intensity Scaling
-0.032
+0.005
+0.060
-0.063
-0.003
Empirical Quantile Mapping
-0.022
+0.015
+0.068
-0.039
-0.008
Gamma Quantile Mapping
-0.042
+0.017
+0.064
-0.030
+0.003
Detrended Quantile Mapping
-0.106
-0.015
+0.017
-0.099
-0.055
Quantile Delta Mapping
-0.083
-0.028
+0.006
-0.097
-0.062
Scaled Distribution Mapping
-0.095
-0.042
-0.005
-0.118
-0.079
CDF-transform
-0.129
-0.017
+0.009
-0.101
-0.059
MVS with all-zero guard (variant)
-0.056
+0.022
+0.066
-0.041
+0.003
Ensemble-mean bias (mm), 1993–2016
Method
Jun
Jul
Aug
Sep
JJAS
Raw ECMWF (no correction)
-0.4
-0.3
+1.1
+8.4
+8.8
Linear Scaling
+0.1
+0.1
+0.1
+0.1
+0.1
Mean-Variance Scaling (operational)
+0.1
+0.3
+0.1
+0.1
-0.0
Variance Scaling (unbounded)
+0.1
+0.1
+0.0
+0.0
-0.0
Square-root-space Mean-Variance Scaling
+0.0
+0.1
+0.1
+0.1
-0.0
Power Transformation
+0.0
+0.1
+0.0
+0.0
-0.0
Delta Change
+0.1
+0.1
+0.1
+0.1
+0.1
Local Intensity Scaling
+0.1
+0.0
+0.0
+0.1
+0.1
Empirical Quantile Mapping
+0.1
+0.0
+0.0
+0.0
+0.1
Gamma Quantile Mapping
+0.0
+0.1
+0.0
+0.0
-0.1
Detrended Quantile Mapping
+0.0
+0.2
+0.0
+0.1
-0.7
Quantile Delta Mapping
+0.8
+0.4
+0.6
+0.7
+1.2
Scaled Distribution Mapping
-1.3
-3.4
-1.9
-1.8
-4.2
CDF-transform
+0.2
+0.3
+0.2
+0.2
-0.1
MVS with all-zero guard (variant)
+0.1
+0.3
+0.1
+0.1
-0.0
Correlation of the ensemble mean with CHIRPS over years, 1993–2016
Method
Jun
Jul
Aug
Sep
JJAS
Raw ECMWF (no correction)
+0.06
+0.16
+0.10
+0.05
+0.18
Linear Scaling
-0.03
+0.04
-0.00
-0.05
+0.08
Mean-Variance Scaling (operational)
-0.04
+0.07
+0.01
-0.06
+0.08
Variance Scaling (unbounded)
-0.04
+0.03
-0.02
-0.07
+0.07
Square-root-space Mean-Variance Scaling
-0.04
+0.06
+0.00
-0.06
+0.08
Power Transformation
-0.04
+0.04
-0.02
-0.06
+0.07
Delta Change
-0.03
+0.04
-0.00
-0.05
+0.08
Local Intensity Scaling
-0.04
+0.04
-0.01
-0.06
+0.08
Empirical Quantile Mapping
-0.05
+0.04
-0.02
-0.07
+0.06
Gamma Quantile Mapping
-0.05
+0.04
-0.02
-0.07
+0.07
Detrended Quantile Mapping
-0.03
+0.04
-0.00
-0.06
+0.08
Quantile Delta Mapping
-0.03
+0.03
-0.01
-0.05
+0.08
Scaled Distribution Mapping
-0.03
+0.05
-0.01
-0.05
+0.09
CDF-transform
-0.02
+0.04
+0.00
-0.05
+0.08
MVS with all-zero guard (variant)
-0.04
+0.07
+0.01
-0.06
+0.08
Spread–error ratio, 1993–2016 (1 = spread matches the error)
Score coverage, mean per year, 1993–2016 (share of the region’s area)
Target
Amount cells
Amount area
Probability cells
Probability area
Jun
1484
100%
1479
100%
Jul
1484
100%
1221
82%
Aug
1484
100%
1272
86%
Sep
1484
100%
1484
100%
JJAS
1484
100%
1484
100%
Dry months: shares of totals at exactly 0 mm and at ≤ 1 mm, CHIRPS and corrected
Area-weighted mean share over cells, pooled leave-one-year-out 1993–2025
Exactly 0 mm
≤ 1 mm
Jun: CHIRPS
0.1%
1.4%
Raw ECMWF (no correction)
0.0%
4.7%
Linear Scaling
0.0%
3.2%
Mean-Variance Scaling (operational)
1.7%
3.2%
Variance Scaling (unbounded)
1.3%
2.5%
Square-root-space Mean-Variance Scaling
0.0%
1.8%
Power Transformation
0.0%
2.4%
Delta Change
0.1%
1.9%
Local Intensity Scaling
1.5%
1.5%
Empirical Quantile Mapping
1.5%
1.5%
Gamma Quantile Mapping
1.5%
2.5%
Detrended Quantile Mapping
1.3%
1.8%
Quantile Delta Mapping
1.5%
1.8%
Scaled Distribution Mapping
6.4%
6.6%
CDF-transform
0.0%
1.6%
MVS with all-zero guard (variant)
1.7%
3.2%
Jul: CHIRPS
0.0%
9.1%
Raw ECMWF (no correction)
0.0%
1.1%
Linear Scaling
0.0%
11.3%
Mean-Variance Scaling (operational)
9.9%
12.3%
Variance Scaling (unbounded)
1.3%
9.3%
Square-root-space Mean-Variance Scaling
2.0%
9.5%
Power Transformation
0.0%
9.5%
Delta Change
0.0%
9.6%
Local Intensity Scaling
9.1%
9.1%
Empirical Quantile Mapping
9.1%
9.1%
Gamma Quantile Mapping
6.9%
9.5%
Detrended Quantile Mapping
9.1%
10.1%
Quantile Delta Mapping
9.1%
10.2%
Scaled Distribution Mapping
5.5%
11.1%
CDF-transform
0.0%
9.5%
MVS with all-zero guard (variant)
9.9%
12.3%
Aug: CHIRPS
0.0%
4.4%
Raw ECMWF (no correction)
0.0%
1.6%
Linear Scaling
0.0%
7.4%
Mean-Variance Scaling (operational)
5.9%
8.5%
Variance Scaling (unbounded)
0.4%
4.9%
Square-root-space Mean-Variance Scaling
0.4%
5.4%
Power Transformation
0.0%
5.0%
Delta Change
0.0%
4.8%
Local Intensity Scaling
4.4%
4.4%
Empirical Quantile Mapping
4.4%
4.4%
Gamma Quantile Mapping
1.7%
4.7%
Detrended Quantile Mapping
4.4%
5.2%
Quantile Delta Mapping
4.3%
5.2%
Scaled Distribution Mapping
3.0%
6.3%
CDF-transform
0.0%
4.7%
MVS with all-zero guard (variant)
5.9%
8.5%
Sep: CHIRPS
0.1%
0.2%
Raw ECMWF (no correction)
0.0%
0.6%
Linear Scaling
0.0%
1.2%
Mean-Variance Scaling (operational)
1.1%
1.7%
Variance Scaling (unbounded)
0.5%
0.8%
Square-root-space Mean-Variance Scaling
0.0%
0.4%
Power Transformation
0.0%
0.8%
Delta Change
0.1%
0.3%
Local Intensity Scaling
0.2%
0.2%
Empirical Quantile Mapping
0.2%
0.2%
Gamma Quantile Mapping
0.2%
0.5%
Detrended Quantile Mapping
0.2%
0.3%
Quantile Delta Mapping
0.3%
0.3%
Scaled Distribution Mapping
1.8%
1.8%
CDF-transform
0.0%
0.1%
MVS with all-zero guard (variant)
1.1%
1.7%
JJAS: CHIRPS
0.0%
0.0%
Raw ECMWF (no correction)
0.0%
0.0%
Linear Scaling
0.0%
0.0%
Mean-Variance Scaling (operational)
0.3%
0.5%
Variance Scaling (unbounded)
0.1%
0.2%
Square-root-space Mean-Variance Scaling
0.0%
0.0%
Power Transformation
0.0%
0.0%
Delta Change
0.0%
0.0%
Local Intensity Scaling
0.0%
0.0%
Empirical Quantile Mapping
0.0%
0.0%
Gamma Quantile Mapping
0.0%
0.0%
Detrended Quantile Mapping
0.0%
0.0%
Quantile Delta Mapping
0.0%
0.0%
Scaled Distribution Mapping
1.0%
1.0%
CDF-transform
0.0%
0.0%
MVS with all-zero guard (variant)
0.3%
0.5%
Distribution of the corrected members (mean, spread, 10th and 90th percentiles)
Mean of the corrected members / CHIRPS (area-weighted median of cell ratios, 1993–2025; 1 = same)
Method
Jun
Jul
Aug
Sep
JJAS
Raw ECMWF (no correction)
0.92
1.16
1.12
1.03
1.07
Linear Scaling
1.00
1.00
1.00
1.00
1.00
Mean-Variance Scaling (operational)
1.00
1.00
1.00
1.00
1.00
Variance Scaling (unbounded)
1.00
1.00
1.00
1.00
1.00
Square-root-space Mean-Variance Scaling
1.00
1.00
1.00
1.00
1.00
Power Transformation
1.00
1.00
1.00
1.00
1.00
Delta Change
1.00
1.00
1.00
1.00
1.00
Local Intensity Scaling
1.00
1.00
1.00
1.00
1.00
Empirical Quantile Mapping
1.00
1.00
1.00
1.00
1.00
Gamma Quantile Mapping
1.00
1.00
1.00
1.00
1.00
Detrended Quantile Mapping
1.00
1.00
1.00
1.00
1.00
Quantile Delta Mapping
1.01
1.00
1.00
1.01
1.00
Scaled Distribution Mapping
0.97
0.98
0.98
0.98
0.98
CDF-transform
1.00
1.00
1.00
1.01
1.00
MVS with all-zero guard (variant)
1.00
1.00
1.00
1.00
1.00
Standard deviation of the corrected members / CHIRPS (area-weighted median of cell ratios, 1993–2025; 1 = same)
Method
Jun
Jul
Aug
Sep
JJAS
Raw ECMWF (no correction)
0.96
1.13
1.14
1.16
1.10
Linear Scaling
1.11
1.04
1.16
1.25
1.15
Mean-Variance Scaling (operational)
1.01
1.01
1.01
1.01
1.01
Variance Scaling (unbounded)
1.01
1.00
1.00
1.01
1.01
Square-root-space Mean-Variance Scaling
0.99
1.03
1.01
1.00
1.00
Power Transformation
1.01
1.00
1.00
1.01
1.01
Delta Change
1.14
1.11
1.11
1.12
1.12
Local Intensity Scaling
1.09
1.00
1.08
1.23
1.13
Empirical Quantile Mapping
1.00
1.00
1.00
1.00
1.00
Gamma Quantile Mapping
0.98
1.01
0.99
0.98
1.00
Detrended Quantile Mapping
1.04
1.01
1.02
1.05
1.04
Quantile Delta Mapping
1.06
1.04
1.05
1.08
1.06
Scaled Distribution Mapping
0.94
1.01
1.01
0.97
1.02
CDF-transform
1.05
1.01
1.05
1.09
1.07
MVS with all-zero guard (variant)
1.01
1.01
1.01
1.01
1.01
10th percentile of the corrected members / CHIRPS (area-weighted median of cell ratios, 1993–2025; 1 = same)
Method
Jun
Jul
Aug
Sep
JJAS
Raw ECMWF (no correction)
0.73
1.06
0.96
0.75
0.97
Linear Scaling
0.79
0.89
0.83
0.80
0.92
Mean-Variance Scaling (operational)
0.97
0.95
0.96
0.98
0.98
Variance Scaling (unbounded)
0.97
0.97
0.97
0.99
0.98
Square-root-space Mean-Variance Scaling
0.96
0.95
0.96
0.97
0.98
Power Transformation
0.93
0.95
0.95
0.96
0.98
Delta Change
0.86
0.91
0.91
0.91
0.94
Local Intensity Scaling
0.84
0.91
0.89
0.80
0.92
Empirical Quantile Mapping
0.98
0.98
0.99
0.98
0.99
Gamma Quantile Mapping
0.95
0.95
0.96
0.96
0.98
Detrended Quantile Mapping
0.91
0.95
0.94
0.95
0.96
Quantile Delta Mapping
0.93
0.94
0.95
0.94
0.97
Scaled Distribution Mapping
0.91
0.94
0.95
0.94
0.97
CDF-transform
0.92
0.95
0.93
0.94
0.96
MVS with all-zero guard (variant)
0.97
0.95
0.96
0.98
0.98
90th percentile of the corrected members / CHIRPS (area-weighted median of cell ratios, 1993–2025; 1 = same)
Method
Jun
Jul
Aug
Sep
JJAS
Raw ECMWF (no correction)
0.99
1.16
1.13
1.11
1.09
Linear Scaling
1.08
1.05
1.06
1.10
1.04
Mean-Variance Scaling (operational)
1.01
1.03
1.02
1.02
1.01
Variance Scaling (unbounded)
1.01
1.02
1.02
1.01
1.01
Square-root-space Mean-Variance Scaling
1.02
1.03
1.02
1.02
1.01
Power Transformation
1.02
1.02
1.02
1.02
1.01
Delta Change
1.07
1.05
1.04
1.05
1.04
Local Intensity Scaling
1.07
1.01
1.03
1.10
1.04
Empirical Quantile Mapping
1.03
1.02
1.02
1.02
1.01
Gamma Quantile Mapping
1.01
1.02
1.02
1.02
1.01
Detrended Quantile Mapping
1.04
1.02
1.02
1.03
1.02
Quantile Delta Mapping
1.04
1.02
1.02
1.04
1.02
Scaled Distribution Mapping
0.98
0.99
0.99
0.99
0.99
CDF-transform
1.04
1.02
1.03
1.04
1.02
MVS with all-zero guard (variant)
1.01
1.03
1.02
1.02
1.01
Tables for: JJAS R1+R2 rainfall domain. Screening marks are computed for the national aggregate (All Ethiopia) only. Bold: the operational method. Skill is against the CHIRPS training climatology (0 = no better than climatology).
JJAS season at a glance — JJAS R1+R2 rainfall domain
Method
Amount CRPSS
Tercile RPSS (no blend)
Diagnostics, leave-one-year-out 1993–2016
1993–2016
2017–2025
1993–2016
2017–2025
Mean bias (mm)
MAE (mm)
Correlation
Spread–error
Reliability index
Members ≤ 1 mm
Raw ECMWF (no correction)
-1.328
-1.314
-0.545
-0.520
+14.7
196.3
0.24
0.37
0.82
0.0%
Linear Scaling
-0.043
-0.081
+0.001
-0.026
+0.2
97.0
0.15
0.85
0.21
0.0%
Mean-Variance Scaling (operational)
-0.015
-0.024
+0.010
-0.013
-0.1
95.8
0.16
0.83
0.17
0.0%
Variance Scaling (unbounded)
-0.015
-0.024
+0.010
-0.013
-0.1
95.8
0.16
0.83
0.16
0.0%
Square-root-space Mean-Variance Scaling
-0.014
-0.023
+0.010
-0.014
-0.1
95.6
0.15
0.83
0.17
0.0%
Power Transformation
-0.015
-0.025
+0.010
-0.016
-0.0
95.8
0.16
0.83
0.16
0.0%
Delta Change
-0.017
-0.056
+0.019
-0.004
+0.2
97.0
0.15
0.98
0.05
0.0%
Local Intensity Scaling
-0.043
-0.080
+0.001
-0.026
+0.2
97.0
0.15
0.85
0.21
0.0%
Empirical Quantile Mapping
-0.030
-0.039
-0.008
-0.027
+0.1
95.4
0.15
0.84
0.16
0.0%
Gamma Quantile Mapping
-0.014
-0.023
+0.010
-0.015
-0.1
95.6
0.15
0.82
0.17
0.0%
Detrended Quantile Mapping
-0.040
-0.074
-0.012
-0.033
-1.2
97.1
0.14
0.84
0.16
0.0%
Quantile Delta Mapping
-0.042
-0.086
-0.017
-0.039
+1.1
97.3
0.15
0.85
0.18
0.0%
Scaled Distribution Mapping
-0.057
-0.099
-0.032
-0.058
-6.4
97.3
0.15
0.83
0.30
0.5%
CDF-transform
-0.042
-0.073
-0.009
-0.028
-0.3
97.0
0.15
0.79
0.19
0.0%
MVS with all-zero guard (variant)
-0.015
-0.024
+0.010
-0.013
-0.1
95.8
0.16
0.83
0.17
0.0%
Amount skill (CRPSS) by target, leave-one-year-out 1993–2016
Method
Jun
Jul
Aug
Sep
JJAS
Raw ECMWF (no correction)
-0.799
-0.522
-0.729
-0.889
-1.328
Linear Scaling
-0.112
-0.015
-0.052
-0.063
-0.043
Mean-Variance Scaling (operational)
-0.089
+0.010
-0.016
-0.051
-0.015
Variance Scaling (unbounded)
-0.086
+0.009
-0.016
-0.051
-0.015
Square-root-space Mean-Variance Scaling
-0.083
+0.008
-0.016
-0.051
-0.014
Power Transformation
-0.086
+0.008
-0.017
-0.051
-0.015
Delta Change
-0.098
+0.013
-0.035
-0.047
-0.017
Local Intensity Scaling
-0.111
-0.015
-0.051
-0.062
-0.043
Empirical Quantile Mapping
-0.099
-0.007
-0.031
-0.065
-0.030
Gamma Quantile Mapping
-0.083
+0.003
-0.017
-0.051
-0.014
Detrended Quantile Mapping
-0.125
-0.010
-0.054
-0.068
-0.040
Quantile Delta Mapping
-0.137
-0.006
-0.058
-0.070
-0.042
Scaled Distribution Mapping
-0.152
-0.018
-0.073
-0.081
-0.057
CDF-transform
-0.128
-0.008
-0.052
-0.067
-0.042
MVS with all-zero guard (variant)
-0.089
+0.010
-0.016
-0.051
-0.015
Tercile skill (RPSS of smoothed counts, no blend) by target, 1993–2016
Method
Jun
Jul
Aug
Sep
JJAS
Raw ECMWF (no correction)
-0.442
-0.364
-0.430
-0.450
-0.545
Linear Scaling
-0.103
+0.000
-0.032
-0.052
+0.001
Mean-Variance Scaling (operational)
-0.101
+0.018
-0.022
-0.049
+0.010
Variance Scaling (unbounded)
-0.098
+0.018
-0.023
-0.049
+0.010
Square-root-space Mean-Variance Scaling
-0.095
+0.017
-0.023
-0.050
+0.010
Power Transformation
-0.097
+0.017
-0.024
-0.049
+0.010
Delta Change
-0.093
+0.020
-0.040
-0.050
+0.019
Local Intensity Scaling
-0.102
-0.000
-0.032
-0.053
+0.001
Empirical Quantile Mapping
-0.108
+0.006
-0.040
-0.058
-0.008
Gamma Quantile Mapping
-0.096
+0.016
-0.023
-0.050
+0.010
Detrended Quantile Mapping
-0.131
-0.004
-0.063
-0.072
-0.012
Quantile Delta Mapping
-0.141
-0.001
-0.067
-0.077
-0.017
Scaled Distribution Mapping
-0.161
-0.013
-0.086
-0.092
-0.032
CDF-transform
-0.134
-0.000
-0.056
-0.072
-0.009
MVS with all-zero guard (variant)
-0.101
+0.018
-0.022
-0.049
+0.010
More scores by target: test years, fair CRPS, bias, correlation, spread, reliability, coverage
Amount skill (CRPSS), fit 1993–2016, scored 2017–2025
Method
Jun
Jul
Aug
Sep
JJAS
Raw ECMWF (no correction)
-0.598
-0.487
-0.590
-0.637
-1.314
Linear Scaling
-0.066
-0.043
+0.012
-0.057
-0.081
Mean-Variance Scaling (operational)
-0.026
-0.002
+0.046
-0.023
-0.024
Variance Scaling (unbounded)
-0.024
-0.003
+0.046
-0.024
-0.024
Square-root-space Mean-Variance Scaling
-0.022
-0.006
+0.046
-0.024
-0.023
Power Transformation
-0.020
-0.006
+0.043
-0.021
-0.025
Delta Change
-0.058
-0.016
+0.048
-0.048
-0.056
Local Intensity Scaling
-0.065
-0.043
+0.013
-0.057
-0.080
Empirical Quantile Mapping
-0.034
-0.011
+0.041
-0.036
-0.039
Gamma Quantile Mapping
-0.022
-0.012
+0.045
-0.024
-0.023
Detrended Quantile Mapping
-0.075
-0.035
+0.038
-0.046
-0.074
Quantile Delta Mapping
-0.090
-0.042
+0.031
-0.045
-0.086
Scaled Distribution Mapping
-0.102
-0.052
+0.020
-0.055
-0.099
CDF-transform
-0.084
-0.035
+0.033
-0.049
-0.073
MVS with all-zero guard (variant)
-0.026
-0.002
+0.046
-0.023
-0.024
Amount skill with the fair CRPS (diagnostic), 1993–2016
Method
Jun
Jul
Aug
Sep
JJAS
Raw ECMWF (no correction)
-0.841
-0.560
-0.769
-0.933
-1.398
Linear Scaling
-0.123
-0.027
-0.059
-0.072
-0.056
Mean-Variance Scaling (operational)
-0.102
+0.003
-0.023
-0.060
-0.026
Variance Scaling (unbounded)
-0.099
+0.002
-0.023
-0.061
-0.026
Square-root-space Mean-Variance Scaling
-0.096
+0.002
-0.023
-0.060
-0.025
Power Transformation
-0.099
+0.002
-0.024
-0.061
-0.026
Delta Change
-0.102
+0.014
-0.037
-0.049
-0.017
Local Intensity Scaling
-0.122
-0.027
-0.059
-0.072
-0.056
Empirical Quantile Mapping
-0.113
-0.015
-0.039
-0.075
-0.042
Gamma Quantile Mapping
-0.096
-0.002
-0.024
-0.060
-0.025
Detrended Quantile Mapping
-0.139
-0.018
-0.063
-0.078
-0.052
Quantile Delta Mapping
-0.152
-0.012
-0.067
-0.079
-0.053
Scaled Distribution Mapping
-0.172
-0.028
-0.086
-0.095
-0.073
CDF-transform
-0.143
-0.019
-0.063
-0.078
-0.055
MVS with all-zero guard (variant)
-0.102
+0.003
-0.023
-0.060
-0.026
Tercile skill (RPSS, no blend), fit 1993–2016, scored 2017–2025
Method
Jun
Jul
Aug
Sep
JJAS
Raw ECMWF (no correction)
-0.414
-0.319
-0.404
-0.338
-0.520
Linear Scaling
-0.020
-0.023
+0.044
-0.046
-0.026
Mean-Variance Scaling (operational)
-0.011
-0.004
+0.053
-0.032
-0.013
Variance Scaling (unbounded)
-0.006
-0.004
+0.053
-0.032
-0.013
Square-root-space Mean-Variance Scaling
-0.002
-0.007
+0.052
-0.030
-0.014
Power Transformation
+0.002
-0.011
+0.049
-0.026
-0.016
Delta Change
-0.022
+0.002
+0.059
-0.049
-0.004
Local Intensity Scaling
-0.019
-0.023
+0.043
-0.047
-0.026
Empirical Quantile Mapping
-0.015
-0.008
+0.057
-0.037
-0.027
Gamma Quantile Mapping
-0.003
-0.010
+0.051
-0.028
-0.015
Detrended Quantile Mapping
-0.031
-0.027
+0.050
-0.052
-0.033
Quantile Delta Mapping
-0.036
-0.031
+0.040
-0.053
-0.039
Scaled Distribution Mapping
-0.052
-0.047
+0.033
-0.069
-0.058
CDF-transform
-0.039
-0.026
+0.052
-0.052
-0.028
MVS with all-zero guard (variant)
-0.011
-0.004
+0.053
-0.032
-0.013
Ensemble-mean bias (mm), 1993–2016
Method
Jun
Jul
Aug
Sep
JJAS
Raw ECMWF (no correction)
+4.1
-8.2
-2.5
+21.3
+14.7
Linear Scaling
+0.2
+0.1
+0.1
+0.1
+0.2
Mean-Variance Scaling (operational)
+0.1
+0.1
+0.0
+0.0
-0.1
Variance Scaling (unbounded)
+0.1
+0.1
+0.0
+0.0
-0.1
Square-root-space Mean-Variance Scaling
+0.1
-0.0
+0.0
+0.0
-0.1
Power Transformation
+0.0
+0.1
+0.0
+0.0
-0.0
Delta Change
+0.2
+0.1
+0.1
+0.1
+0.2
Local Intensity Scaling
+0.2
+0.1
+0.1
+0.1
+0.2
Empirical Quantile Mapping
+0.1
+0.1
+0.0
+0.0
+0.1
Gamma Quantile Mapping
+0.1
+0.1
+0.0
+0.0
-0.1
Detrended Quantile Mapping
-0.1
+0.2
+0.0
+0.1
-1.2
Quantile Delta Mapping
+1.0
+0.4
+0.6
+0.5
+1.1
Scaled Distribution Mapping
-1.4
-5.7
-2.9
-2.4
-6.4
CDF-transform
+0.1
+0.4
+0.1
-0.1
-0.3
MVS with all-zero guard (variant)
+0.1
+0.1
+0.0
+0.0
-0.1
Correlation of the ensemble mean with CHIRPS over years, 1993–2016
Method
Jun
Jul
Aug
Sep
JJAS
Raw ECMWF (no correction)
+0.09
+0.23
+0.12
+0.08
+0.24
Linear Scaling
+0.01
+0.09
-0.02
-0.04
+0.15
Mean-Variance Scaling (operational)
+0.00
+0.11
-0.00
-0.03
+0.16
Variance Scaling (unbounded)
+0.00
+0.11
-0.00
-0.03
+0.16
Square-root-space Mean-Variance Scaling
-0.00
+0.11
-0.00
-0.03
+0.15
Power Transformation
-0.00
+0.11
-0.00
-0.03
+0.16
Delta Change
+0.01
+0.09
-0.02
-0.04
+0.15
Local Intensity Scaling
+0.01
+0.08
-0.02
-0.04
+0.15
Empirical Quantile Mapping
-0.01
+0.10
-0.01
-0.04
+0.15
Gamma Quantile Mapping
-0.00
+0.11
-0.01
-0.03
+0.15
Detrended Quantile Mapping
+0.00
+0.08
-0.02
-0.04
+0.14
Quantile Delta Mapping
+0.01
+0.08
-0.02
-0.04
+0.15
Scaled Distribution Mapping
+0.01
+0.09
-0.02
-0.03
+0.15
CDF-transform
+0.01
+0.10
-0.00
-0.03
+0.15
MVS with all-zero guard (variant)
+0.00
+0.11
-0.00
-0.03
+0.16
Spread–error ratio, 1993–2016 (1 = spread matches the error)
Score coverage, mean per year, 1993–2016 (share of the region’s area)
Target
Amount cells
Amount area
Probability cells
Probability area
Jun
833
100%
833
100%
Jul
833
100%
833
100%
Aug
833
100%
833
100%
Sep
833
100%
833
100%
JJAS
833
100%
833
100%
Dry months: shares of totals at exactly 0 mm and at ≤ 1 mm, CHIRPS and corrected
Area-weighted mean share over cells, pooled leave-one-year-out 1993–2025
Exactly 0 mm
≤ 1 mm
Jun: CHIRPS
0.0%
0.7%
Raw ECMWF (no correction)
0.0%
1.2%
Linear Scaling
0.0%
1.1%
Mean-Variance Scaling (operational)
0.7%
1.0%
Variance Scaling (unbounded)
0.3%
0.4%
Square-root-space Mean-Variance Scaling
0.0%
0.5%
Power Transformation
0.0%
0.5%
Delta Change
0.0%
0.9%
Local Intensity Scaling
0.7%
0.7%
Empirical Quantile Mapping
0.7%
0.7%
Gamma Quantile Mapping
0.7%
1.0%
Detrended Quantile Mapping
0.6%
0.8%
Quantile Delta Mapping
0.7%
0.9%
Scaled Distribution Mapping
2.3%
2.3%
CDF-transform
0.0%
0.6%
MVS with all-zero guard (variant)
0.7%
1.0%
Jul: CHIRPS
0.0%
0.0%
Raw ECMWF (no correction)
0.0%
0.0%
Linear Scaling
0.0%
0.0%
Mean-Variance Scaling (operational)
0.0%
0.0%
Variance Scaling (unbounded)
0.0%
0.0%
Square-root-space Mean-Variance Scaling
0.0%
0.0%
Power Transformation
0.0%
0.0%
Delta Change
0.0%
0.0%
Local Intensity Scaling
0.0%
0.0%
Empirical Quantile Mapping
0.0%
0.0%
Gamma Quantile Mapping
0.0%
0.0%
Detrended Quantile Mapping
0.0%
0.0%
Quantile Delta Mapping
0.0%
0.0%
Scaled Distribution Mapping
1.2%
1.2%
CDF-transform
0.0%
0.0%
MVS with all-zero guard (variant)
0.0%
0.0%
Aug: CHIRPS
0.0%
0.0%
Raw ECMWF (no correction)
0.0%
0.0%
Linear Scaling
0.0%
0.0%
Mean-Variance Scaling (operational)
0.0%
0.0%
Variance Scaling (unbounded)
0.0%
0.0%
Square-root-space Mean-Variance Scaling
0.0%
0.0%
Power Transformation
0.0%
0.0%
Delta Change
0.0%
0.0%
Local Intensity Scaling
0.0%
0.0%
Empirical Quantile Mapping
0.0%
0.0%
Gamma Quantile Mapping
0.0%
0.0%
Detrended Quantile Mapping
0.0%
0.0%
Quantile Delta Mapping
0.0%
0.0%
Scaled Distribution Mapping
0.9%
0.9%
CDF-transform
0.0%
0.0%
MVS with all-zero guard (variant)
0.0%
0.0%
Sep: CHIRPS
0.0%
0.2%
Raw ECMWF (no correction)
0.0%
0.0%
Linear Scaling
0.0%
0.0%
Mean-Variance Scaling (operational)
0.1%
0.1%
Variance Scaling (unbounded)
0.0%
0.0%
Square-root-space Mean-Variance Scaling
0.0%
0.0%
Power Transformation
0.0%
0.0%
Delta Change
0.0%
0.2%
Local Intensity Scaling
0.2%
0.2%
Empirical Quantile Mapping
0.2%
0.2%
Gamma Quantile Mapping
0.2%
0.2%
Detrended Quantile Mapping
0.1%
0.1%
Quantile Delta Mapping
0.2%
0.2%
Scaled Distribution Mapping
1.1%
1.1%
CDF-transform
0.0%
0.0%
MVS with all-zero guard (variant)
0.1%
0.1%
JJAS: CHIRPS
0.0%
0.0%
Raw ECMWF (no correction)
0.0%
0.0%
Linear Scaling
0.0%
0.0%
Mean-Variance Scaling (operational)
0.0%
0.0%
Variance Scaling (unbounded)
0.0%
0.0%
Square-root-space Mean-Variance Scaling
0.0%
0.0%
Power Transformation
0.0%
0.0%
Delta Change
0.0%
0.0%
Local Intensity Scaling
0.0%
0.0%
Empirical Quantile Mapping
0.0%
0.0%
Gamma Quantile Mapping
0.0%
0.0%
Detrended Quantile Mapping
0.0%
0.0%
Quantile Delta Mapping
0.0%
0.0%
Scaled Distribution Mapping
1.0%
1.0%
CDF-transform
0.0%
0.0%
MVS with all-zero guard (variant)
0.0%
0.0%
Distribution of the corrected members (mean, spread, 10th and 90th percentiles)
Mean of the corrected members / CHIRPS (area-weighted median of cell ratios, 1993–2025; 1 = same)
Method
Jun
Jul
Aug
Sep
JJAS
Raw ECMWF (no correction)
1.01
0.97
0.99
1.12
1.01
Linear Scaling
1.00
1.00
1.00
1.00
1.00
Mean-Variance Scaling (operational)
1.00
1.00
1.00
1.00
1.00
Variance Scaling (unbounded)
1.00
1.00
1.00
1.00
1.00
Square-root-space Mean-Variance Scaling
1.00
1.00
1.00
1.00
1.00
Power Transformation
1.00
1.00
1.00
1.00
1.00
Delta Change
1.00
1.00
1.00
1.00
1.00
Local Intensity Scaling
1.00
1.00
1.00
1.00
1.00
Empirical Quantile Mapping
1.00
1.00
1.00
1.00
1.00
Gamma Quantile Mapping
1.00
1.00
1.00
1.00
1.00
Detrended Quantile Mapping
1.00
1.00
1.00
1.00
1.00
Quantile Delta Mapping
1.00
1.00
1.00
1.00
1.00
Scaled Distribution Mapping
0.99
0.98
0.99
0.98
0.99
CDF-transform
1.00
1.00
1.00
1.00
1.00
MVS with all-zero guard (variant)
1.00
1.00
1.00
1.00
1.00
Standard deviation of the corrected members / CHIRPS (area-weighted median of cell ratios, 1993–2025; 1 = same)
Method
Jun
Jul
Aug
Sep
JJAS
Raw ECMWF (no correction)
1.01
0.80
0.89
1.05
0.93
Linear Scaling
1.02
0.84
0.94
0.99
0.94
Mean-Variance Scaling (operational)
1.01
1.00
1.00
1.01
1.01
Variance Scaling (unbounded)
1.01
1.00
1.00
1.01
1.01
Square-root-space Mean-Variance Scaling
1.00
1.01
1.00
1.00
1.00
Power Transformation
1.01
1.00
1.00
1.01
1.01
Delta Change
1.13
1.05
1.06
1.07
1.12
Local Intensity Scaling
1.02
0.83
0.93
0.99
0.94
Empirical Quantile Mapping
1.00
1.00
1.00
1.00
1.00
Gamma Quantile Mapping
0.99
1.02
1.00
0.99
1.00
Detrended Quantile Mapping
1.01
0.99
1.00
1.01
1.01
Quantile Delta Mapping
1.03
1.01
1.02
1.03
1.02
Scaled Distribution Mapping
0.95
0.99
0.99
0.95
1.08
CDF-transform
1.02
0.96
1.00
1.01
0.99
MVS with all-zero guard (variant)
1.01
1.00
1.00
1.01
1.01
10th percentile of the corrected members / CHIRPS (area-weighted median of cell ratios, 1993–2025; 1 = same)
Method
Jun
Jul
Aug
Sep
JJAS
Raw ECMWF (no correction)
0.96
1.00
0.98
1.11
1.00
Linear Scaling
0.95
1.04
1.00
0.99
1.00
Mean-Variance Scaling (operational)
0.98
0.99
0.99
0.99
1.00
Variance Scaling (unbounded)
0.98
0.99
0.99
0.99
1.00
Square-root-space Mean-Variance Scaling
0.98
0.99
0.99
0.99
1.00
Power Transformation
0.97
0.99
0.99
0.99
0.99
Delta Change
0.91
0.96
0.97
0.95
0.97
Local Intensity Scaling
0.95
1.04
1.00
0.99
1.00
Empirical Quantile Mapping
0.97
0.98
0.99
0.98
0.99
Gamma Quantile Mapping
0.98
0.98
0.99
0.99
1.00
Detrended Quantile Mapping
0.96
0.99
0.98
0.97
0.99
Quantile Delta Mapping
0.96
0.98
0.98
0.98
0.99
Scaled Distribution Mapping
0.97
0.98
0.98
0.98
0.99
CDF-transform
0.97
1.00
0.99
0.98
0.99
MVS with all-zero guard (variant)
0.98
0.99
0.99
0.99
1.00
90th percentile of the corrected members / CHIRPS (area-weighted median of cell ratios, 1993–2025; 1 = same)
Method
Jun
Jul
Aug
Sep
JJAS
Raw ECMWF (no correction)
1.04
0.95
0.99
1.12
1.01
Linear Scaling
1.01
0.98
1.00
1.01
1.00
Mean-Variance Scaling (operational)
1.01
1.01
1.01
1.01
1.01
Variance Scaling (unbounded)
1.01
1.01
1.01
1.01
1.01
Square-root-space Mean-Variance Scaling
1.01
1.02
1.01
1.01
1.01
Power Transformation
1.01
1.01
1.01
1.01
1.01
Delta Change
1.05
1.03
1.02
1.03
1.03
Local Intensity Scaling
1.01
0.97
0.99
1.01
1.00
Empirical Quantile Mapping
1.02
1.01
1.01
1.01
1.01
Gamma Quantile Mapping
1.00
1.02
1.01
1.01
1.01
Detrended Quantile Mapping
1.02
1.01
1.01
1.02
1.01
Quantile Delta Mapping
1.02
1.01
1.01
1.02
1.01
Scaled Distribution Mapping
0.98
0.98
0.99
0.98
0.99
CDF-transform
1.02
1.00
1.01
1.01
1.01
MVS with all-zero guard (variant)
1.01
1.01
1.01
1.01
1.01
Screening statistics for every method, target and score (within-method and family-wide Holm)
Screening rule (docs/36 rule applied as a screen): a method passes for a target and score if, on the leave-one-year-out 1993-2016 per-year scores, its mean improvement over mvs has a one-sided sign-flip p-value below 0.05 after Holm adjustment, and its mean score over 2017-2025 (fits on 1993-2016) is not worse. 'screen_pass': Holm across the 5 targets of one method. 'screen_pass_family': Holm across every method and target of the benchmark for that score. A screening pass is not an operational adoption decision (see the confirmation run).
Screening statistics, CRPS (method minus Mean-Variance Scaling; negative favours the method)
Method
Target
Δ CRPS 1993–2016 (mm)
95% interval
Years better
p (one-sided)
Holm p (method)
Holm p (all 60)
Δ 2017–2025
Screening
Linear Scaling
Jun
+0.42
+0.20 to +0.65
5/24
0.9993
1.0000
1.0000
+0.67
—
Linear Scaling
Jul
+0.50
+0.19 to +0.82
9/24
0.9965
1.0000
1.0000
+0.77
—
Linear Scaling
Aug
+0.71
+0.44 to +1.02
4/24
1.0000
1.0000
1.0000
+0.80
—
Linear Scaling
Sep
+0.55
+0.38 to +0.71
4/24
1.0000
1.0000
1.0000
+1.04
—
Linear Scaling
JJAS
+1.48
+0.68 to +2.32
6/24
0.9993
1.0000
1.0000
+2.90
—
Variance Scaling (unbounded)
Jun
-0.04
-0.08 to +0.00
12/24
0.0473
0.0946
1.0000
-0.07
—
Variance Scaling (unbounded)
Jul
-0.14
-0.17 to -0.10
23/24
0.0000
0.0000
0.0000
-0.14
✓✓
Variance Scaling (unbounded)
Aug
-0.13
-0.15 to -0.11
24/24
0.0000
0.0000
0.0000
-0.08
✓✓
Variance Scaling (unbounded)
Sep
-0.03
-0.05 to -0.01
19/24
0.0030
0.0090
0.1557
-0.05
✓
Variance Scaling (unbounded)
JJAS
-0.04
-0.08 to +0.01
19/24
0.0531
0.0946
1.0000
-0.09
—
Square-root-space Mean-Variance Scaling
Jun
-0.13
-0.21 to -0.04
18/24
0.0030
0.0090
0.1557
-0.16
✓
Square-root-space Mean-Variance Scaling
Jul
-0.08
-0.13 to -0.02
17/24
0.0070
0.0139
0.3478
-0.08
✓
Square-root-space Mean-Variance Scaling
Aug
-0.10
-0.13 to -0.07
22/24
0.0000
0.0000
0.0000
-0.06
✓✓
Square-root-space Mean-Variance Scaling
Sep
-0.06
-0.09 to -0.03
18/24
0.0011
0.0045
0.0610
-0.05
✓
Square-root-space Mean-Variance Scaling
JJAS
-0.11
-0.20 to -0.02
16/24
0.0111
0.0139
0.5330
-0.18
✓
Power Transformation
Jun
-0.07
-0.14 to +0.01
17/24
0.0420
0.1261
1.0000
-0.17
—
Power Transformation
Jul
-0.12
-0.19 to -0.06
20/24
0.0009
0.0038
0.0517
-0.09
✓
Power Transformation
Aug
-0.12
-0.18 to -0.07
20/24
0.0000
0.0002
0.0017
-0.01
✓✓
Power Transformation
Sep
-0.01
-0.07 to +0.04
12/24
0.3596
0.5845
1.0000
-0.10
—
Power Transformation
JJAS
-0.02
-0.11 to +0.06
13/24
0.2923
0.5845
1.0000
-0.07
—
Delta Change
Jun
+0.15
-0.18 to +0.52
13/24
0.7837
1.0000
1.0000
+0.52
—
Delta Change
Jul
-0.16
-0.40 to +0.06
15/24
0.1076
0.5378
1.0000
+0.19
—
Delta Change
Aug
+0.31
+0.04 to +0.60
9/24
0.9772
1.0000
1.0000
+0.01
—
Delta Change
Sep
+0.12
-0.13 to +0.36
8/24
0.8097
1.0000
1.0000
+0.66
—
Delta Change
JJAS
+0.11
-0.91 to +1.15
12/24
0.5781
1.0000
1.0000
+1.82
—
Local Intensity Scaling
Jun
+0.37
+0.15 to +0.59
5/24
0.9982
1.0000
1.0000
+0.63
—
Local Intensity Scaling
Jul
+0.48
+0.18 to +0.81
9/24
0.9960
1.0000
1.0000
+0.76
—
Local Intensity Scaling
Aug
+0.67
+0.40 to +0.96
4/24
1.0000
1.0000
1.0000
+0.78
—
Local Intensity Scaling
Sep
+0.49
+0.34 to +0.65
4/24
1.0000
1.0000
1.0000
+0.97
—
Local Intensity Scaling
JJAS
+1.45
+0.66 to +2.28
6/24
0.9993
1.0000
1.0000
+2.86
—
Empirical Quantile Mapping
Jun
+0.08
-0.01 to +0.18
9/24
0.9407
1.0000
1.0000
+0.01
—
Empirical Quantile Mapping
Jul
+0.23
+0.12 to +0.34
5/24
0.9997
1.0000
1.0000
+0.06
—
Empirical Quantile Mapping
Aug
+0.15
+0.08 to +0.23
4/24
0.9998
1.0000
1.0000
+0.07
—
Empirical Quantile Mapping
Sep
+0.12
+0.06 to +0.18
5/24
0.9999
1.0000
1.0000
+0.13
—
Empirical Quantile Mapping
JJAS
+0.59
+0.19 to +0.94
5/24
0.9969
1.0000
1.0000
+0.64
—
Gamma Quantile Mapping
Jun
-0.13
-0.23 to -0.03
18/24
0.0098
0.0293
0.4787
-0.16
✓
Gamma Quantile Mapping
Jul
-0.01
-0.11 to +0.09
11/24
0.4390
0.4390
1.0000
+0.00
—
Gamma Quantile Mapping
Aug
-0.13
-0.17 to -0.09
22/24
0.0000
0.0000
0.0003
-0.05
✓✓
Gamma Quantile Mapping
Sep
-0.07
-0.11 to -0.03
19/24
0.0018
0.0071
0.0941
-0.09
✓
Gamma Quantile Mapping
JJAS
-0.12
-0.25 to +0.02
16/24
0.0518
0.1037
1.0000
-0.25
—
Detrended Quantile Mapping
Jun
+0.63
+0.31 to +1.03
6/24
1.0000
1.0000
1.0000
+0.89
—
Detrended Quantile Mapping
Jul
+0.42
+0.14 to +0.73
6/24
0.9967
1.0000
1.0000
+0.73
—
Detrended Quantile Mapping
Aug
+0.72
+0.42 to +1.06
4/24
1.0000
1.0000
1.0000
+0.30
—
Detrended Quantile Mapping
Sep
+0.54
+0.34 to +0.78
2/24
1.0000
1.0000
1.0000
+0.71
—
Detrended Quantile Mapping
JJAS
+1.33
+0.39 to +2.37
6/24
0.9923
1.0000
1.0000
+2.74
—
Quantile Delta Mapping
Jun
+0.82
+0.40 to +1.34
4/24
1.0000
1.0000
1.0000
+1.17
—
Quantile Delta Mapping
Jul
+0.42
+0.07 to +0.84
6/24
0.9856
1.0000
1.0000
+1.03
—
Quantile Delta Mapping
Aug
+0.86
+0.48 to +1.32
2/24
1.0000
1.0000
1.0000
+0.57
—
Quantile Delta Mapping
Sep
+0.68
+0.43 to +0.98
2/24
1.0000
1.0000
1.0000
+0.73
—
Quantile Delta Mapping
JJAS
+1.62
+0.57 to +2.88
5/24
0.9976
1.0000
1.0000
+3.61
—
Scaled Distribution Mapping
Jun
+1.11
+0.64 to +1.64
3/24
1.0000
1.0000
1.0000
+1.37
—
Scaled Distribution Mapping
Jul
+0.67
+0.30 to +1.10
5/24
0.9996
1.0000
1.0000
+1.26
—
Scaled Distribution Mapping
Aug
+1.13
+0.69 to +1.62
2/24
1.0000
1.0000
1.0000
+0.76
—
Scaled Distribution Mapping
Sep
+0.86
+0.57 to +1.20
1/24
1.0000
1.0000
1.0000
+0.89
—
Scaled Distribution Mapping
JJAS
+2.39
+1.35 to +3.61
3/24
1.0000
1.0000
1.0000
+4.19
—
CDF-transform
Jun
+0.70
+0.32 to +1.17
6/24
0.9998
1.0000
1.0000
+1.14
—
CDF-transform
Jul
+0.42
+0.12 to +0.76
7/24
0.9933
1.0000
1.0000
+0.76
—
CDF-transform
Aug
+0.73
+0.41 to +1.10
4/24
1.0000
1.0000
1.0000
+0.43
—
CDF-transform
Sep
+0.69
+0.45 to +0.99
1/24
1.0000
1.0000
1.0000
+0.83
—
CDF-transform
JJAS
+1.56
+0.57 to +2.69
6/24
0.9979
1.0000
1.0000
+2.86
—
MVS with all-zero guard (variant)
Jun
+0.00
+0.00 to +0.00
0/24
1.0000
1.0000
— (variant)
+0.00
—
MVS with all-zero guard (variant)
Jul
+0.00
+0.00 to +0.00
0/24
1.0000
1.0000
— (variant)
+0.00
—
MVS with all-zero guard (variant)
Aug
+0.00
+0.00 to +0.00
0/24
1.0000
1.0000
— (variant)
+0.00
—
MVS with all-zero guard (variant)
Sep
+0.00
+0.00 to +0.00
0/24
1.0000
1.0000
— (variant)
+0.00
—
MVS with all-zero guard (variant)
JJAS
+0.00
+0.00 to +0.00
0/24
1.0000
1.0000
— (variant)
+0.00
—
Screening statistics, fair CRPS (method minus Mean-Variance Scaling; negative favours the method)
Method
Target
Δ fair CRPS 1993–2016 (mm)
95% interval
Years better
p (one-sided)
Holm p (method)
Holm p (all 60)
Δ 2017–2025
Screening
Linear Scaling
Jun
+0.36
+0.14 to +0.59
6/24
0.9971
1.0000
1.0000
+0.63
—
Linear Scaling
Jul
+0.57
+0.26 to +0.90
7/24
0.9988
1.0000
1.0000
+0.81
—
Linear Scaling
Aug
+0.68
+0.40 to +0.99
4/24
1.0000
1.0000
1.0000
+0.78
—
Linear Scaling
Sep
+0.47
+0.31 to +0.64
4/24
1.0000
1.0000
1.0000
+1.00
—
Linear Scaling
JJAS
+1.43
+0.62 to +2.27
6/24
0.9990
1.0000
1.0000
+2.87
—
Variance Scaling (unbounded)
Jun
-0.04
-0.08 to -0.00
12/24
0.0314
0.0627
1.0000
-0.08
—
Variance Scaling (unbounded)
Jul
-0.13
-0.17 to -0.09
22/24
0.0000
0.0000
0.0000
-0.13
✓✓
Variance Scaling (unbounded)
Aug
-0.12
-0.14 to -0.09
24/24
0.0000
0.0000
0.0000
-0.08
✓✓
Variance Scaling (unbounded)
Sep
-0.03
-0.04 to -0.00
18/24
0.0134
0.0403
0.6454
-0.05
✓
Variance Scaling (unbounded)
JJAS
-0.03
-0.07 to +0.02
16/24
0.1340
0.1340
1.0000
-0.08
—
Square-root-space Mean-Variance Scaling
Jun
-0.13
-0.21 to -0.04
18/24
0.0031
0.0094
0.1654
-0.16
✓
Square-root-space Mean-Variance Scaling
Jul
-0.08
-0.14 to -0.03
18/24
0.0049
0.0099
0.2514
-0.08
✓
Square-root-space Mean-Variance Scaling
Aug
-0.09
-0.12 to -0.06
22/24
0.0000
0.0000
0.0000
-0.06
✓✓
Square-root-space Mean-Variance Scaling
Sep
-0.06
-0.09 to -0.02
18/24
0.0014
0.0056
0.0756
-0.05
✓
Square-root-space Mean-Variance Scaling
JJAS
-0.09
-0.17 to +0.00
16/24
0.0362
0.0362
1.0000
-0.16
✓
Power Transformation
Jun
-0.08
-0.15 to +0.00
18/24
0.0264
0.0791
1.0000
-0.18
—
Power Transformation
Jul
-0.12
-0.19 to -0.05
20/24
0.0014
0.0054
0.0748
-0.08
✓
Power Transformation
Aug
-0.11
-0.17 to -0.06
20/24
0.0003
0.0013
0.0146
+0.00
—
Power Transformation
Sep
-0.01
-0.07 to +0.04
12/24
0.3328
0.6657
1.0000
-0.10
—
Power Transformation
JJAS
-0.02
-0.10 to +0.07
13/24
0.3681
0.6657
1.0000
-0.06
—
Delta Change
Jun
+0.00
-0.34 to +0.38
13/24
0.5030
1.0000
1.0000
+0.14
—
Delta Change
Jul
-0.31
-0.56 to -0.08
16/24
0.0077
0.0387
0.3875
-0.35
✓
Delta Change
Aug
+0.19
-0.08 to +0.50
12/24
0.8678
1.0000
1.0000
-0.47
—
Delta Change
Sep
+0.00
-0.26 to +0.26
13/24
0.5021
1.0000
1.0000
+0.24
—
Delta Change
JJAS
-0.33
-1.36 to +0.75
15/24
0.2828
1.0000
1.0000
+0.62
—
Local Intensity Scaling
Jun
+0.31
+0.10 to +0.54
6/24
0.9937
1.0000
1.0000
+0.59
—
Local Intensity Scaling
Jul
+0.56
+0.26 to +0.88
7/24
0.9987
1.0000
1.0000
+0.79
—
Local Intensity Scaling
Aug
+0.64
+0.37 to +0.94
4/24
1.0000
1.0000
1.0000
+0.76
—
Local Intensity Scaling
Sep
+0.43
+0.27 to +0.59
4/24
1.0000
1.0000
1.0000
+0.94
—
Local Intensity Scaling
JJAS
+1.40
+0.61 to +2.24
6/24
0.9989
1.0000
1.0000
+2.83
—
Empirical Quantile Mapping
Jun
+0.08
-0.01 to +0.18
9/24
0.9433
1.0000
1.0000
+0.02
—
Empirical Quantile Mapping
Jul
+0.25
+0.14 to +0.36
5/24
0.9999
1.0000
1.0000
+0.08
—
Empirical Quantile Mapping
Aug
+0.17
+0.10 to +0.25
4/24
0.9999
1.0000
1.0000
+0.08
—
Empirical Quantile Mapping
Sep
+0.13
+0.07 to +0.19
3/24
1.0000
1.0000
1.0000
+0.14
—
Empirical Quantile Mapping
JJAS
+0.63
+0.25 to +0.96
5/24
0.9986
1.0000
1.0000
+0.66
—
Gamma Quantile Mapping
Jun
-0.12
-0.22 to -0.02
18/24
0.0131
0.0392
0.6397
-0.16
✓
Gamma Quantile Mapping
Jul
-0.03
-0.13 to +0.07
12/24
0.3015
0.3015
1.0000
-0.00
—
Gamma Quantile Mapping
Aug
-0.12
-0.16 to -0.07
22/24
0.0000
0.0000
0.0003
-0.04
✓✓
Gamma Quantile Mapping
Sep
-0.06
-0.11 to -0.02
19/24
0.0045
0.0181
0.2353
-0.09
✓
Gamma Quantile Mapping
JJAS
-0.08
-0.22 to +0.06
13/24
0.1318
0.2636
1.0000
-0.22
—
Detrended Quantile Mapping
Jun
+0.62
+0.30 to +1.03
6/24
0.9999
1.0000
1.0000
+0.89
—
Detrended Quantile Mapping
Jul
+0.44
+0.16 to +0.74
6/24
0.9975
1.0000
1.0000
+0.73
—
Detrended Quantile Mapping
Aug
+0.74
+0.43 to +1.08
4/24
1.0000
1.0000
1.0000
+0.30
—
Detrended Quantile Mapping
Sep
+0.55
+0.34 to +0.78
2/24
1.0000
1.0000
1.0000
+0.72
—
Detrended Quantile Mapping
JJAS
+1.33
+0.38 to +2.37
6/24
0.9919
1.0000
1.0000
+2.74
—
Quantile Delta Mapping
Jun
+0.81
+0.39 to +1.33
4/24
1.0000
1.0000
1.0000
+1.17
—
Quantile Delta Mapping
Jul
+0.41
+0.06 to +0.84
7/24
0.9830
1.0000
1.0000
+1.04
—
Quantile Delta Mapping
Aug
+0.86
+0.48 to +1.33
2/24
1.0000
1.0000
1.0000
+0.58
—
Quantile Delta Mapping
Sep
+0.68
+0.42 to +0.97
2/24
1.0000
1.0000
1.0000
+0.74
—
Quantile Delta Mapping
JJAS
+1.61
+0.56 to +2.88
5/24
0.9974
1.0000
1.0000
+3.63
—
Scaled Distribution Mapping
Jun
+1.17
+0.70 to +1.71
2/24
1.0000
1.0000
1.0000
+1.39
—
Scaled Distribution Mapping
Jul
+0.73
+0.35 to +1.16
5/24
0.9998
1.0000
1.0000
+1.31
—
Scaled Distribution Mapping
Aug
+1.21
+0.77 to +1.71
2/24
1.0000
1.0000
1.0000
+0.81
—
Scaled Distribution Mapping
Sep
+0.93
+0.64 to +1.27
1/24
1.0000
1.0000
1.0000
+0.92
—
Scaled Distribution Mapping
JJAS
+2.54
+1.51 to +3.76
2/24
1.0000
1.0000
1.0000
+4.28
—
CDF-transform
Jun
+0.71
+0.33 to +1.17
6/24
0.9998
1.0000
1.0000
+1.14
—
CDF-transform
Jul
+0.50
+0.19 to +0.83
7/24
0.9979
1.0000
1.0000
+0.79
—
CDF-transform
Aug
+0.78
+0.45 to +1.15
3/24
1.0000
1.0000
1.0000
+0.45
—
CDF-transform
Sep
+0.71
+0.46 to +1.01
0/24
1.0000
1.0000
1.0000
+0.84
—
CDF-transform
JJAS
+1.63
+0.63 to +2.77
4/24
0.9985
1.0000
1.0000
+2.89
—
MVS with all-zero guard (variant)
Jun
+0.00
+0.00 to +0.00
0/24
1.0000
1.0000
— (variant)
+0.00
—
MVS with all-zero guard (variant)
Jul
+0.00
+0.00 to +0.00
0/24
1.0000
1.0000
— (variant)
+0.00
—
MVS with all-zero guard (variant)
Aug
+0.00
+0.00 to +0.00
0/24
1.0000
1.0000
— (variant)
+0.00
—
MVS with all-zero guard (variant)
Sep
+0.00
+0.00 to +0.00
0/24
1.0000
1.0000
— (variant)
+0.00
—
MVS with all-zero guard (variant)
JJAS
+0.00
+0.00 to +0.00
0/24
1.0000
1.0000
— (variant)
+0.00
—
Screening statistics, RPS (no blend) (method minus Mean-Variance Scaling; negative favours the method)
Method
Target
Δ RPS (no blend) 1993–2016
95% interval
Years better
p (one-sided)
Holm p (method)
Holm p (all 60)
Δ 2017–2025
Screening
Linear Scaling
Jun
+0.0023
-0.0072 to +0.0114
10/24
0.6767
1.0000
1.0000
-0.0146
—
Linear Scaling
Jul
+0.0077
+0.0031 to +0.0122
6/24
0.9979
1.0000
1.0000
+0.0069
—
Linear Scaling
Aug
+0.0039
+0.0015 to +0.0063
7/24
0.9971
1.0000
1.0000
+0.0028
—
Linear Scaling
Sep
+0.0039
-0.0017 to +0.0098
12/24
0.8953
1.0000
1.0000
+0.0110
—
Linear Scaling
JJAS
+0.0047
+0.0013 to +0.0082
6/24
0.9938
1.0000
1.0000
+0.0031
—
Variance Scaling (unbounded)
Jun
-0.0016
-0.0046 to +0.0014
16/24
0.1649
0.3333
1.0000
-0.0032
—
Variance Scaling (unbounded)
Jul
-0.0024
-0.0059 to +0.0012
15/24
0.1111
0.3333
1.0000
-0.0016
—
Variance Scaling (unbounded)
Aug
-0.0022
-0.0048 to +0.0003
15/24
0.0572
0.2345
1.0000
-0.0023
—
Variance Scaling (unbounded)
Sep
-0.0026
-0.0056 to +0.0002
14/24
0.0469
0.2345
1.0000
-0.0026
—
Variance Scaling (unbounded)
JJAS
-0.0002
-0.0020 to +0.0016
13/24
0.4003
0.4003
1.0000
-0.0012
—
Square-root-space Mean-Variance Scaling
Jun
-0.0051
-0.0084 to -0.0021
17/24
0.0020
0.0102
0.1218
-0.0112
✓
Square-root-space Mean-Variance Scaling
Jul
-0.0013
-0.0054 to +0.0031
14/24
0.2854
0.5848
1.0000
+0.0002
—
Square-root-space Mean-Variance Scaling
Aug
-0.0021
-0.0060 to +0.0015
12/24
0.1462
0.5848
1.0000
+0.0006
—
Square-root-space Mean-Variance Scaling
Sep
-0.0024
-0.0076 to +0.0024
10/24
0.1782
0.5848
1.0000
-0.0034
—
Square-root-space Mean-Variance Scaling
JJAS
+0.0003
-0.0030 to +0.0038
12/24
0.5698
0.5848
1.0000
-0.0004
—
Power Transformation
Jun
-0.0056
-0.0094 to -0.0018
17/24
0.0043
0.0213
0.2510
-0.0110
✓
Power Transformation
Jul
-0.0012
-0.0072 to +0.0050
15/24
0.3508
0.7953
1.0000
+0.0020
—
Power Transformation
Aug
-0.0019
-0.0074 to +0.0030
10/24
0.2441
0.7953
1.0000
+0.0023
—
Power Transformation
Sep
-0.0026
-0.0087 to +0.0031
12/24
0.1988
0.7953
1.0000
-0.0057
—
Power Transformation
JJAS
+0.0004
-0.0030 to +0.0037
11/24
0.5788
0.7953
1.0000
+0.0014
—
Delta Change
Jun
+0.0192
-0.0046 to +0.0429
10/24
0.9310
1.0000
1.0000
+0.0146
—
Delta Change
Jul
+0.0060
-0.0013 to +0.0132
10/24
0.9339
1.0000
1.0000
-0.0000
—
Delta Change
Aug
+0.0140
+0.0051 to +0.0238
8/24
0.9965
1.0000
1.0000
+0.0149
—
Delta Change
Sep
+0.0160
+0.0031 to +0.0299
8/24
0.9829
1.0000
1.0000
+0.0205
—
Delta Change
JJAS
-0.0009
-0.0133 to +0.0109
11/24
0.4426
1.0000
1.0000
+0.0170
—
Local Intensity Scaling
Jun
+0.0067
-0.0008 to +0.0141
10/24
0.9506
1.0000
1.0000
-0.0112
—
Local Intensity Scaling
Jul
+0.0072
+0.0032 to +0.0115
7/24
0.9986
1.0000
1.0000
+0.0082
—
Local Intensity Scaling
Aug
+0.0035
+0.0005 to +0.0065
9/24
0.9822
1.0000
1.0000
+0.0028
—
Local Intensity Scaling
Sep
+0.0037
-0.0008 to +0.0085
10/24
0.9302
1.0000
1.0000
+0.0102
—
Local Intensity Scaling
JJAS
+0.0052
+0.0019 to +0.0087
4/24
0.9974
1.0000
1.0000
+0.0028
—
Empirical Quantile Mapping
Jun
-0.0067
-0.0136 to +0.0008
16/24
0.0481
0.2407
1.0000
-0.0160
—
Empirical Quantile Mapping
Jul
+0.0028
-0.0010 to +0.0069
13/24
0.9063
1.0000
1.0000
+0.0031
—
Empirical Quantile Mapping
Aug
+0.0004
-0.0029 to +0.0040
13/24
0.5957
1.0000
1.0000
-0.0009
—
Empirical Quantile Mapping
Sep
-0.0032
-0.0071 to +0.0005
16/24
0.0582
0.2407
1.0000
-0.0010
—
Empirical Quantile Mapping
JJAS
+0.0034
-0.0019 to +0.0086
10/24
0.8873
1.0000
1.0000
+0.0048
—
Gamma Quantile Mapping
Jun
-0.0019
-0.0073 to +0.0035
13/24
0.2512
1.0000
1.0000
-0.0065
—
Gamma Quantile Mapping
Jul
-0.0007
-0.0065 to +0.0052
15/24
0.4031
1.0000
1.0000
+0.0025
—
Gamma Quantile Mapping
Aug
-0.0026
-0.0088 to +0.0033
11/24
0.2103
1.0000
1.0000
+0.0012
—
Gamma Quantile Mapping
Sep
-0.0031
-0.0119 to +0.0050
10/24
0.2454
1.0000
1.0000
-0.0049
—
Gamma Quantile Mapping
JJAS
+0.0010
-0.0037 to +0.0059
11/24
0.6492
1.0000
1.0000
-0.0003
—
Detrended Quantile Mapping
Jun
+0.0328
+0.0148 to +0.0525
6/24
0.9992
1.0000
1.0000
+0.0231
—
Detrended Quantile Mapping
Jul
+0.0189
+0.0095 to +0.0297
7/24
0.9998
1.0000
1.0000
+0.0175
—
Detrended Quantile Mapping
Aug
+0.0248
+0.0140 to +0.0358
5/24
0.9999
1.0000
1.0000
+0.0226
—
Detrended Quantile Mapping
Sep
+0.0262
+0.0141 to +0.0400
7/24
0.9998
1.0000
1.0000
+0.0265
—
Detrended Quantile Mapping
JJAS
+0.0124
+0.0030 to +0.0217
7/24
0.9910
1.0000
1.0000
+0.0263
—
Quantile Delta Mapping
Jun
+0.0288
+0.0174 to +0.0411
5/24
1.0000
1.0000
1.0000
+0.0122
—
Quantile Delta Mapping
Jul
+0.0207
+0.0095 to +0.0336
6/24
0.9994
1.0000
1.0000
+0.0235
—
Quantile Delta Mapping
Aug
+0.0266
+0.0161 to +0.0383
4/24
1.0000
1.0000
1.0000
+0.0277
—
Quantile Delta Mapping
Sep
+0.0270
+0.0118 to +0.0429
5/24
0.9986
1.0000
1.0000
+0.0260
—
Quantile Delta Mapping
JJAS
+0.0207
+0.0101 to +0.0311
6/24
0.9996
1.0000
1.0000
+0.0298
—
Scaled Distribution Mapping
Jun
+0.0456
+0.0278 to +0.0651
4/24
1.0000
1.0000
1.0000
+0.0179
—
Scaled Distribution Mapping
Jul
+0.0282
+0.0170 to +0.0406
3/24
1.0000
1.0000
1.0000
+0.0301
—
Scaled Distribution Mapping
Aug
+0.0374
+0.0246 to +0.0514
3/24
1.0000
1.0000
1.0000
+0.0328
—
Scaled Distribution Mapping
Sep
+0.0361
+0.0207 to +0.0533
3/24
1.0000
1.0000
1.0000
+0.0357
—
Scaled Distribution Mapping
JJAS
+0.0290
+0.0171 to +0.0407
3/24
0.9999
1.0000
1.0000
+0.0377
—
CDF-transform
Jun
+0.0366
+0.0222 to +0.0523
4/24
1.0000
1.0000
1.0000
+0.0337
—
CDF-transform
Jul
+0.0218
+0.0112 to +0.0339
4/24
0.9998
1.0000
1.0000
+0.0180
—
CDF-transform
Aug
+0.0279
+0.0172 to +0.0389
4/24
1.0000
1.0000
1.0000
+0.0263
—
CDF-transform
Sep
+0.0346
+0.0190 to +0.0517
5/24
0.9998
1.0000
1.0000
+0.0275
—
CDF-transform
JJAS
+0.0200
+0.0105 to +0.0295
5/24
0.9997
1.0000
1.0000
+0.0283
—
MVS with all-zero guard (variant)
Jun
+0.0000
+0.0000 to +0.0000
0/24
1.0000
1.0000
— (variant)
+0.0000
—
MVS with all-zero guard (variant)
Jul
+0.0000
+0.0000 to +0.0000
0/24
1.0000
1.0000
— (variant)
+0.0000
—
MVS with all-zero guard (variant)
Aug
+0.0000
+0.0000 to +0.0000
0/24
1.0000
1.0000
— (variant)
+0.0000
—
MVS with all-zero guard (variant)
Sep
+0.0000
+0.0000 to +0.0000
0/24
1.0000
1.0000
— (variant)
+0.0000
—
MVS with all-zero guard (variant)
JJAS
+0.0000
+0.0000 to +0.0000
0/24
1.0000
1.0000
— (variant)
+0.0000
—
How often limits, caps and fallbacks act
How often limits, caps and fallbacks act, leave-one-year-out 1993–2016 (mean over folds)
Method
Target
Activated (share of the corrected area, or of members / cells for events)
Mean-Variance Scaling (operational)
Jun
ratio lower limit: 7.0% of the area; ratio upper limit: 7.9% of the area; clipped at zero: 1.9%
Mean-Variance Scaling (operational)
Jul
ratio lower limit: 31.8% of the area; ratio upper limit: 4.5% of the area; clipped at zero: 9.8%
Mean-Variance Scaling (operational)
Aug
ratio lower limit: 27.9% of the area; ratio upper limit: 1.5% of the area; clipped at zero: 6.0%
Mean-Variance Scaling (operational)
Sep
ratio lower limit: 14.4% of the area; ratio upper limit: 0.8% of the area; clipped at zero: 1.3%
Mean-Variance Scaling (operational)
JJAS
ratio lower limit: 14.0% of the area; ratio upper limit: 0.8% of the area; clipped at zero: 0.3%
Variance Scaling (unbounded)
Jun
clipped at zero: 1.4%
Variance Scaling (unbounded)
Jul
clipped at zero: 1.2%
Variance Scaling (unbounded)
Aug
clipped at zero: 0.2%
Variance Scaling (unbounded)
Sep
clipped at zero: 0.6%
Variance Scaling (unbounded)
JJAS
clipped at zero: 0.2%
Square-root-space Mean-Variance Scaling
Jun
ratio lower limit: 2.3% of the area; ratio upper limit: 0.4% of the area; clipped at zero: 0.1%
Square-root-space Mean-Variance Scaling
Jul
ratio lower limit: 27.0% of the area; ratio upper limit: 5.2% of the area; clipped at zero: 2.0%
Square-root-space Mean-Variance Scaling
Aug
ratio lower limit: 24.3% of the area; ratio upper limit: 0.9% of the area; clipped at zero: 0.4%
Square-root-space Mean-Variance Scaling
Sep
ratio lower limit: 9.5% of the area; clipped at zero: 0.0%
Square-root-space Mean-Variance Scaling
JJAS
ratio lower limit: 8.7% of the area; ratio upper limit: 0.3% of the area; clipped at zero: 0.0%
Power Transformation
Jun
b at bound: 0.2% of the area
Power Transformation
Jul
b at bound: 0.9% of the area
Power Transformation
Aug
b at bound: 2.8% of the area
Delta Change
Jun
ratio capped: 0.1%
Delta Change
Jul
ratio capped: 0.0%
Delta Change
Aug
ratio capped: 0.0%
Delta Change
Sep
ratio capped: 0.0%
Delta Change
JJAS
ratio capped: 0.0%
Local Intensity Scaling
Jun
always wet: 93.6% of the area
Local Intensity Scaling
Jul
always wet: 87.5% of the area; never wet: 3.7% of the area
Local Intensity Scaling
Aug
always wet: 94.7% of the area; never wet: 2.2% of the area
Local Intensity Scaling
Sep
always wet: 96.7% of the area
Local Intensity Scaling
JJAS
always wet: 100.0% of the area
Empirical Quantile Mapping
Jun
model has dry: 41.8% of the area; obs has dry: 6.4% of the area; extrapolated: 0.3%
Empirical Quantile Mapping
Jul
model has dry: 23.2% of the area; obs has dry: 12.5% of the area; extrapolated: 0.3%
Empirical Quantile Mapping
Aug
model has dry: 23.1% of the area; obs has dry: 5.3% of the area; extrapolated: 0.3%
Empirical Quantile Mapping
Sep
model has dry: 25.4% of the area; obs has dry: 3.3% of the area; extrapolated: 0.3%
Empirical Quantile Mapping
JJAS
extrapolated: 0.4%
Gamma Quantile Mapping
Jun
model has dry: 41.8% of the area; obs has dry: 6.4% of the area
Gamma Quantile Mapping
Jul
gamma fallback: 3.4% of the area; model has dry: 23.2% of the area; obs has dry: 12.5% of the area
Gamma Quantile Mapping
Aug
gamma fallback: 1.7% of the area; model has dry: 23.1% of the area; obs has dry: 5.3% of the area
Gamma Quantile Mapping
Sep
model has dry: 25.4% of the area; obs has dry: 3.3% of the area
Detrended Quantile Mapping
Jun
model has dry: 41.8% of the area; obs has dry: 6.4% of the area; ratio capped: 0.1%; extrapolated: 0.1%
Detrended Quantile Mapping
Jul
model has dry: 23.2% of the area; obs has dry: 12.5% of the area; ratio capped: 0.0%; extrapolated: 0.2%
Detrended Quantile Mapping
Aug
model has dry: 23.1% of the area; obs has dry: 5.3% of the area; ratio capped: 0.0%; extrapolated: 0.2%
Detrended Quantile Mapping
Sep
model has dry: 25.4% of the area; obs has dry: 3.3% of the area; ratio capped: 0.0%; extrapolated: 0.2%
Detrended Quantile Mapping
JJAS
ratio capped: 0.0%; extrapolated: 0.2%
Quantile Delta Mapping
Jun
model has dry: 41.8% of the area; obs has dry: 6.4% of the area; low denominator: 4.3%; ratio capped: 0.1%
Quantile Delta Mapping
Jul
model has dry: 23.2% of the area; obs has dry: 12.5% of the area; low denominator: 1.0%; ratio capped: 0.1%
Quantile Delta Mapping
Aug
model has dry: 23.1% of the area; obs has dry: 5.3% of the area; low denominator: 1.7%; ratio capped: 0.0%
Quantile Delta Mapping
Sep
model has dry: 25.4% of the area; obs has dry: 3.3% of the area; low denominator: 0.5%; ratio capped: 0.0%
Quantile Delta Mapping
JJAS
ratio capped: 0.0%
Scaled Distribution Mapping
Jul
gamma fallback: 7.1% of the area; linear scaling fallback: 7.1%
Scaled Distribution Mapping
Aug
gamma fallback: 4.0% of the area; linear scaling fallback: 3.9%
CDF-transform
Jun
at forecast range edge: 4.1%
CDF-transform
Jul
at forecast range edge: 7.7%
CDF-transform
Aug
at forecast range edge: 5.2%
CDF-transform
Sep
at forecast range edge: 4.7%
CDF-transform
JJAS
at forecast range edge: 6.0%
MVS with all-zero guard (variant)
Jun
ratio lower limit: 7.0% of the area; ratio upper limit: 7.9% of the area; clipped at zero: 1.9%
MVS with all-zero guard (variant)
Jul
ratio lower limit: 31.8% of the area; ratio upper limit: 4.5% of the area; clipped at zero: 9.8%
MVS with all-zero guard (variant)
Aug
ratio lower limit: 27.9% of the area; ratio upper limit: 1.5% of the area; clipped at zero: 6.0%
MVS with all-zero guard (variant)
Sep
ratio lower limit: 14.4% of the area; ratio upper limit: 0.8% of the area; clipped at zero: 1.3%
MVS with all-zero guard (variant)
JJAS
ratio lower limit: 14.0% of the area; ratio upper limit: 0.8% of the area; clipped at zero: 0.3%
Where the amount differences come from: cells grouped by their training-year climate
Each cell is grouped by its CHIRPS totals in the fold’s training years only: every year exactly 0 mm; every year ≤ 1 mm (not all 0); some years dry and some wet; never dry. Contributions are area-weighted CRPS differences from Mean-Variance Scaling (mm; negative favours the method) and add up to the national difference. Leave-one-year-out 1993–2016, All Ethiopia.
Jun: contributions to the CRPS difference from Mean-Variance Scaling (mm)
Method
Total Δ CRPS
all 0 mm 0.0% of area
all ≤ 1 mm 0.0% of area
mixed 6.4% of area
always wet 93.6% of area
Linear Scaling
+0.423
+0.000
+0.000
-0.003
+0.427
Variance Scaling (unbounded)
-0.038
+0.000
+0.000
-0.000
-0.038
Square-root-space Mean-Variance Scaling
-0.127
+0.000
+0.000
-0.002
-0.125
Power Transformation
-0.068
+0.000
+0.000
-0.005
-0.063
Delta Change
+0.151
+0.000
+0.000
-0.011
+0.162
Local Intensity Scaling
+0.369
+0.000
+0.000
+0.003
+0.366
Empirical Quantile Mapping
+0.081
+0.000
+0.000
-0.001
+0.082
Gamma Quantile Mapping
-0.131
+0.000
+0.000
-0.001
-0.130
Detrended Quantile Mapping
+0.632
+0.000
+0.000
+0.005
+0.627
Quantile Delta Mapping
+0.815
+0.000
+0.000
+0.004
+0.811
Scaled Distribution Mapping
+1.105
+0.000
+0.000
+0.001
+1.104
CDF-transform
+0.703
+0.000
+0.000
+0.003
+0.701
MVS with all-zero guard (variant)
+0.000
+0.000
+0.000
+0.000
+0.000
Jul: contributions to the CRPS difference from Mean-Variance Scaling (mm)
Method
Total Δ CRPS
all 0 mm 0.0% of area
all ≤ 1 mm 3.7% of area
mixed 8.8% of area
always wet 87.5% of area
Linear Scaling
+0.497
+0.000
-0.013
-0.037
+0.546
Variance Scaling (unbounded)
-0.139
+0.000
-0.014
-0.042
-0.083
Square-root-space Mean-Variance Scaling
-0.075
+0.000
-0.010
-0.030
-0.036
Power Transformation
-0.125
+0.000
-0.014
-0.042
-0.069
Delta Change
-0.159
+0.000
-0.013
-0.043
-0.104
Local Intensity Scaling
+0.482
+0.000
-0.009
-0.014
+0.506
Empirical Quantile Mapping
+0.228
+0.000
-0.009
-0.020
+0.257
Gamma Quantile Mapping
-0.008
+0.000
-0.009
-0.032
+0.033
Detrended Quantile Mapping
+0.425
+0.000
-0.009
-0.019
+0.453
Quantile Delta Mapping
+0.417
+0.000
-0.009
-0.019
+0.445
Scaled Distribution Mapping
+0.673
+0.000
-0.013
-0.028
+0.714
CDF-transform
+0.424
+0.000
-0.013
-0.035
+0.472
MVS with all-zero guard (variant)
+0.000
+0.000
+0.000
+0.000
+0.000
Aug: contributions to the CRPS difference from Mean-Variance Scaling (mm)
Method
Total Δ CRPS
all 0 mm 0.0% of area
all ≤ 1 mm 2.2% of area
mixed 3.1% of area
always wet 94.7% of area
Linear Scaling
+0.713
+0.000
-0.006
-0.014
+0.733
Variance Scaling (unbounded)
-0.129
+0.000
-0.008
-0.018
-0.103
Square-root-space Mean-Variance Scaling
-0.096
+0.000
-0.004
-0.012
-0.079
Power Transformation
-0.124
+0.000
-0.008
-0.017
-0.099
Delta Change
+0.305
+0.000
-0.006
-0.015
+0.327
Local Intensity Scaling
+0.665
+0.000
+0.000
-0.006
+0.672
Empirical Quantile Mapping
+0.151
+0.000
+0.000
-0.006
+0.157
Gamma Quantile Mapping
-0.128
+0.000
+0.000
-0.012
-0.116
Detrended Quantile Mapping
+0.722
+0.000
+0.000
-0.005
+0.727
Quantile Delta Mapping
+0.858
+0.000
+0.000
-0.005
+0.864
Scaled Distribution Mapping
+1.128
+0.000
-0.006
-0.011
+1.146
CDF-transform
+0.735
+0.000
-0.006
-0.013
+0.754
MVS with all-zero guard (variant)
+0.000
+0.000
+0.000
+0.000
+0.000
Sep: contributions to the CRPS difference from Mean-Variance Scaling (mm)
Method
Total Δ CRPS
all 0 mm 0.0% of area
all ≤ 1 mm 0.0% of area
mixed 3.3% of area
always wet 96.7% of area
Linear Scaling
+0.546
+0.000
+0.000
-0.002
+0.548
Variance Scaling (unbounded)
-0.032
+0.000
+0.000
-0.007
-0.025
Square-root-space Mean-Variance Scaling
-0.058
+0.000
+0.000
+0.000
-0.058
Power Transformation
-0.011
+0.000
+0.000
-0.009
-0.002
Delta Change
+0.115
+0.000
+0.000
-0.004
+0.120
Local Intensity Scaling
+0.495
+0.000
+0.000
+0.012
+0.483
Empirical Quantile Mapping
+0.118
+0.000
+0.000
-0.008
+0.125
Gamma Quantile Mapping
-0.072
+0.000
+0.000
-0.005
-0.067
Detrended Quantile Mapping
+0.540
+0.000
+0.000
-0.000
+0.541
Quantile Delta Mapping
+0.682
+0.000
+0.000
-0.000
+0.682
Scaled Distribution Mapping
+0.857
+0.000
+0.000
+0.002
+0.856
CDF-transform
+0.694
+0.000
+0.000
-0.002
+0.696
MVS with all-zero guard (variant)
+0.000
+0.000
+0.000
+0.000
+0.000
JJAS: contributions to the CRPS difference from Mean-Variance Scaling (mm)
Method
Total Δ CRPS
all 0 mm 0.0% of area
all ≤ 1 mm 0.0% of area
mixed 0.0% of area
always wet 100.0% of area
Linear Scaling
+1.482
+0.000
+0.000
+0.000
+1.482
Variance Scaling (unbounded)
-0.040
+0.000
+0.000
+0.000
-0.040
Square-root-space Mean-Variance Scaling
-0.111
+0.000
+0.000
+0.000
-0.111
Power Transformation
-0.024
+0.000
+0.000
+0.000
-0.024
Delta Change
+0.108
+0.000
+0.000
+0.000
+0.108
Local Intensity Scaling
+1.452
+0.000
+0.000
+0.000
+1.452
Empirical Quantile Mapping
+0.588
+0.000
+0.000
+0.000
+0.588
Gamma Quantile Mapping
-0.117
+0.000
+0.000
+0.000
-0.117
Detrended Quantile Mapping
+1.334
+0.000
+0.000
+0.000
+1.334
Quantile Delta Mapping
+1.620
+0.000
+0.000
+0.000
+1.620
Scaled Distribution Mapping
+2.389
+0.000
+0.000
+0.000
+2.389
CDF-transform
+1.555
+0.000
+0.000
+0.000
+1.555
MVS with all-zero guard (variant)
+0.000
+0.000
+0.000
+0.000
+0.000
Confirmation: full pipeline and method selection
The screening isolates the amount correction. The confirmation evaluates what the site publishes: each method’s
corrected members go through the full probability pipeline (tercile counts, smoothing and the climatology blend), with every fit and
the blend weight inside the cross-validation folds. Two selection-aware procedures then choose a method for each
left-out year using only the other training years — SEL-P by the lowest inner blended RPS (probabilities),
SEL-A by the lowest inner CRPS (amounts) — so their scores include the effect of choosing among the
14 declared methods. ✓ = better than Mean-Variance Scaling with Holm-adjusted p < 0.05 (methods: across all
methods and targets; SEL-P/SEL-A: across the targets) and not worse over 2017–2025. Scope: All Ethiopia.
JJAS season through the full pipeline (outer leave-one-year-out 1993–2016; test years exploratory)
Method
Blended RPSS 1993–2016
Blended RPSS 2017–2025
BSS below 1993–2016
BSS above 1993–2016
Amount CRPSS 1993–2016
Amount CRPSS 2017–2025
Mean blend weight λ
Mean-Variance Scaling (operational)
+0.027
+0.039
+0.034
+0.019
-0.028
-0.018
0.59
Linear Scaling
+0.025
+0.039
+0.033
+0.018
-0.059
-0.082
0.60
Variance Scaling (unbounded)
+0.027
+0.041
+0.035
+0.019
-0.027
-0.016
0.58
Square-root-space Mean-Variance Scaling
+0.027
+0.041
+0.035
+0.019
-0.025
-0.014
0.58
Power Transformation
+0.027
+0.040
+0.034
+0.019
-0.027
-0.016
0.58
Delta Change
+0.029
+0.031
+0.036
+0.023
-0.030
-0.058
0.61
Local Intensity Scaling
+0.025
+0.040
+0.033
+0.018
-0.059
-0.081
0.61
Empirical Quantile Mapping
+0.019
+0.030
+0.026
+0.013
-0.040
-0.032
0.62
Gamma Quantile Mapping
+0.026
+0.041
+0.035
+0.018
-0.025
-0.012
0.58
Detrended Quantile Mapping
+0.026
+0.032
+0.032
+0.019
-0.056
-0.078
0.66
Quantile Delta Mapping
+0.023
+0.032
+0.026
+0.020
-0.062
-0.097
0.68
Scaled Distribution Mapping
+0.023
+0.030
+0.026
+0.021
-0.078
-0.110
0.70
CDF-transform
+0.022
+0.032
+0.027
+0.018
-0.061
-0.081
0.68
MVS with all-zero guard (variant)
+0.027
+0.039
+0.034
+0.019
-0.028
-0.018
0.59
SEL-P
+0.025
+0.031
+0.031
+0.019
-0.029
-0.058
—
SEL-A
+0.023
+0.041
+0.030
+0.016
-0.036
-0.012
—
Blended tercile RPSS by target, outer leave-one-year-out 1993–2016
Method
Jun
Jul
Aug
Sep
JJAS
Mean-Variance Scaling (operational)
-0.000
+0.014
+0.012
+0.003
+0.027
Linear Scaling
-0.001
+0.013
+0.012
+0.003
+0.025
Variance Scaling (unbounded)
-0.001
+0.015
+0.012
+0.004
+0.027
Square-root-space Mean-Variance Scaling
-0.002
+0.014
+0.012
+0.003
+0.027
Power Transformation
-0.002
+0.014
+0.012
+0.003
+0.027
Delta Change
-0.004
+0.010
+0.008
+0.001
+0.029
Local Intensity Scaling
-0.001
+0.013
+0.012
+0.003
+0.025
Empirical Quantile Mapping
-0.007
+0.007
+0.006
-0.000
+0.019
Gamma Quantile Mapping
-0.002
+0.014
+0.012
+0.003
+0.026
Detrended Quantile Mapping
-0.003
+0.009
+0.007
+0.001
+0.026
Quantile Delta Mapping
-0.004
+0.011
+0.007
+0.002
+0.023
Scaled Distribution Mapping
-0.002
+0.011
+0.007
+0.003
+0.023
CDF-transform
-0.003
+0.008
+0.008
+0.001
+0.022
MVS with all-zero guard (variant)
-0.000
+0.014
+0.012
+0.003
+0.027
SEL-P
-0.008
+0.015
+0.012
+0.003
+0.025
SEL-A
-0.002
+0.010
+0.012
+0.003
+0.023
Amount CRPSS by target in the confirmation design, and the selection-aware procedures
Amount CRPSS by target, outer leave-one-year-out 1993–2016
Method
Jun
Jul
Aug
Sep
JJAS
Mean-Variance Scaling (operational)
-0.096
-0.007
-0.028
-0.060
-0.028
Linear Scaling
-0.121
-0.029
-0.064
-0.090
-0.059
Variance Scaling (unbounded)
-0.093
-0.000 ✓
-0.021 ✓
-0.058
-0.027
Square-root-space Mean-Variance Scaling
-0.088
-0.003
-0.023 ✓
-0.057
-0.025
Power Transformation
-0.091
-0.001
-0.022 ✓
-0.060
-0.027
Delta Change
-0.105
+0.001
-0.043
-0.067
-0.030
Local Intensity Scaling
-0.118
-0.028
-0.061
-0.087
-0.059
Empirical Quantile Mapping
-0.100
-0.017
-0.035
-0.067
-0.040
Gamma Quantile Mapping
-0.088
-0.006
-0.021 ✓
-0.056
-0.025
Detrended Quantile Mapping
-0.134
-0.026
-0.064
-0.090
-0.056
Quantile Delta Mapping
-0.145
-0.025
-0.071
-0.098
-0.062
Scaled Distribution Mapping
-0.162
-0.037
-0.084
-0.107
-0.078
CDF-transform
-0.138
-0.026
-0.065
-0.098
-0.061
MVS with all-zero guard (variant)
-0.096
-0.007
-0.028
-0.060
-0.028
SEL-P
-0.102
-0.001
-0.023
-0.084
-0.029
SEL-A
-0.088 ✓
-0.007
-0.022 ✓
-0.056 ✓
-0.036
Selection-aware procedures against the operational method (Δ: RPS for SEL-P, CRPS for SEL-A; negative favours the procedure)
Procedure
Target
Methods chosen (1993–2016, years)
Chosen for 2017–2025
Δ score vs MVS
Holm p (targets)
Δ 2017–2025
Confirmed
SEL-P
Jun
Power Transformation 13, Linear Scaling 5, Delta Change 4, Square-root-space Mean-Variance Scaling 2
The operational correction limits the spread ratio r = σobs/σmodel to 0.5–2. This study runs the same
screening and confirmation for that correction with wider limits (1/3–3, 1/4–4) and none, all with the same fallback (r = 1 where
the model spread is below 1 mm), to see whether the limits are worth changing. ✓ = better than the operational limits with
Holm-adjusted p < 0.05 across the 3 alternatives × 5 targets and not worse over the test years.
Run at commit fb7425f.
Confirmed better than the operational limits — published (blended) probabilities: none;
rainfall amounts: MVS, ratio limits 1/3-3 (Jul, Aug, Sep), MVS, ratio limits 1/4-4 (Jul, Aug, Sep) and Variance Scaling (unbounded) (Jul, Aug, Sep).
Blended tercile RPSS through the full pipeline, outer leave-one-year-out 1993–2016
Method
Jun
Jul
Aug
Sep
JJAS
Mean-Variance Scaling (operational, 0.5–2)
-0.000
+0.014
+0.012
+0.003
+0.027
MVS, ratio limits 1/3-3
-0.000
+0.015
+0.012
+0.003
+0.027
MVS, ratio limits 1/4-4
-0.001
+0.015
+0.012
+0.003
+0.027
Variance Scaling (unbounded)
-0.001
+0.015
+0.012
+0.004
+0.027
Amount CRPSS, leave-one-year-out 1993–2016
Method
Jun
Jul
Aug
Sep
JJAS
Mean-Variance Scaling (operational, 0.5–2)
-0.096
-0.007
-0.028
-0.060
-0.028
MVS, ratio limits 1/3-3
-0.094
-0.004 ✓
-0.025 ✓
-0.059 ✓
-0.027
MVS, ratio limits 1/4-4
-0.093
-0.003 ✓
-0.024 ✓
-0.059 ✓
-0.027
Variance Scaling (unbounded)
-0.093
-0.000 ✓
-0.021 ✓
-0.058 ✓
-0.027
Where the operational limits act
Share of the corrected area, mean over the leave-one-year-out folds, 1993–2016
Target
Lower limit active (r would be < 0.5)
Upper limit active (r would be > 2)
Spread–error, operational
Spread–error, no limits
Jun
7%
8%
0.82
0.82
Jul
32%
5%
0.92
0.93
Aug
28%
2%
0.93
0.93
Sep
14%
1%
0.89
0.89
JJAS
14%
1%
0.83
0.83
Independent validation seasons: every method scored on the seasons after the benchmark (one season each; the suggestions need at least three)
2026: blended tercile RPSS against CHIRPS
Method
Jun
Jul
Aug
Sep
JJAS
Mean-Variance Scaling (operational)
+0.125
+0.198
+0.277
+0.107
+0.352
CDF-transform
+0.116
+0.150
+0.219
+0.108
+0.298
Delta Change
+0.123
+0.172
+0.235
+0.122
+0.362
Detrended Quantile Mapping
+0.108
+0.152
+0.214
+0.103
+0.324
Empirical Quantile Mapping
+0.127
+0.202
+0.292
+0.091
+0.336
Gamma Quantile Mapping
+0.133
+0.213
+0.282
+0.128
+0.362
Local Intensity Scaling
+0.119
+0.176
+0.257
+0.107
+0.333
Linear Scaling
+0.128
+0.175
+0.260
+0.107
+0.333
MVS with all-zero guard (variant)
+0.125
+0.198
+0.277
+0.107
+0.352
Power Transformation
+0.144
+0.216
+0.290
+0.127
+0.361
Quantile Delta Mapping
+0.110
+0.153
+0.215
+0.101
+0.281
Scaled Distribution Mapping
+0.095
+0.148
+0.212
+0.108
+0.280
Square-root-space Mean-Variance Scaling
+0.148
+0.215
+0.295
+0.126
+0.362
Variance Scaling (unbounded)
+0.124
+0.212
+0.295
+0.119
+0.364
2026: amount CRPSS against CHIRPS
Method
Jun
Jul
Aug
Sep
JJAS
Mean-Variance Scaling (operational)
+0.404
+0.227
+0.430
+0.182
+0.532
CDF-transform
+0.314
+0.157
+0.433
+0.143
+0.469
Delta Change
+0.313
+0.164
+0.451
+0.194
+0.471
Detrended Quantile Mapping
+0.321
+0.173
+0.438
+0.167
+0.473
Empirical Quantile Mapping
+0.392
+0.224
+0.443
+0.187
+0.502
Gamma Quantile Mapping
+0.391
+0.258
+0.455
+0.189
+0.534
Local Intensity Scaling
+0.286
+0.118
+0.419
+0.174
+0.441
Linear Scaling
+0.283
+0.116
+0.416
+0.169
+0.441
MVS with all-zero guard (variant)
+0.404
+0.227
+0.430
+0.182
+0.532
Power Transformation
+0.400
+0.243
+0.454
+0.187
+0.536
Quantile Delta Mapping
+0.320
+0.168
+0.434
+0.156
+0.468
Scaled Distribution Mapping
+0.306
+0.172
+0.443
+0.166
+0.469
Square-root-space Mean-Variance Scaling
+0.396
+0.247
+0.451
+0.193
+0.535
Variance Scaling (unbounded)
+0.400
+0.240
+0.437
+0.180
+0.532
Figures
Figures show the national aggregate (All Ethiopia) or per-cell maps of the whole country, whatever region is selected for the tables.
Interpretation — national aggregate (All Ethiopia)
All tested corrections improve national JJAS rainfall-amount CRPSS over raw ECMWF in 1993–2016 (raw -1.311; corrected -0.078 to -0.025). Performance varies for monthly tercile probabilities: 0 method–month combinations score below the raw model on RPSS.
Accounting for the whole search. With Holm adjustment across all 60 method–target comparisons, the amount (CRPS) screening passes are Variance Scaling (unbounded) (Jul, Aug), Square-root-space Mean-Variance Scaling (Aug), Power Transformation (Aug) and Gamma Quantile Mapping (Aug), and the tercile (RPS) passes are none. Within-method passes that do not survive this check: Gamma Quantile Mapping Jun, Gamma Quantile Mapping Sep, Power Transformation Jul, Power Transformation Jun, Square-root-space Mean-Variance Scaling JJAS, Square-root-space Mean-Variance Scaling Jul, Square-root-space Mean-Variance Scaling Jun, Square-root-space Mean-Variance Scaling Sep and Variance Scaling (unbounded) Sep.
Variance Scaling (unbounded) is at least as good as Mean-Variance Scaling in the national aggregate for every tested target and period, on amounts and unblended terciles (JJAS CRPSS -0.027 vs -0.028 in 1993–2016, -0.016 vs -0.018 in 2017–2025). Its JJAS amount screening pass does not survive the family-wide correction. Members clipped to 0 mm in the months: 1.3%–9.9% with Mean-Variance Scaling, 0.2%–1.4% with this method. This need not hold in each region; see the tables for the JJAS R1+R2 rainfall domain.
Empirical Quantile Mapping reproduces the CHIRPS distribution and, with the dry policy, its dry share (totals ≤ 1 mm: —); it passes the screening for none, but its JJAS amount skill is lower than Mean-Variance Scaling (-0.040 vs -0.028). A possible explanation is sampling noise in an empirical quantile function built from 23 CHIRPS values per fold; the results do not isolate it.
The methods that use the forecast’s own distribution (Detrended Quantile Mapping, Quantile Delta Mapping, Scaled Distribution Mapping, CDF-transform) score lower on JJAS terciles (-0.080 to -0.044 vs -0.017) and none passes the season screening. A possible explanation is that the distribution of a single forecast’s 25–51 members is a noisy estimate of the “future” distribution these methods were designed for; the results do not isolate the cause.
Jun and Sep remain hard: every method has negative amount skill over 2017–2025.
No tested method demonstrates a statistically significant improvement over Mean-Variance Scaling for the published tercile probabilities under this validation protocol, although several have slightly higher point estimates. Choosing the method each year from training-only scores, the probability procedure (SEL-P) scores JJAS blended RPSS +0.025 against +0.027, confirmed for none. Amounts: the amount procedure (SEL-A) scores CRPSS -0.036 against -0.028, confirmed for Jun, Aug and Sep; fixed methods confirmed against the family of all declared methods and targets: Variance Scaling (unbounded) (Jul, Aug), Square-root-space Mean-Variance Scaling (Aug), Power Transformation (Aug) and Gamma Quantile Mapping (Aug).
The climatology blend narrows the differences. Across the methods, JJAS RPSS (1993–2016) spans 0.010 after the blend against 0.066 for the unblended screening counts. A better amount correction is trusted more by the blend: in Jun the fitted weight on climatology is 0.75 with Square-root-space Mean-Variance Scaling against 0.80 with Mean-Variance Scaling.
Choosing by training scores can backfire. For Jul, SEL-A chose Delta Change from the 1993–2016 scores; over 2017–2025 it has a worse mean CRPS (Δ +0.194 mm, 95% interval -0.094 to +0.517 mm; better than Mean-Variance Scaling in 3 of 9 years, with the largest losses in 2020 and 2024); for Sep, SEL-P chose Scaled Distribution Mapping from the 1993–2016 scores; over 2017–2025 it has a worse mean RPS (Δ +0.001, 95% interval -0.001 to +0.003; better than Mean-Variance Scaling in 5 of 9 years, with the largest losses in 2018 and 2024); for JJAS, SEL-P chose Delta Change from the 1993–2016 scores; over 2017–2025 it has a worse mean RPS (Δ +0.004, 95% interval -0.000 to +0.009; better than Mean-Variance Scaling in 2 of 9 years, with the largest losses in 2018 and 2023). These choices fail the no-harm rule; where the interval includes 0 they do not establish a significant deterioration. A method that ranks first on the training years is not, on that alone, a replacement.
Where the confirmed amount gains come from (climate groups from each fold’s training years; contributions add up to the national difference from Mean-Variance Scaling): Variance Scaling (unbounded) in Jul (Δ CRPS -0.139 mm): all ≤ 1 mm -0.014 mm (10%; 4% of the area), mixed -0.042 mm (30%; 9% of the area), always wet -0.083 mm (60%; 88% of the area); Variance Scaling (unbounded) in Aug (Δ CRPS -0.129 mm): all ≤ 1 mm -0.008 mm (6%; 2% of the area), mixed -0.018 mm (14%; 3% of the area), always wet -0.103 mm (80%; 95% of the area); Square-root-space Mean-Variance Scaling in Aug (Δ CRPS -0.096 mm): all ≤ 1 mm -0.004 mm (5%; 2% of the area), mixed -0.012 mm (13%; 3% of the area), always wet -0.079 mm (83%; 95% of the area); Power Transformation in Aug (Δ CRPS -0.124 mm): all ≤ 1 mm -0.008 mm (6%; 2% of the area), mixed -0.017 mm (14%; 3% of the area), always wet -0.099 mm (80%; 95% of the area); Gamma Quantile Mapping in Aug (Δ CRPS -0.128 mm): all ≤ 1 mm +0.000 mm (-0%; 2% of the area), mixed -0.012 mm (9%; 3% of the area), always wet -0.116 mm (91%; 95% of the area).
No cell of All Ethiopia has exactly 0 mm in every training year, for any target, at 0.25° with CHIRPS. The all-zero guard (a separate MVS variant, outside the declared family) therefore never acts and equals Mean-Variance Scaling: the non-zero totals that Mean-Variance Scaling gives where every training year is 0 mm (its spread ratio cannot fall below 0.5) do not arise in these data. The guard remains a documented option; a finite history of zero rainfall does not make rain impossible.
4 of the 15 interpretation statements do not hold for this cycle’s results and are not shown (each is checked against the numbers before it is displayed).
Caveats
Screening skill is from 1993–2016 leave-one-year-out (clean) and 2017–2025 (exploratory: these years were seen while the operational method was chosen).
Screening tercile scores use smoothed member counts without the climatology blend; the confirmation scores the blended product.
Two multiplicity families are shown: within one method across its targets (✓) and across all methods and targets (✓✓). The confirmation’s selection-aware procedures include the method choice in the evaluation itself.
Scores are area-weighted over many correlated cells but tested year by year, so each year counts once.
The ordinary CRPS scores the delivered ensemble; the fair CRPS is a diagnostic under a sampling interpretation that DC’s rescaled years and methods tied to the forecast mean or ranks only approximate.
Results are national aggregates unless a table says otherwise; a method can rank differently in a region (switch the tables to the regional view).
Boé, J., Terray, L., Habets, F., & Martin, E. (2007). Statistical and dynamical downscaling of the Seine basin climate for hydro-meteorological studies. International Journal of Climatology, 27, 1643–1655. doi:10.1002/joc.1602
Cannon, A. J., Sobie, S. R., & Murdock, T. Q. (2015). Bias correction of GCM precipitation by quantile mapping: how well do methods preserve changes in quantiles and extremes? Journal of Climate, 28, 6938–6959. doi:10.1175/JCLI-D-14-00754.1
Delle Monache, L., Hacker, J. P., Zhou, Y., Deng, X., & Stull, R. B. (2006). Probabilistic aspects of meteorological and ozone regional ensemble forecasts. Journal of Geophysical Research: Atmospheres, 111, D24307. doi:10.1029/2005JD006917
Ferro, C. A. T. (2014). Fair scores for ensemble forecasts. Quarterly Journal of the Royal Meteorological Society, 140, 1917–1923. doi:10.1002/qj.2270
Gudmundsson, L., Bremnes, J. B., Haugen, J. E., & Engen-Skaugen, T. (2012). Technical Note: Downscaling RCM precipitation to the station scale using statistical transformations — a comparison of methods. Hydrology and Earth System Sciences, 16, 3383–3390. doi:10.5194/hess-16-3383-2012
Hay, L. E., Wilby, R. L., & Leavesley, G. H. (2000). A comparison of delta change and downscaled GCM scenarios for three mountainous basins in the United States. JAWRA Journal of the American Water Resources Association, 36, 387–397. doi:10.1111/j.1752-1688.2000.tb04276.x
Johnson, S. J., Stockdale, T. N., Ferranti, L., et al. (2019). SEAS5: the new ECMWF seasonal forecast system. Geoscientific Model Development, 12, 1087–1117. doi:10.5194/gmd-12-1087-2019
Leander, R., & Buishand, T. A. (2007). Resampling of regional climate model output for the simulation of extreme river flows. Journal of Hydrology, 332, 487–496. doi:10.1016/j.jhydrol.2006.08.006
Lenderink, G., Buishand, A., & van Deursen, W. (2007). Estimates of future discharges of the river Rhine using two scenario methodologies: direct versus delta approach. Hydrology and Earth System Sciences, 11, 1145–1159. doi:10.5194/hess-11-1145-2007
Manzanas, R., Gutiérrez, J. M., Bhend, J., et al. (2019). Bias adjustment and ensemble recalibration methods for seasonal forecasting: a comprehensive intercomparison using the C3S dataset. Climate Dynamics, 53, 1287–1305. doi:10.1007/s00382-019-04640-4
Michelangeli, P.-A., Vrac, M., & Loukos, H. (2009). Probabilistic downscaling approaches: application to wind cumulative distribution functions. Geophysical Research Letters, 36, L11708. doi:10.1029/2009GL038401
Piani, C., Weedon, G. P., Best, M., et al. (2010). Statistical bias correction of global simulated daily precipitation and temperature for the application of hydrological models. Journal of Hydrology, 395, 199–215. doi:10.1016/j.jhydrol.2010.10.024
Schmidli, J., Frei, C., & Vidale, P. L. (2006). Downscaling from GCM precipitation: a benchmark for dynamical and statistical downscaling methods. International Journal of Climatology, 26, 679–689. doi:10.1002/joc.1287
Switanek, M. B., Troch, P. A., Castro, C. L., et al. (2017). Scaled distribution mapping: a bias correction method that preserves raw climate model projected changes. Hydrology and Earth System Sciences, 21, 2649–2666. doi:10.5194/hess-21-2649-2017
Teutschbein, C., & Seibert, J. (2012). Bias correction of regional climate model simulations for hydrological climate-change impact studies: review and evaluation of different methods. Journal of Hydrology, 456–457, 12–29. doi:10.1016/j.jhydrol.2012.05.052
Themeßl, M. J., Gobiet, A., & Leuprecht, A. (2011). Empirical-statistical downscaling and error correction of daily precipitation from regional climate models. International Journal of Climatology, 31, 1530–1544. doi:10.1002/joc.2168
Torralba, V., Doblas-Reyes, F. J., MacLeod, D., Christel, I., & Davis, M. (2017). Seasonal climate prediction: a new source of information for the management of wind energy resources. Journal of Applied Meteorology and Climatology, 56, 1231–1247. doi:10.1175/JAMC-D-16-0204.1
Vrac, M., Drobinski, P., Merlo, A., et al. (2012). Dynamical and statistical downscaling of the French Mediterranean climate: uncertainty assessment. Natural Hazards and Earth System Sciences, 12, 2769–2784. doi:10.5194/nhess-12-2769-2012
DOIs checked against Crossref, 11 October 2026.
September initialization · ONDJ and its months
Research benchmark. The published forecasts still use Mean-Variance Scaling (operational). This section
compares 12 other rainfall-amount bias-correction methods with it, member by member, for every grid cell and target:
a screening of the amount correction alone, then a confirmation through the full probability pipeline that also
accounts for how a method is chosen.
Suggested method
The platform suggests a bias-correction method for every target and product from the historical evidence (the confirmation
against CHIRPS, counting every method tried) and the independent validation seasons scored since (the shadow and validation
runs), by a rule fixed before those seasons are scored. A suggestion is advice for a decision: the published forecast
always uses Mean-Variance Scaling until a change is decided. 1 of 10 target–product combinations have a
candidate.
The rule
Candidate: A method is a candidate only if the confirmation (CHIRPS, outer leave-one-year-out over the training years, full pipeline) finds it better than the operational method with Holm-adjusted p < 0.05 across every declared method and target, and not worse over the test years. Variants outside the declared family are not candidates.
Choice: Among candidates, the method the selection-aware procedure chooses from all training years (training-only information); if that method is not a candidate, the candidate with the best training-period score. Other candidates are listed as alternatives: a confirmation establishes improvement against the operational method, not a ranking among candidates.
Validation: Independent validation seasons are forecast years scored after the benchmark (bias_validation.py). A candidate is 'recommended' once at least minimum_seasons have been scored for it and the operational method, and its mean score over them is not worse; with fewer seasons it stays a 'candidate'; with enough seasons and a worse mean it is 'not supported by validation'. Minimum: 3 seasons.
Suggested methods (national aggregate)
Target
Product
Suggested method
Status
Evidence
Oct
Published tercile probabilities
Mean-Variance Scaling
Keep the operational method
No method is confirmed better than Mean-Variance Scaling for Oct on the historical evidence.
Oct
Rainfall amounts
Mean-Variance Scaling
Keep the operational method
No method is confirmed better than Mean-Variance Scaling for Oct on the historical evidence.
Nov
Published tercile probabilities
Mean-Variance Scaling
Keep the operational method
No method is confirmed better than Mean-Variance Scaling for Nov on the historical evidence.
Nov
Rainfall amounts
Mean-Variance Scaling
Keep the operational method
No method is confirmed better than Mean-Variance Scaling for Nov on the historical evidence.
Dec
Published tercile probabilities
Mean-Variance Scaling
Keep the operational method
No method is confirmed better than Mean-Variance Scaling for Dec on the historical evidence.
Dec
Rainfall amounts
Mean-Variance Scaling
Keep the operational method
No method is confirmed better than Mean-Variance Scaling for Dec on the historical evidence.
Jan
Published tercile probabilities
Mean-Variance Scaling
Keep the operational method
No method is confirmed better than Mean-Variance Scaling for Jan on the historical evidence.
Jan
Rainfall amounts
Square-root-space Mean-Variance Scaling
Candidate — validation 0 of 3 seasons
Square-root-space Mean-Variance Scaling is confirmed better than Mean-Variance Scaling for Jan (CRPS (mm) difference -0.4787 over the training years, Holm p 0.0209; -0.6902 over the test years). Independent validation: 0 of 3 season(s). Also confirmed: Gamma Quantile Mapping.
ONDJ
Published tercile probabilities
Mean-Variance Scaling
Keep the operational method
No method is confirmed better than Mean-Variance Scaling for ONDJ on the historical evidence.
ONDJ
Rainfall amounts
Mean-Variance Scaling
Keep the operational method
No method is confirmed better than Mean-Variance Scaling for ONDJ on the historical evidence.
Summary — national aggregate (All Ethiopia)
All tested corrections improve national ONDJ rainfall-amount CRPSS over raw ECMWF in 1993–2016 (raw -0.180; corrected +0.053 to +0.093). Performance varies for monthly tercile probabilities: 3 method–month combinations score below the raw model on RPSS (Detrended Quantile Mapping in Dec, Scaled Distribution Mapping in Dec and CDF-transform in Dec).
Accounting for the whole search. With Holm adjustment across all 60 method–target comparisons, the amount (CRPS) screening passes are Square-root-space Mean-Variance Scaling (Jan) and Gamma Quantile Mapping (Jan), and the tercile (RPS) passes are Square-root-space Mean-Variance Scaling (Nov, Jan), Power Transformation (Jan) and Gamma Quantile Mapping (Jan). Within-method passes that do not survive this check: Empirical Quantile Mapping Jan, Gamma Quantile Mapping ONDJ, Square-root-space Mean-Variance Scaling Dec, Square-root-space Mean-Variance Scaling ONDJ and Variance Scaling (unbounded) Jan.
What the evidence supports
Published tercile probabilities: no tested method demonstrates a statistically significant improvement over Mean-Variance Scaling under this validation protocol (several have slightly higher point estimates); the selection-aware procedure is confirmed for none.
Rainfall amounts: confirmed against Mean-Variance Scaling (family-wide, full pipeline): Square-root-space Mean-Variance Scaling for Jan; Gamma Quantile Mapping for Jan. The selection-aware procedure is confirmed for Jan. These comparisons establish improvement against the reference, not that one candidate is better than another.
The operational method stays Mean-Variance Scaling until a change is decided by initialization, target and product, and recorded in the docs, on this evidence; confirmed improvements limited to some months may justify a per-target choice.
If amounts and probabilities come to use different correction paths, the product metadata must record both methods so that every output can be traced.
The same screening and confirmation run for the other cycles with one configuration file each (config/bias_correction/).
Data
Data used by the benchmark
Item
Details
Forecasts
ECMWF SEAS5 (system 51), initialized on 1 September; 25 members 1993–2016, 51 from 2017; remapped from 1° to the 0.25° CHIRPS grid by conservative remapping (each 1° cell fills a 4 × 4 block). Johnson et al. 2019
Observations
CHIRPS v3.0 monthly totals, averaged from 0.05° to 0.25°
Targets
Oct, Nov, Dec, Jan and the ONDJ season; each corrected separately
Values
One total per member, grid cell and year (mm), the same inputs as the operational tool (data/processed/init09_<target>/)
Score coverage (amounts / probabilities, share of the national area)
Oct 100% / 100%; Nov 100% / 100%; Dec 100% / 93%; Jan 100% / 77%; ONDJ 100% / 100%. Tercile scores need two distinct tercile boundaries defining three categories, a CHIRPS standard deviation of at least 1 mm and a lower boundary above 0 mm, so dry months have fewer probability cells.
Dry totals
≤ 1 mm in a month or season (not a dry day); exactly 0 mm is reported separately
Weighting
Every member is used; each training year has total weight 1/Y (each member of year y weighs 1/(Y·My)), so years with 25 and 51 members count equally. Each observed year weighs 1/Y.
Run
config/bias_correction/sep_ondj.json; 2026-10-11 20:38 UTC; commit bed63b906c; scoring version 3
Methods
Each method is fitted per grid cell and target from the training years only and applied to each member of the scored year.
Methods that keep a “change signal” (DC, DQM, QDM, SDM, CDF-t) were designed for climate change, where a model’s reference period is
compared with a future period; here the “future” is the forecast itself: the target year’s ensemble against the model climatology.
How overlapping names were resolved
Delta Change appeared twice in the requested list; it is one method.
Mean–Variance Scaling is the operational method, with the project’s 0.5–2 ratio limits. Variance Scaling uses the same algebra and the same fallback (ratio 1 where the model spread is below 1 mm) without the limits, so the comparison isolates the limits.
Delta Change returns the CHIRPS training years rescaled by the forecast signal (ensemble mean / model climatology): historical scenarios, not corrected members. Applied to each member instead it would be identical to Linear Scaling.
Square-root-space MVS (a mean–variance scaling of √x) is distinct from Power Transformation (a·xb with b fitted to the coefficient of variation).
The raw model is scored as a baseline, not screened.
Dry totals and tied values
A total at or below 1 mm in the month or season is “dry” (not a dry day).
For the quantile-mapping methods (EQM, Gamma QM, DQM, QDM) the dry shares of the model climatology and of CHIRPS are estimated with
the equal-year weights; a forecast’s dry members are spread evenly over the model’s dry probability by rank (deterministic stratified
tie-breaking, with ties resolved by member index), and a probability within the CHIRPS dry share maps to 0 mm, also after any
extrapolation of the upper tail. Without this, tied zeros share one
probability and the corrected dry share does not follow CHIRPS. Tests cover repeated zeros, all-dry samples and very few wet values;
the dry-month table under Results compares the shares. CDF-t, LOCI and the scaling methods have no occurrence adjustment; SDM uses its
own rain-member rule (Switanek et al. 2017).
12 methods, the operational reference and the raw baseline
Method
Family
Definition (per cell and target)
Member-wise
Uses the forecast ensemble’s own distribution
Parameters
References
Raw ECMWF (no correction) raw
baseline
x' = x (the uncorrected model; baseline, not a candidate)
Model threshold with the observed frequency of totals above 1 mm, then intensity scaling above it (designed for daily rainfall; here monthly or seasonal totals)
x' = G_obs^-1(G_model(x)), G = dry mass (<= 1 mm) + gamma by weighted maximum likelihood, with the dry policy; linear scaling where fewer than 3 wet values
a * EQM(x / a), a = forecast ensemble mean / model mean (0.2-5): removes and reapplies the bounded ratio; exact preservation of the final mean anomaly is not guaranteed
x' = Q_obs(tau) * x / Q_model(tau), tau = rank of x in the forecast ensemble; change capped at 5 and replaced by Q_obs(tau) where Q_model(tau) <= 1 mm (both reported), so preservation is partial there
Switanek et al. (2017) precipitation steps 1-7: gamma fits, recurrence intervals interpolated to the forecast's length, scaled CDF, rain-member count; model climatology with equal-year weights
F_obs,f = F_obs(F_model^-1(F_forecast)); x' = F_obs,f^-1(F_forecast(x)); implementation choices: model and forecast first scaled to the CHIRPS mean, values stay within the scaled forecast range
Per-member totals of every target and year, and CHIRPS for 1993–2024.
bias_benchmark.py · run_calibration.load_inputs
2
Fit
For each cell and target, the method’s statistics from the training years only, with equal-year weights.
bias_methods.METHODS[key].fit
3
Apply
Correct every member of the scored year individually (member-wise).
bias_methods.METHODS[key].apply
4
Score
Ensemble CRPS (and fair CRPS), ensemble-mean errors, spread–error, rank histograms, tercile RPS, dry shares and distribution ratios, per cell; then area-weighted per year.
bias_benchmark.score_cells · summarise
5
Screen
Each method against Mean-Variance Scaling per target: one-sided sign-flip test on whole years, Holm within the method and across all methods, no harm in 2017–2024.
bias_benchmark.make_gates
6
Confirm
Every method through the full probability pipeline (blend weight fitted inside the folds), and selection-aware procedures that choose the method each year from training-only scores.
bias_confirmation.py
Evaluation designs (no amount method has a parameter tuned on scores)
Design
Fits
Scored
Role
Screening: training
leave-one-year-out within 1993–2016
each 1993–2016 year
clean evidence for the screening
Screening: test
1993–2016
2017–2024
exploratory (these years were seen before)
Screening: full
leave-one-year-out within 1993–2024
each year
per-cell maps and distribution checks (descriptive)
Confirmation
outer leave-one-year-out within 1993–2016; inside each fold the blend weight (inner leave-one-year-out) and, for SEL-P/SEL-A, the method choice
each 1993–2016 year
full pipeline; accounts for the method choice
Confirmation: test
1993–2016 (fits, blend weight and method choice)
2017–2024
exploratory
Forecast
1993–2024
2026 members
member-by-member comparison
Scores
Score
What it measures
Reference
CRPS / CRPSS
Error of the corrected ensemble’s empirical distribution, as delivered, in mm; skill against the CHIRPS training climatology (the training years as an ensemble). Primary amount score.
Fair CRPS / CRPSS
The same under the interpretation that the members are a sample of an underlying distribution; reported as a diagnostic and screened separately. The justification assumes exchangeable members, which DC’s rescaled years and methods tied to the forecast mean or ranks only approximate.
The published probability product: counts, smoothing and the climatology blend with its weight fitted inside the folds; category Brier skill for below and above normal; reliability tables
Dry shares and distribution ratios
Pooled out-of-fold corrected members (equal-year weights) against CHIRPS of the same years: shares at exactly 0 mm and at ≤ 1 mm; mean, standard deviation, 10th and 90th percentile ratios (area-weighted medians)
Screening results
Region for the result tables
Tables for: All Ethiopia. ✓ = screening pass within the method (Holm across its targets); ✓✓ = also passes with Holm across all methods and targets. A pass is screening evidence, not an adoption decision. Bold: the operational method. Skill is against the CHIRPS training climatology (0 = no better than climatology).
ONDJ season at a glance — All Ethiopia
Method
Amount CRPSS
Tercile RPSS (no blend)
Diagnostics, leave-one-year-out 1993–2016
1993–2016
2017–2024
1993–2016
2017–2024
Mean bias (mm)
MAE (mm)
Correlation
Spread–error
Reliability index
Members ≤ 1 mm
Raw ECMWF (no correction)
-0.180
-0.116
-0.149
-0.109
-14.8
69.6
0.43
0.54
0.37
0.0%
Linear Scaling
+0.070
+0.131
+0.025
+0.058
-0.1
57.4
0.31
0.78
0.16
0.0%
Mean-Variance Scaling (operational)
+0.070
+0.178
+0.035
+0.065
-0.5
57.6
0.27
0.96
0.09
1.8%
Variance Scaling (unbounded)
+0.063
+0.182
+0.036
+0.064
-0.5
57.8
0.26
1.01
0.10
2.3%
Square-root-space Mean-Variance Scaling
+0.080 ✓
+0.189
+0.038
+0.073
-0.6
57.4
0.28
0.94
0.07
0.1%
Power Transformation
+0.071
+0.188
+0.036
+0.065
-0.9
57.9
0.26
1.01
0.05
0.0%
Delta Change
+0.093
+0.114
+0.028
+0.011
-0.1
57.4
0.31
1.16
0.05
0.0%
Local Intensity Scaling
+0.070
+0.131
+0.024
+0.058
-0.2
57.4
0.30
0.77
0.17
0.0%
Empirical Quantile Mapping
+0.053
+0.168
+0.025
+0.049
-1.1
57.8
0.25
0.97
0.10
0.0%
Gamma Quantile Mapping
+0.082 ✓
+0.192
+0.039
+0.076
-0.5
57.3
0.28
0.93
0.08
0.0%
Detrended Quantile Mapping
+0.072
+0.115
+0.010
+0.024
-1.7
57.0
0.32
0.98
0.08
0.0%
Quantile Delta Mapping
+0.075
+0.118
+0.009
+0.020
-0.1
57.4
0.31
1.04
0.09
0.0%
Scaled Distribution Mapping
+0.061
+0.108
-0.005
+0.010
-5.2
56.9
0.30
0.86
0.18
0.4%
CDF-transform
+0.074
+0.118
+0.011
+0.029
-3.8
56.8
0.32
0.83
0.12
0.0%
MVS with all-zero guard (variant)
+0.070
+0.178
+0.035
+0.065
-0.5
57.6
0.27
0.96
0.09
1.8%
Amount skill (CRPSS) by target, leave-one-year-out 1993–2016
Method
Oct
Nov
Dec
Jan
ONDJ
Raw ECMWF (no correction)
-0.203
-0.033
-0.118
-0.551
-0.180
Linear Scaling
-0.016
+0.073
-0.008
-0.132
+0.070
Mean-Variance Scaling (operational)
-0.002
+0.084
+0.028
-0.048
+0.070
Variance Scaling (unbounded)
-0.004
+0.082
+0.031
-0.007 ✓
+0.063
Square-root-space Mean-Variance Scaling
+0.006
+0.089
+0.037 ✓
+0.034 ✓✓
+0.080 ✓
Power Transformation
+0.001
+0.082
+0.020
-0.025
+0.071
Delta Change
+0.021
+0.085
+0.026
-0.047
+0.093
Local Intensity Scaling
-0.016
+0.079
+0.010
-0.104
+0.070
Empirical Quantile Mapping
-0.012
+0.075
+0.033
+0.010
+0.053
Gamma Quantile Mapping
+0.007
+0.088
+0.030
+0.015 ✓✓
+0.082 ✓
Detrended Quantile Mapping
+0.005
+0.075
-0.001
-0.065
+0.072
Quantile Delta Mapping
+0.010
+0.076
+0.014
-0.027
+0.075
Scaled Distribution Mapping
-0.002
+0.068
-0.021
-0.216
+0.061
CDF-transform
+0.002
+0.073
-0.019
-0.108
+0.074
MVS with all-zero guard (variant)
-0.002
+0.084
+0.028
-0.048
+0.070
Tercile skill (RPSS of smoothed counts, no blend) by target, 1993–2016
Method
Oct
Nov
Dec
Jan
ONDJ
Raw ECMWF (no correction)
-0.165
-0.043
-0.175
-0.516
-0.149
Linear Scaling
-0.033
+0.035
-0.080
-0.144
+0.025
Mean-Variance Scaling (operational)
-0.009
+0.044
-0.068
-0.213
+0.035
Variance Scaling (unbounded)
-0.009
+0.045
-0.060
-0.176 ✓
+0.036
Square-root-space Mean-Variance Scaling
-0.005
+0.060 ✓✓
-0.030 ✓
-0.017 ✓✓
+0.038
Power Transformation
-0.013
+0.044
-0.049
-0.046 ✓✓
+0.036
Delta Change
-0.003
+0.044
-0.154
-0.214
+0.028
Local Intensity Scaling
-0.028
+0.047
-0.109
-0.153
+0.024
Empirical Quantile Mapping
-0.023
+0.046
-0.065
-0.010 ✓
+0.025
Gamma Quantile Mapping
-0.006
+0.052
-0.111
-0.038 ✓✓
+0.039
Detrended Quantile Mapping
-0.020
+0.031
-0.189
-0.211
+0.010
Quantile Delta Mapping
-0.015
+0.020
-0.116
-0.074
+0.009
Scaled Distribution Mapping
-0.025
+0.018
-0.192
-0.321
-0.005
CDF-transform
-0.026
+0.010
-0.241
-0.254
+0.011
MVS with all-zero guard (variant)
-0.009
+0.044
-0.068
-0.213
+0.035
More scores by target: test years, fair CRPS, bias, correlation, spread, reliability, coverage
Amount skill (CRPSS), fit 1993–2016, scored 2017–2024
Method
Oct
Nov
Dec
Jan
ONDJ
Raw ECMWF (no correction)
-0.120
+0.031
-0.183
-0.573
-0.116
Linear Scaling
+0.054
+0.125
-0.114
-0.182
+0.131
Mean-Variance Scaling (operational)
+0.059
+0.158
-0.033
-0.078
+0.178
Variance Scaling (unbounded)
+0.056
+0.159
-0.032
+0.007
+0.182
Square-root-space Mean-Variance Scaling
+0.060
+0.162
-0.026
+0.093
+0.189
Power Transformation
+0.049
+0.165
-0.062
+0.007
+0.188
Delta Change
+0.028
+0.117
-0.019
-0.030
+0.114
Local Intensity Scaling
+0.052
+0.134
-0.079
-0.115
+0.131
Empirical Quantile Mapping
+0.033
+0.158
-0.015
+0.105
+0.168
Gamma Quantile Mapping
+0.059
+0.165
-0.037
+0.053
+0.192
Detrended Quantile Mapping
+0.034
+0.116
-0.042
-0.063
+0.115
Quantile Delta Mapping
+0.036
+0.123
-0.043
+0.032
+0.118
Scaled Distribution Mapping
+0.025
+0.103
-0.055
-0.184
+0.108
CDF-transform
+0.030
+0.120
-0.097
-0.151
+0.118
MVS with all-zero guard (variant)
+0.059
+0.158
-0.033
-0.078
+0.178
Amount skill with the fair CRPS (diagnostic), 1993–2016
Method
Oct
Nov
Dec
Jan
ONDJ
Raw ECMWF (no correction)
-0.226
-0.048
-0.136
-0.599
-0.205
Linear Scaling
-0.031
+0.068
-0.007
-0.119
+0.060
Mean-Variance Scaling (operational)
-0.009
+0.082
+0.023
-0.066
+0.066
Variance Scaling (unbounded)
-0.011
+0.080
+0.026
-0.019 ✓✓
+0.060
Square-root-space Mean-Variance Scaling
-0.002
+0.085
+0.032 ✓
+0.030 ✓✓
+0.075 ✓
Power Transformation
-0.006
+0.079
+0.016
-0.029
+0.067
Delta Change
+0.022
+0.089
+0.027
-0.049
+0.097
Local Intensity Scaling
-0.031
+0.075
+0.009
-0.099
+0.059
Empirical Quantile Mapping
-0.020
+0.071
+0.027
+0.004 ✓
+0.046
Gamma Quantile Mapping
-0.001
+0.083
+0.024
+0.008 ✓✓
+0.076
Detrended Quantile Mapping
-0.002
+0.072
-0.007
-0.073
+0.066
Quantile Delta Mapping
+0.005
+0.074
+0.010
-0.030
+0.071
Scaled Distribution Mapping
-0.013
+0.059
-0.035
-0.240
+0.052
CDF-transform
-0.009
+0.067
-0.026
-0.117
+0.065
MVS with all-zero guard (variant)
-0.009
+0.082
+0.023
-0.066
+0.066
Tercile skill (RPSS, no blend), fit 1993–2016, scored 2017–2024
Method
Oct
Nov
Dec
Jan
ONDJ
Raw ECMWF (no correction)
-0.058
-0.054
-0.084
-0.257
-0.109
Linear Scaling
+0.062
+0.006
-0.028
-0.011
+0.058
Mean-Variance Scaling (operational)
+0.012
+0.041
-0.049
-0.300
+0.065
Variance Scaling (unbounded)
+0.008
+0.044
-0.042
-0.220
+0.064
Square-root-space Mean-Variance Scaling
+0.018
+0.058
-0.033
+0.052
+0.073
Power Transformation
+0.007
+0.050
-0.026
+0.013
+0.065
Delta Change
-0.023
-0.026
-0.061
-0.053
+0.011
Local Intensity Scaling
+0.037
-0.001
-0.036
-0.018
+0.058
Empirical Quantile Mapping
-0.041
+0.022
-0.014
+0.092
+0.049
Gamma Quantile Mapping
-0.002
+0.050
-0.136
-0.012
+0.076
Detrended Quantile Mapping
-0.028
-0.021
-0.086
-0.051
+0.024
Quantile Delta Mapping
-0.018
-0.012
-0.026
+0.083
+0.020
Scaled Distribution Mapping
-0.033
-0.068
-0.088
-0.127
+0.010
CDF-transform
-0.014
-0.009
-0.119
-0.027
+0.029
MVS with all-zero guard (variant)
+0.012
+0.041
-0.049
-0.300
+0.065
Ensemble-mean bias (mm), 1993–2016
Method
Oct
Nov
Dec
Jan
ONDJ
Raw ECMWF (no correction)
+4.4
-5.4
-4.8
-9.0
-14.8
Linear Scaling
-0.0
-0.1
+0.0
+0.1
-0.1
Mean-Variance Scaling (operational)
+0.4
+0.2
+0.1
-0.0
-0.5
Variance Scaling (unbounded)
+0.4
+0.3
+0.1
-0.0
-0.5
Square-root-space Mean-Variance Scaling
-0.1
-0.1
+0.0
+0.0
-0.6
Power Transformation
-0.1
-0.1
+0.0
-0.0
-0.9
Delta Change
-0.0
-0.1
+0.0
+0.1
-0.1
Local Intensity Scaling
-0.0
-0.1
-0.3
-0.9
-0.2
Empirical Quantile Mapping
-0.2
-0.1
-0.0
-0.1
-1.1
Gamma Quantile Mapping
-0.1
-0.1
-0.1
-0.1
-0.5
Detrended Quantile Mapping
-0.2
-0.1
+0.1
+0.4
-1.7
Quantile Delta Mapping
+0.0
+0.3
+0.4
+0.6
-0.1
Scaled Distribution Mapping
-4.5
-3.9
-3.4
-5.3
-5.2
CDF-transform
-1.8
-0.6
+0.4
+1.2
-3.8
MVS with all-zero guard (variant)
+0.4
+0.2
+0.1
-0.0
-0.5
Correlation of the ensemble mean with CHIRPS over years, 1993–2016
Method
Oct
Nov
Dec
Jan
ONDJ
Raw ECMWF (no correction)
+0.23
+0.38
+0.16
+0.18
+0.43
Linear Scaling
+0.07
+0.24
+0.03
+0.11
+0.31
Mean-Variance Scaling (operational)
+0.08
+0.23
+0.02
+0.01
+0.27
Variance Scaling (unbounded)
+0.08
+0.23
+0.01
-0.03
+0.26
Square-root-space Mean-Variance Scaling
+0.09
+0.23
+0.01
+0.05
+0.28
Power Transformation
+0.08
+0.23
+0.02
+0.02
+0.26
Delta Change
+0.07
+0.24
+0.03
+0.08
+0.31
Local Intensity Scaling
+0.07
+0.24
+0.03
+0.08
+0.30
Empirical Quantile Mapping
+0.07
+0.22
+0.00
-0.01
+0.25
Gamma Quantile Mapping
+0.09
+0.22
+0.00
-0.04
+0.28
Detrended Quantile Mapping
+0.09
+0.24
+0.02
+0.11
+0.32
Quantile Delta Mapping
+0.07
+0.24
+0.02
+0.05
+0.31
Scaled Distribution Mapping
+0.06
+0.25
+0.06
+0.11
+0.30
CDF-transform
+0.06
+0.24
+0.04
+0.16
+0.32
MVS with all-zero guard (variant)
+0.08
+0.23
+0.02
+0.01
+0.27
Spread–error ratio, 1993–2016 (1 = spread matches the error)
Score coverage, mean per year, 1993–2016 (share of the region’s area)
Target
Amount cells
Amount area
Probability cells
Probability area
Oct
1484
100%
1478
100%
Nov
1484
100%
1478
100%
Dec
1484
100%
1378
93%
Jan
1484
100%
1149
77%
ONDJ
1484
100%
1484
100%
Dry months: shares of totals at exactly 0 mm and at ≤ 1 mm, CHIRPS and corrected
Area-weighted mean share over cells, pooled leave-one-year-out 1993–2024
Exactly 0 mm
≤ 1 mm
Oct: CHIRPS
0.4%
2.3%
Raw ECMWF (no correction)
0.0%
0.8%
Linear Scaling
0.0%
0.9%
Mean-Variance Scaling (operational)
4.3%
5.0%
Variance Scaling (unbounded)
4.4%
5.2%
Square-root-space Mean-Variance Scaling
0.9%
2.7%
Power Transformation
0.0%
1.5%
Delta Change
0.4%
2.4%
Local Intensity Scaling
2.3%
2.3%
Empirical Quantile Mapping
2.3%
2.4%
Gamma Quantile Mapping
2.5%
3.2%
Detrended Quantile Mapping
2.2%
2.4%
Quantile Delta Mapping
2.3%
2.6%
Scaled Distribution Mapping
3.6%
3.7%
CDF-transform
0.0%
2.0%
MVS with all-zero guard (variant)
4.3%
5.0%
Nov: CHIRPS
0.7%
5.2%
Raw ECMWF (no correction)
0.5%
8.5%
Linear Scaling
0.5%
7.7%
Mean-Variance Scaling (operational)
7.6%
9.4%
Variance Scaling (unbounded)
8.2%
10.0%
Square-root-space Mean-Variance Scaling
2.2%
6.3%
Power Transformation
0.5%
6.5%
Delta Change
0.7%
5.7%
Local Intensity Scaling
5.5%
5.5%
Empirical Quantile Mapping
5.2%
5.3%
Gamma Quantile Mapping
5.5%
7.9%
Detrended Quantile Mapping
4.9%
5.6%
Quantile Delta Mapping
5.2%
6.1%
Scaled Distribution Mapping
12.4%
12.8%
CDF-transform
0.3%
4.9%
MVS with all-zero guard (variant)
7.6%
9.4%
Dec: CHIRPS
0.6%
18.9%
Raw ECMWF (no correction)
6.5%
32.5%
Linear Scaling
6.5%
32.2%
Mean-Variance Scaling (operational)
12.0%
22.2%
Variance Scaling (unbounded)
8.9%
21.3%
Square-root-space Mean-Variance Scaling
2.7%
19.6%
Power Transformation
6.5%
26.1%
Delta Change
0.6%
20.4%
Local Intensity Scaling
21.5%
21.5%
Empirical Quantile Mapping
18.9%
19.0%
Gamma Quantile Mapping
18.2%
23.4%
Detrended Quantile Mapping
18.6%
21.4%
Quantile Delta Mapping
18.9%
20.7%
Scaled Distribution Mapping
36.0%
39.8%
CDF-transform
0.3%
20.0%
MVS with all-zero guard (variant)
12.0%
22.2%
Jan: CHIRPS
1.0%
16.6%
Raw ECMWF (no correction)
20.0%
55.3%
Linear Scaling
20.0%
43.1%
Mean-Variance Scaling (operational)
4.6%
16.8%
Variance Scaling (unbounded)
1.5%
16.1%
Square-root-space Mean-Variance Scaling
0.8%
17.2%
Power Transformation
20.0%
27.2%
Delta Change
1.0%
20.6%
Local Intensity Scaling
28.1%
28.1%
Empirical Quantile Mapping
16.6%
16.7%
Gamma Quantile Mapping
14.9%
18.7%
Detrended Quantile Mapping
16.5%
21.6%
Quantile Delta Mapping
16.6%
17.2%
Scaled Distribution Mapping
48.1%
56.4%
CDF-transform
0.2%
19.3%
MVS with all-zero guard (variant)
4.6%
16.8%
ONDJ: CHIRPS
0.0%
0.0%
Raw ECMWF (no correction)
0.0%
0.0%
Linear Scaling
0.0%
0.0%
Mean-Variance Scaling (operational)
1.5%
1.6%
Variance Scaling (unbounded)
2.0%
2.1%
Square-root-space Mean-Variance Scaling
0.0%
0.1%
Power Transformation
0.0%
0.0%
Delta Change
0.0%
0.0%
Local Intensity Scaling
0.0%
0.0%
Empirical Quantile Mapping
0.0%
0.0%
Gamma Quantile Mapping
0.0%
0.0%
Detrended Quantile Mapping
0.0%
0.0%
Quantile Delta Mapping
0.0%
0.0%
Scaled Distribution Mapping
0.7%
0.7%
CDF-transform
0.0%
0.0%
MVS with all-zero guard (variant)
1.5%
1.6%
Distribution of the corrected members (mean, spread, 10th and 90th percentiles)
Mean of the corrected members / CHIRPS (area-weighted median of cell ratios, 1993–2024; 1 = same)
Method
Oct
Nov
Dec
Jan
ONDJ
Raw ECMWF (no correction)
0.98
0.79
0.82
0.34
0.86
Linear Scaling
1.00
1.00
1.00
1.01
1.00
Mean-Variance Scaling (operational)
1.00
1.00
1.00
1.00
1.00
Variance Scaling (unbounded)
1.00
1.00
1.00
1.00
1.00
Square-root-space Mean-Variance Scaling
1.00
1.00
1.00
1.00
1.00
Power Transformation
1.00
1.00
1.00
1.00
1.00
Delta Change
1.00
1.00
1.00
1.00
1.00
Local Intensity Scaling
1.00
1.00
0.97
0.90
1.00
Empirical Quantile Mapping
1.00
1.00
1.00
1.00
1.00
Gamma Quantile Mapping
1.00
1.00
1.00
1.00
1.00
Detrended Quantile Mapping
1.00
1.00
1.00
1.02
0.99
Quantile Delta Mapping
1.00
1.01
1.03
1.04
1.00
Scaled Distribution Mapping
0.94
0.88
0.72
0.51
0.97
CDF-transform
0.99
0.99
1.04
1.11
0.98
MVS with all-zero guard (variant)
1.00
1.00
1.00
1.00
1.00
Standard deviation of the corrected members / CHIRPS (area-weighted median of cell ratios, 1993–2024; 1 = same)
Method
Oct
Nov
Dec
Jan
ONDJ
Raw ECMWF (no correction)
0.79
0.77
1.05
0.96
0.69
Linear Scaling
0.81
0.94
1.26
2.50
0.84
Mean-Variance Scaling (operational)
1.00
0.99
1.01
1.02
0.99
Variance Scaling (unbounded)
1.00
0.99
1.01
1.02
0.99
Square-root-space Mean-Variance Scaling
0.98
0.94
0.93
1.11
0.94
Power Transformation
1.00
1.00
1.01
1.00
1.00
Delta Change
1.06
1.09
1.17
1.34
1.07
Local Intensity Scaling
0.81
0.96
1.16
1.70
0.83
Empirical Quantile Mapping
1.00
0.99
1.00
1.00
0.98
Gamma Quantile Mapping
0.98
0.91
0.88
0.91
0.92
Detrended Quantile Mapping
0.99
1.00
1.09
1.29
0.96
Quantile Delta Mapping
1.01
1.03
1.16
1.37
0.99
Scaled Distribution Mapping
0.88
0.85
0.87
0.97
0.86
CDF-transform
0.93
0.98
1.13
1.53
0.89
MVS with all-zero guard (variant)
1.00
0.99
1.01
1.02
0.99
10th percentile of the corrected members / CHIRPS (area-weighted median of cell ratios, 1993–2024; 1 = same)
Method
Oct
Nov
Dec
Jan
ONDJ
Raw ECMWF (no correction)
1.27
0.52
0.06
0.00
0.93
Linear Scaling
1.25
0.73
0.07
0.00
1.03
Mean-Variance Scaling (operational)
0.88
0.61
0.62
1.16
0.86
Variance Scaling (unbounded)
0.85
0.58
0.71
1.16
0.82
Square-root-space Mean-Variance Scaling
0.95
0.75
0.57
0.86
0.91
Power Transformation
1.00
0.64
0.24
0.00
0.89
Delta Change
0.92
0.86
0.71
0.62
0.91
Local Intensity Scaling
1.20
0.65
0.26
0.00
1.04
Empirical Quantile Mapping
0.96
0.97
0.98
0.99
0.97
Gamma Quantile Mapping
0.97
0.78
0.59
0.70
0.94
Detrended Quantile Mapping
0.95
0.87
0.69
0.61
0.96
Quantile Delta Mapping
0.97
0.89
0.76
0.93
0.97
Scaled Distribution Mapping
0.97
0.69
0.00
0.00
0.98
CDF-transform
1.01
0.87
0.61
0.58
0.98
MVS with all-zero guard (variant)
0.88
0.61
0.62
1.16
0.86
90th percentile of the corrected members / CHIRPS (area-weighted median of cell ratios, 1993–2024; 1 = same)
Method
Oct
Nov
Dec
Jan
ONDJ
Raw ECMWF (no correction)
0.92
0.81
1.10
0.47
0.81
Linear Scaling
0.96
1.01
1.31
1.42
0.98
Mean-Variance Scaling (operational)
1.03
1.01
1.11
0.92
1.04
Variance Scaling (unbounded)
1.03
1.01
1.07
0.92
1.05
Square-root-space Mean-Variance Scaling
1.03
0.99
1.09
1.06
1.02
Power Transformation
1.03
1.01
1.12
1.11
1.04
Delta Change
1.06
1.05
1.07
1.12
1.06
Local Intensity Scaling
0.96
1.01
1.16
1.08
0.98
Empirical Quantile Mapping
1.03
1.04
1.07
1.04
1.03
Gamma Quantile Mapping
1.03
0.98
1.00
0.97
1.02
Detrended Quantile Mapping
1.03
1.03
1.08
1.13
1.02
Quantile Delta Mapping
1.04
1.04
1.11
1.08
1.04
Scaled Distribution Mapping
0.96
0.89
0.83
0.71
0.97
CDF-transform
1.01
1.03
1.15
1.30
1.01
MVS with all-zero guard (variant)
1.03
1.01
1.11
0.92
1.04
Tables for: ONDJ R3 (Deyr) domain. Screening marks are computed for the national aggregate (All Ethiopia) only. Bold: the operational method. Skill is against the CHIRPS training climatology (0 = no better than climatology).
ONDJ season at a glance — ONDJ R3 (Deyr) domain
Method
Amount CRPSS
Tercile RPSS (no blend)
Diagnostics, leave-one-year-out 1993–2016
1993–2016
2017–2024
1993–2016
2017–2024
Mean bias (mm)
MAE (mm)
Correlation
Spread–error
Reliability index
Members ≤ 1 mm
Raw ECMWF (no correction)
-0.039
+0.004
-0.018
+0.043
-43.7
78.5
0.61
0.44
0.49
0.0%
Linear Scaling
+0.122
+0.284
+0.121
+0.282
-0.3
71.1
0.50
0.72
0.29
0.0%
Mean-Variance Scaling (operational)
+0.141
+0.375
+0.150
+0.314
-0.6
70.4
0.49
0.96
0.18
2.8%
Variance Scaling (unbounded)
+0.130
+0.383
+0.150
+0.313
-0.4
71.0
0.47
1.03
0.22
4.1%
Square-root-space Mean-Variance Scaling
+0.151
+0.386
+0.154
+0.320
-0.9
70.3
0.49
0.97
0.13
0.2%
Power Transformation
+0.143
+0.394
+0.153
+0.325
-1.1
71.2
0.47
1.04
0.08
0.0%
Delta Change
+0.147
+0.273
+0.135
+0.253
-0.3
71.1
0.50
1.21
0.10
0.0%
Local Intensity Scaling
+0.120
+0.282
+0.119
+0.281
-0.3
71.2
0.50
0.71
0.29
0.0%
Empirical Quantile Mapping
+0.114
+0.367
+0.141
+0.316
-1.7
71.5
0.45
0.99
0.10
0.0%
Gamma Quantile Mapping
+0.154
+0.389
+0.153
+0.321
-0.7
70.2
0.50
0.97
0.10
0.0%
Detrended Quantile Mapping
+0.129
+0.267
+0.123
+0.275
-3.0
70.8
0.51
0.99
0.10
0.0%
Quantile Delta Mapping
+0.134
+0.273
+0.126
+0.267
-1.0
71.1
0.50
1.07
0.09
0.0%
Scaled Distribution Mapping
+0.122
+0.267
+0.116
+0.269
-9.5
70.1
0.49
0.85
0.13
0.5%
CDF-transform
+0.133
+0.274
+0.131
+0.277
-6.5
69.9
0.53
0.82
0.16
0.0%
MVS with all-zero guard (variant)
+0.141
+0.375
+0.150
+0.314
-0.6
70.4
0.49
0.96
0.18
2.8%
Amount skill (CRPSS) by target, leave-one-year-out 1993–2016
Method
Oct
Nov
Dec
Jan
ONDJ
Raw ECMWF (no correction)
-0.035
+0.038
-0.039
-0.452
-0.039
Linear Scaling
+0.057
+0.093
+0.048
-0.089
+0.122
Mean-Variance Scaling (operational)
+0.084
+0.101
+0.064
-0.030
+0.141
Variance Scaling (unbounded)
+0.080
+0.098
+0.065
+0.019
+0.130
Square-root-space Mean-Variance Scaling
+0.090
+0.104
+0.072
+0.081
+0.151
Power Transformation
+0.083
+0.100
+0.058
-0.025
+0.143
Delta Change
+0.074
+0.099
+0.065
+0.013
+0.147
Local Intensity Scaling
+0.055
+0.099
+0.060
-0.071
+0.120
Empirical Quantile Mapping
+0.068
+0.089
+0.062
+0.043
+0.114
Gamma Quantile Mapping
+0.092
+0.104
+0.066
+0.042
+0.154
Detrended Quantile Mapping
+0.065
+0.090
+0.039
+0.011
+0.129
Quantile Delta Mapping
+0.066
+0.090
+0.056
+0.056
+0.134
Scaled Distribution Mapping
+0.057
+0.083
+0.029
-0.234
+0.122
CDF-transform
+0.062
+0.089
+0.035
-0.027
+0.133
MVS with all-zero guard (variant)
+0.084
+0.101
+0.064
-0.030
+0.141
Tercile skill (RPSS of smoothed counts, no blend) by target, 1993–2016
Method
Oct
Nov
Dec
Jan
ONDJ
Raw ECMWF (no correction)
-0.009
+0.041
-0.154
-0.542
-0.018
Linear Scaling
+0.091
+0.075
-0.084
-0.152
+0.121
Mean-Variance Scaling (operational)
+0.124
+0.100
-0.062
-0.282
+0.150
Variance Scaling (unbounded)
+0.124
+0.102
-0.054
-0.248
+0.150
Square-root-space Mean-Variance Scaling
+0.126
+0.105
-0.032
+0.027
+0.154
Power Transformation
+0.122
+0.086
-0.051
+0.008
+0.153
Delta Change
+0.081
+0.078
-0.190
-0.165
+0.135
Local Intensity Scaling
+0.089
+0.095
-0.157
-0.188
+0.119
Empirical Quantile Mapping
+0.107
+0.089
-0.132
+0.039
+0.141
Gamma Quantile Mapping
+0.126
+0.102
-0.166
-0.008
+0.153
Detrended Quantile Mapping
+0.087
+0.073
-0.255
-0.121
+0.123
Quantile Delta Mapping
+0.083
+0.068
-0.194
+0.002
+0.126
Scaled Distribution Mapping
+0.079
+0.068
-0.250
-0.366
+0.116
CDF-transform
+0.090
+0.067
-0.318
-0.175
+0.131
MVS with all-zero guard (variant)
+0.124
+0.100
-0.062
-0.282
+0.150
More scores by target: test years, fair CRPS, bias, correlation, spread, reliability, coverage
Amount skill (CRPSS), fit 1993–2016, scored 2017–2024
Method
Oct
Nov
Dec
Jan
ONDJ
Raw ECMWF (no correction)
-0.042
+0.123
-0.002
-0.499
+0.004
Linear Scaling
+0.155
+0.242
-0.018
-0.218
+0.284
Mean-Variance Scaling (operational)
+0.190
+0.280
+0.029
-0.144
+0.375
Variance Scaling (unbounded)
+0.185
+0.282
+0.029
-0.054
+0.383
Square-root-space Mean-Variance Scaling
+0.190
+0.284
+0.037
+0.067
+0.386
Power Transformation
+0.190
+0.292
+0.002
-0.063
+0.394
Delta Change
+0.145
+0.225
+0.047
-0.102
+0.273
Local Intensity Scaling
+0.154
+0.253
+0.010
-0.139
+0.282
Empirical Quantile Mapping
+0.173
+0.286
+0.035
+0.074
+0.367
Gamma Quantile Mapping
+0.192
+0.288
+0.024
+0.008
+0.389
Detrended Quantile Mapping
+0.137
+0.222
+0.014
-0.165
+0.267
Quantile Delta Mapping
+0.143
+0.227
+0.008
-0.005
+0.273
Scaled Distribution Mapping
+0.134
+0.222
+0.054
-0.246
+0.267
CDF-transform
+0.140
+0.228
-0.045
-0.323
+0.274
MVS with all-zero guard (variant)
+0.190
+0.280
+0.029
-0.144
+0.375
Amount skill with the fair CRPS (diagnostic), 1993–2016
Method
Oct
Nov
Dec
Jan
ONDJ
Raw ECMWF (no correction)
-0.057
+0.019
-0.057
-0.499
-0.065
Linear Scaling
+0.044
+0.085
+0.049
-0.076
+0.109
Mean-Variance Scaling (operational)
+0.079
+0.098
+0.060
-0.049
+0.138
Variance Scaling (unbounded)
+0.077
+0.096
+0.062
+0.006
+0.129
Square-root-space Mean-Variance Scaling
+0.086
+0.101
+0.067
+0.079
+0.148
Power Transformation
+0.078
+0.097
+0.056
-0.028
+0.140
Delta Change
+0.077
+0.103
+0.068
+0.013
+0.154
Local Intensity Scaling
+0.042
+0.093
+0.058
-0.070
+0.107
Empirical Quantile Mapping
+0.063
+0.085
+0.057
+0.038
+0.108
Gamma Quantile Mapping
+0.088
+0.100
+0.060
+0.035
+0.150
Detrended Quantile Mapping
+0.060
+0.087
+0.034
+0.006
+0.125
Quantile Delta Mapping
+0.063
+0.088
+0.053
+0.058
+0.132
Scaled Distribution Mapping
+0.048
+0.074
+0.016
-0.264
+0.114
CDF-transform
+0.053
+0.084
+0.029
-0.031
+0.124
MVS with all-zero guard (variant)
+0.079
+0.098
+0.060
-0.049
+0.138
Tercile skill (RPSS, no blend), fit 1993–2016, scored 2017–2024
Method
Oct
Nov
Dec
Jan
ONDJ
Raw ECMWF (no correction)
-0.079
+0.171
+0.005
-0.365
+0.043
Linear Scaling
+0.160
+0.229
+0.031
-0.072
+0.282
Mean-Variance Scaling (operational)
+0.146
+0.239
+0.036
-0.432
+0.314
Variance Scaling (unbounded)
+0.139
+0.238
+0.035
-0.346
+0.313
Square-root-space Mean-Variance Scaling
+0.140
+0.240
+0.030
+0.031
+0.320
Power Transformation
+0.139
+0.246
+0.038
-0.015
+0.325
Delta Change
+0.118
+0.175
+0.028
-0.161
+0.253
Local Intensity Scaling
+0.159
+0.224
+0.043
-0.100
+0.281
Empirical Quantile Mapping
+0.131
+0.228
+0.034
+0.079
+0.316
Gamma Quantile Mapping
+0.138
+0.226
-0.069
-0.076
+0.321
Detrended Quantile Mapping
+0.111
+0.204
+0.005
-0.125
+0.275
Quantile Delta Mapping
+0.115
+0.193
+0.060
+0.119
+0.267
Scaled Distribution Mapping
+0.110
+0.194
+0.022
-0.226
+0.269
CDF-transform
+0.114
+0.213
+0.020
-0.021
+0.277
MVS with all-zero guard (variant)
+0.146
+0.239
+0.036
-0.432
+0.314
Ensemble-mean bias (mm), 1993–2016
Method
Oct
Nov
Dec
Jan
ONDJ
Raw ECMWF (no correction)
-15.4
-15.2
-5.6
-7.5
-43.7
Linear Scaling
-0.1
-0.1
+0.0
+0.0
-0.3
Mean-Variance Scaling (operational)
+0.1
+0.4
+0.2
-0.0
-0.6
Variance Scaling (unbounded)
+0.3
+0.5
+0.2
-0.1
-0.4
Square-root-space Mean-Variance Scaling
-0.2
-0.2
-0.0
-0.0
-0.9
Power Transformation
-0.1
-0.1
+0.0
-0.1
-1.1
Delta Change
-0.1
-0.1
+0.0
+0.0
-0.3
Local Intensity Scaling
-0.1
-0.1
-0.4
-1.6
-0.3
Empirical Quantile Mapping
-0.3
-0.2
-0.1
-0.2
-1.7
Gamma Quantile Mapping
-0.1
-0.1
-0.0
-0.1
-0.7
Detrended Quantile Mapping
-0.3
-0.4
+0.0
+0.4
-3.0
Quantile Delta Mapping
-0.1
+0.1
+0.3
+0.5
-1.0
Scaled Distribution Mapping
-6.8
-4.3
-3.8
-5.4
-9.5
CDF-transform
-2.1
-1.6
+0.4
+1.4
-6.5
MVS with all-zero guard (variant)
+0.1
+0.4
+0.2
-0.0
-0.6
Correlation of the ensemble mean with CHIRPS over years, 1993–2016
Method
Oct
Nov
Dec
Jan
ONDJ
Raw ECMWF (no correction)
+0.42
+0.48
+0.26
+0.32
+0.61
Linear Scaling
+0.28
+0.33
+0.12
+0.25
+0.50
Mean-Variance Scaling (operational)
+0.29
+0.35
+0.12
+0.14
+0.49
Variance Scaling (unbounded)
+0.28
+0.34
+0.11
+0.03
+0.47
Square-root-space Mean-Variance Scaling
+0.29
+0.34
+0.11
+0.19
+0.49
Power Transformation
+0.28
+0.34
+0.12
+0.13
+0.47
Delta Change
+0.28
+0.33
+0.12
+0.25
+0.50
Local Intensity Scaling
+0.28
+0.34
+0.13
+0.21
+0.50
Empirical Quantile Mapping
+0.28
+0.33
+0.10
+0.07
+0.45
Gamma Quantile Mapping
+0.30
+0.34
+0.11
+0.02
+0.50
Detrended Quantile Mapping
+0.28
+0.34
+0.08
+0.25
+0.51
Quantile Delta Mapping
+0.27
+0.33
+0.09
+0.17
+0.50
Scaled Distribution Mapping
+0.27
+0.33
+0.15
+0.26
+0.49
CDF-transform
+0.28
+0.32
+0.13
+0.32
+0.53
MVS with all-zero guard (variant)
+0.29
+0.35
+0.12
+0.14
+0.49
Spread–error ratio, 1993–2016 (1 = spread matches the error)
Score coverage, mean per year, 1993–2016 (share of the region’s area)
Target
Amount cells
Amount area
Probability cells
Probability area
Oct
575
100%
575
100%
Nov
575
100%
570
99%
Dec
575
100%
574
100%
Jan
575
100%
362
63%
ONDJ
575
100%
575
100%
Dry months: shares of totals at exactly 0 mm and at ≤ 1 mm, CHIRPS and corrected
Area-weighted mean share over cells, pooled leave-one-year-out 1993–2024
Exactly 0 mm
≤ 1 mm
Oct: CHIRPS
0.0%
0.0%
Raw ECMWF (no correction)
0.0%
0.0%
Linear Scaling
0.0%
0.0%
Mean-Variance Scaling (operational)
2.8%
3.0%
Variance Scaling (unbounded)
3.3%
3.5%
Square-root-space Mean-Variance Scaling
0.2%
0.5%
Power Transformation
0.0%
0.0%
Delta Change
0.0%
0.0%
Local Intensity Scaling
0.0%
0.0%
Empirical Quantile Mapping
0.0%
0.0%
Gamma Quantile Mapping
0.0%
0.1%
Detrended Quantile Mapping
0.0%
0.0%
Quantile Delta Mapping
0.0%
0.0%
Scaled Distribution Mapping
1.6%
1.6%
CDF-transform
0.0%
0.0%
MVS with all-zero guard (variant)
2.8%
3.0%
Nov: CHIRPS
1.6%
7.2%
Raw ECMWF (no correction)
0.3%
3.4%
Linear Scaling
0.3%
2.8%
Mean-Variance Scaling (operational)
12.0%
13.3%
Variance Scaling (unbounded)
13.7%
15.0%
Square-root-space Mean-Variance Scaling
4.2%
8.3%
Power Transformation
0.3%
5.3%
Delta Change
1.6%
7.5%
Local Intensity Scaling
7.3%
7.3%
Empirical Quantile Mapping
7.2%
7.3%
Gamma Quantile Mapping
7.7%
9.7%
Detrended Quantile Mapping
6.7%
7.2%
Quantile Delta Mapping
7.2%
8.1%
Scaled Distribution Mapping
8.8%
9.1%
CDF-transform
0.5%
6.1%
MVS with all-zero guard (variant)
12.0%
13.3%
Dec: CHIRPS
0.0%
27.1%
Raw ECMWF (no correction)
7.6%
32.9%
Linear Scaling
7.6%
33.5%
Mean-Variance Scaling (operational)
16.4%
28.0%
Variance Scaling (unbounded)
15.6%
27.9%
Square-root-space Mean-Variance Scaling
4.5%
25.0%
Power Transformation
7.6%
32.6%
Delta Change
0.0%
28.4%
Local Intensity Scaling
30.1%
30.1%
Empirical Quantile Mapping
27.1%
27.2%
Gamma Quantile Mapping
28.1%
32.7%
Detrended Quantile Mapping
26.6%
30.3%
Quantile Delta Mapping
27.1%
29.5%
Scaled Distribution Mapping
44.1%
45.4%
CDF-transform
0.3%
26.8%
MVS with all-zero guard (variant)
16.4%
28.0%
Jan: CHIRPS
0.0%
25.2%
Raw ECMWF (no correction)
32.7%
71.5%
Linear Scaling
32.7%
61.0%
Mean-Variance Scaling (operational)
5.6%
25.9%
Variance Scaling (unbounded)
0.0%
24.9%
Square-root-space Mean-Variance Scaling
0.3%
26.1%
Power Transformation
32.7%
43.3%
Delta Change
0.0%
32.7%
Local Intensity Scaling
45.9%
45.9%
Empirical Quantile Mapping
25.2%
25.3%
Gamma Quantile Mapping
22.0%
28.5%
Detrended Quantile Mapping
25.0%
34.8%
Quantile Delta Mapping
25.2%
26.2%
Scaled Distribution Mapping
58.1%
72.2%
CDF-transform
0.0%
30.7%
MVS with all-zero guard (variant)
5.6%
25.9%
ONDJ: CHIRPS
0.0%
0.0%
Raw ECMWF (no correction)
0.0%
0.0%
Linear Scaling
0.0%
0.0%
Mean-Variance Scaling (operational)
2.7%
2.8%
Variance Scaling (unbounded)
3.9%
4.0%
Square-root-space Mean-Variance Scaling
0.1%
0.3%
Power Transformation
0.0%
0.0%
Delta Change
0.0%
0.0%
Local Intensity Scaling
0.0%
0.0%
Empirical Quantile Mapping
0.0%
0.0%
Gamma Quantile Mapping
0.0%
0.0%
Detrended Quantile Mapping
0.0%
0.0%
Quantile Delta Mapping
0.0%
0.0%
Scaled Distribution Mapping
1.2%
1.2%
CDF-transform
0.0%
0.0%
MVS with all-zero guard (variant)
2.7%
2.8%
Distribution of the corrected members (mean, spread, 10th and 90th percentiles)
Mean of the corrected members / CHIRPS (area-weighted median of cell ratios, 1993–2024; 1 = same)
Method
Oct
Nov
Dec
Jan
ONDJ
Raw ECMWF (no correction)
0.84
0.72
0.82
0.31
0.77
Linear Scaling
1.00
1.00
1.00
1.01
1.00
Mean-Variance Scaling (operational)
1.00
1.01
1.01
1.00
1.00
Variance Scaling (unbounded)
1.00
1.01
1.01
1.00
1.00
Square-root-space Mean-Variance Scaling
1.00
0.99
1.00
1.00
1.00
Power Transformation
1.00
1.00
1.00
1.00
1.00
Delta Change
1.00
1.00
1.00
1.01
1.00
Local Intensity Scaling
1.00
0.99
0.95
0.62
1.00
Empirical Quantile Mapping
1.00
0.99
1.00
1.00
1.00
Gamma Quantile Mapping
1.00
1.00
1.00
1.00
1.00
Detrended Quantile Mapping
1.00
0.99
0.99
1.03
0.98
Quantile Delta Mapping
1.00
0.99
1.02
1.04
0.99
Scaled Distribution Mapping
0.92
0.91
0.72
0.44
0.92
CDF-transform
0.98
0.96
1.03
1.23
0.96
MVS with all-zero guard (variant)
1.00
1.01
1.01
1.00
1.00
Standard deviation of the corrected members / CHIRPS (area-weighted median of cell ratios, 1993–2024; 1 = same)
Method
Oct
Nov
Dec
Jan
ONDJ
Raw ECMWF (no correction)
0.62
0.57
0.88
1.10
0.50
Linear Scaling
0.73
0.77
1.07
3.21
0.65
Mean-Variance Scaling (operational)
0.99
0.96
1.01
1.04
0.95
Variance Scaling (unbounded)
0.99
0.97
1.01
1.03
0.98
Square-root-space Mean-Variance Scaling
0.98
0.90
0.88
1.18
0.93
Power Transformation
1.00
1.00
1.02
1.01
0.99
Delta Change
1.05
1.08
1.20
1.50
1.06
Local Intensity Scaling
0.73
0.82
1.10
1.59
0.65
Empirical Quantile Mapping
0.99
0.99
1.00
0.98
0.98
Gamma Quantile Mapping
0.99
0.89
0.90
0.83
0.92
Detrended Quantile Mapping
0.99
0.97
1.09
1.44
0.92
Quantile Delta Mapping
1.01
0.99
1.15
1.48
0.97
Scaled Distribution Mapping
0.86
0.82
0.84
0.96
0.81
CDF-transform
0.89
0.88
1.06
2.02
0.78
MVS with all-zero guard (variant)
0.99
0.96
1.01
1.04
0.95
10th percentile of the corrected members / CHIRPS (area-weighted median of cell ratios, 1993–2024; 1 = same)
Method
Oct
Nov
Dec
Jan
ONDJ
Raw ECMWF (no correction)
1.15
0.88
0.04
0.00
1.02
Linear Scaling
1.47
1.20
0.05
0.00
1.36
Mean-Variance Scaling (operational)
0.91
0.00
0.37
1.14
0.81
Variance Scaling (unbounded)
0.86
0.00
0.37
1.17
0.66
Square-root-space Mean-Variance Scaling
0.98
0.68
0.38
0.82
0.89
Power Transformation
1.07
0.73
0.04
0.00
0.91
Delta Change
0.92
0.88
0.67
0.44
0.91
Local Intensity Scaling
1.50
0.93
0.00
0.00
1.37
Empirical Quantile Mapping
0.96
0.94
0.97
0.99
0.97
Gamma Quantile Mapping
1.02
0.79
0.40
0.57
0.93
Detrended Quantile Mapping
0.98
0.89
0.60
0.43
0.97
Quantile Delta Mapping
1.00
0.90
0.72
0.96
0.98
Scaled Distribution Mapping
0.99
0.93
0.00
0.00
0.97
CDF-transform
1.09
0.95
0.48
0.42
1.07
MVS with all-zero guard (variant)
0.91
0.00
0.37
1.14
0.81
90th percentile of the corrected members / CHIRPS (area-weighted median of cell ratios, 1993–2024; 1 = same)
Method
Oct
Nov
Dec
Jan
ONDJ
Raw ECMWF (no correction)
0.76
0.66
1.13
0.42
0.68
Linear Scaling
0.93
0.92
1.27
1.51
0.89
Mean-Variance Scaling (operational)
1.02
1.02
1.17
0.98
1.01
Variance Scaling (unbounded)
1.03
1.03
1.17
0.93
1.03
Square-root-space Mean-Variance Scaling
1.03
0.98
1.10
1.22
1.01
Power Transformation
1.02
1.00
1.16
1.54
1.02
Delta Change
1.06
1.05
1.06
1.33
1.06
Local Intensity Scaling
0.92
0.95
1.15
0.89
0.89
Empirical Quantile Mapping
1.03
1.04
1.11
1.03
1.04
Gamma Quantile Mapping
1.03
0.98
1.02
1.02
1.00
Detrended Quantile Mapping
1.02
1.02
1.09
1.19
0.99
Quantile Delta Mapping
1.03
1.03
1.13
0.99
1.02
Scaled Distribution Mapping
0.93
0.90
0.83
0.66
0.92
CDF-transform
0.99
0.99
1.14
1.77
0.94
MVS with all-zero guard (variant)
1.02
1.02
1.17
0.98
1.01
Screening statistics for every method, target and score (within-method and family-wide Holm)
Screening rule (docs/36 rule applied as a screen): a method passes for a target and score if, on the leave-one-year-out 1993-2016 per-year scores, its mean improvement over mvs has a one-sided sign-flip p-value below 0.05 after Holm adjustment, and its mean score over 2017-2024 (fits on 1993-2016) is not worse. 'screen_pass': Holm across the 5 targets of one method. 'screen_pass_family': Holm across every method and target of the benchmark for that score. A screening pass is not an operational adoption decision (see the confirmation run).
Screening statistics, CRPS (method minus Mean-Variance Scaling; negative favours the method)
Method
Target
Δ CRPS 1993–2016 (mm)
95% interval
Years better
p (one-sided)
Holm p (method)
Holm p (all 60)
Δ 2017–2024
Screening
Linear Scaling
Oct
+0.41
-0.38 to +1.28
11/24
0.8177
1.0000
1.0000
+0.16
—
Linear Scaling
Nov
+0.22
+0.02 to +0.40
6/24
0.9805
1.0000
1.0000
+0.77
—
Linear Scaling
Dec
+0.27
+0.12 to +0.41
7/24
0.9984
1.0000
1.0000
+0.38
—
Linear Scaling
Jan
+0.49
-0.08 to +1.00
9/24
0.9439
1.0000
1.0000
+0.42
—
Linear Scaling
ONDJ
-0.01
-1.28 to +1.23
14/24
0.4918
1.0000
1.0000
+2.36
—
Variance Scaling (unbounded)
Oct
+0.07
-0.04 to +0.17
8/24
0.8931
1.0000
1.0000
+0.08
—
Variance Scaling (unbounded)
Nov
+0.05
+0.02 to +0.08
7/24
0.9973
1.0000
1.0000
-0.02
—
Variance Scaling (unbounded)
Dec
-0.02
-0.06 to +0.01
15/24
0.1110
0.4440
1.0000
-0.00
—
Variance Scaling (unbounded)
Jan
-0.24
-0.37 to -0.11
16/24
0.0012
0.0062
0.0722
-0.34
✓
Variance Scaling (unbounded)
ONDJ
+0.34
+0.04 to +0.67
7/24
0.9789
1.0000
1.0000
-0.19
—
Square-root-space Mean-Variance Scaling
Oct
-0.23
-0.48 to +0.03
15/24
0.0488
0.0976
1.0000
-0.01
—
Square-root-space Mean-Variance Scaling
Nov
-0.09
-0.22 to +0.05
16/24
0.0955
0.0976
1.0000
-0.10
—
Square-root-space Mean-Variance Scaling
Dec
-0.07
-0.11 to -0.02
20/24
0.0048
0.0191
0.2722
-0.03
✓
Square-root-space Mean-Variance Scaling
Jan
-0.48
-0.72 to -0.25
18/24
0.0004
0.0018
0.0209
-0.69
✓✓
Square-root-space Mean-Variance Scaling
ONDJ
-0.43
-0.75 to -0.13
18/24
0.0065
0.0194
0.3615
-0.57
✓
Power Transformation
Oct
-0.09
-0.51 to +0.35
15/24
0.3469
1.0000
1.0000
+0.30
—
Power Transformation
Nov
+0.05
-0.13 to +0.24
14/24
0.6841
1.0000
1.0000
-0.16
—
Power Transformation
Dec
+0.06
-0.03 to +0.14
6/24
0.9187
1.0000
1.0000
+0.14
—
Power Transformation
Jan
-0.13
-0.36 to +0.10
12/24
0.1317
0.6587
1.0000
-0.34
—
Power Transformation
ONDJ
-0.03
-0.67 to +0.65
15/24
0.4663
1.0000
1.0000
-0.50
—
Delta Change
Oct
-0.68
-1.60 to +0.18
14/24
0.0811
0.3792
1.0000
+0.94
—
Delta Change
Nov
-0.02
-0.57 to +0.50
11/24
0.4777
1.0000
1.0000
+0.95
—
Delta Change
Dec
+0.02
-0.17 to +0.23
11/24
0.5728
1.0000
1.0000
-0.07
—
Delta Change
Jan
-0.01
-0.47 to +0.41
10/24
0.4892
1.0000
1.0000
-0.19
—
Delta Change
ONDJ
-1.04
-2.38 to +0.34
16/24
0.0758
0.3792
1.0000
+3.22
—
Local Intensity Scaling
Oct
+0.42
-0.39 to +1.29
11/24
0.8166
1.0000
1.0000
+0.23
—
Local Intensity Scaling
Nov
+0.10
-0.07 to +0.26
9/24
0.8616
1.0000
1.0000
+0.57
—
Local Intensity Scaling
Dec
+0.14
-0.00 to +0.27
6/24
0.9646
1.0000
1.0000
+0.22
—
Local Intensity Scaling
Jan
+0.32
-0.20 to +0.82
9/24
0.8749
1.0000
1.0000
+0.15
—
Local Intensity Scaling
ONDJ
+0.01
-1.30 to +1.29
14/24
0.5070
1.0000
1.0000
+2.39
—
Empirical Quantile Mapping
Oct
+0.32
-0.20 to +0.83
11/24
0.8782
1.0000
1.0000
+0.81
—
Empirical Quantile Mapping
Nov
+0.19
-0.17 to +0.57
13/24
0.8269
1.0000
1.0000
-0.01
—
Empirical Quantile Mapping
Dec
-0.03
-0.18 to +0.12
11/24
0.3358
1.0000
1.0000
-0.09
—
Empirical Quantile Mapping
Jan
-0.34
-0.61 to -0.08
13/24
0.0117
0.0583
0.6294
-0.74
—
Empirical Quantile Mapping
ONDJ
+0.78
-0.35 to +2.06
14/24
0.8665
1.0000
1.0000
+0.49
—
Gamma Quantile Mapping
Oct
-0.26
-0.59 to +0.06
15/24
0.0654
0.1961
1.0000
-0.01
—
Gamma Quantile Mapping
Nov
-0.06
-0.23 to +0.11
13/24
0.2370
0.4741
1.0000
-0.16
—
Gamma Quantile Mapping
Dec
-0.02
-0.06 to +0.03
15/24
0.2769
0.4741
1.0000
+0.02
—
Gamma Quantile Mapping
Jan
-0.36
-0.54 to -0.20
19/24
0.0001
0.0007
0.0084
-0.53
✓✓
Gamma Quantile Mapping
ONDJ
-0.52
-0.92 to -0.14
18/24
0.0074
0.0297
0.4087
-0.71
✓
Detrended Quantile Mapping
Oct
-0.20
-0.89 to +0.46
15/24
0.2844
1.0000
1.0000
+0.75
—
Detrended Quantile Mapping
Nov
+0.18
-0.16 to +0.54
12/24
0.8360
1.0000
1.0000
+0.98
—
Detrended Quantile Mapping
Dec
+0.22
+0.04 to +0.41
8/24
0.9855
1.0000
1.0000
+0.04
—
Detrended Quantile Mapping
Jan
+0.10
-0.52 to +0.64
9/24
0.6134
1.0000
1.0000
-0.06
—
Detrended Quantile Mapping
ONDJ
-0.09
-1.12 to +1.02
15/24
0.4402
1.0000
1.0000
+3.18
—
Quantile Delta Mapping
Oct
-0.36
-1.09 to +0.35
15/24
0.1796
0.8980
1.0000
+0.70
—
Quantile Delta Mapping
Nov
+0.15
-0.14 to +0.46
11/24
0.8314
1.0000
1.0000
+0.81
—
Quantile Delta Mapping
Dec
+0.11
-0.08 to +0.32
9/24
0.8063
1.0000
1.0000
+0.05
—
Quantile Delta Mapping
Jan
-0.12
-0.63 to +0.35
10/24
0.3274
1.0000
1.0000
-0.44
—
Quantile Delta Mapping
ONDJ
-0.22
-1.08 to +0.74
16/24
0.3346
1.0000
1.0000
+3.06
—
Scaled Distribution Mapping
Oct
+0.00
-1.17 to +1.28
14/24
0.4989
1.0000
1.0000
+1.03
—
Scaled Distribution Mapping
Nov
+0.32
-0.34 to +1.07
14/24
0.7986
1.0000
1.0000
+1.29
—
Scaled Distribution Mapping
Dec
+0.36
-0.12 to +0.84
10/24
0.9165
1.0000
1.0000
+0.10
—
Scaled Distribution Mapping
Jan
+0.98
+0.21 to +1.73
11/24
0.9887
1.0000
1.0000
+0.43
—
Scaled Distribution Mapping
ONDJ
+0.40
-1.01 to +2.02
15/24
0.6768
1.0000
1.0000
+3.53
—
CDF-transform
Oct
-0.10
-0.87 to +0.68
14/24
0.4051
1.0000
1.0000
+0.87
—
CDF-transform
Nov
+0.23
-0.06 to +0.54
11/24
0.9163
1.0000
1.0000
+0.89
—
CDF-transform
Dec
+0.35
+0.13 to +0.59
6/24
0.9984
1.0000
1.0000
+0.30
—
CDF-transform
Jan
+0.35
-0.35 to +0.96
6/24
0.8347
1.0000
1.0000
+0.30
—
CDF-transform
ONDJ
-0.18
-1.16 to +0.87
16/24
0.3736
1.0000
1.0000
+3.04
—
MVS with all-zero guard (variant)
Oct
+0.00
+0.00 to +0.00
0/24
1.0000
1.0000
— (variant)
+0.00
—
MVS with all-zero guard (variant)
Nov
+0.00
+0.00 to +0.00
0/24
1.0000
1.0000
— (variant)
+0.00
—
MVS with all-zero guard (variant)
Dec
+0.00
+0.00 to +0.00
0/24
1.0000
1.0000
— (variant)
+0.00
—
MVS with all-zero guard (variant)
Jan
+0.00
+0.00 to +0.00
0/24
1.0000
1.0000
— (variant)
+0.00
—
MVS with all-zero guard (variant)
ONDJ
+0.00
+0.00 to +0.00
0/24
1.0000
1.0000
— (variant)
+0.00
—
Screening statistics, fair CRPS (method minus Mean-Variance Scaling; negative favours the method)
Method
Target
Δ fair CRPS 1993–2016 (mm)
95% interval
Years better
p (one-sided)
Holm p (method)
Holm p (all 60)
Δ 2017–2024
Screening
Linear Scaling
Oct
+0.63
-0.16 to +1.48
9/24
0.9187
1.0000
1.0000
+0.26
—
Linear Scaling
Nov
+0.25
+0.06 to +0.43
5/24
0.9906
1.0000
1.0000
+0.79
—
Linear Scaling
Dec
+0.21
+0.06 to +0.35
7/24
0.9912
1.0000
1.0000
+0.36
—
Linear Scaling
Jan
+0.30
-0.28 to +0.82
9/24
0.8356
1.0000
1.0000
+0.34
—
Linear Scaling
ONDJ
+0.27
-0.98 to +1.49
13/24
0.6583
1.0000
1.0000
+2.51
—
Variance Scaling (unbounded)
Oct
+0.04
-0.06 to +0.14
9/24
0.7881
1.0000
1.0000
+0.07
—
Variance Scaling (unbounded)
Nov
+0.04
+0.01 to +0.07
9/24
0.9911
1.0000
1.0000
-0.02
—
Variance Scaling (unbounded)
Dec
-0.03
-0.06 to +0.01
15/24
0.0766
0.3064
1.0000
-0.01
—
Variance Scaling (unbounded)
Jan
-0.26
-0.39 to -0.14
18/24
0.0006
0.0029
0.0339
-0.35
✓✓
Variance Scaling (unbounded)
ONDJ
+0.27
-0.02 to +0.60
7/24
0.9504
1.0000
1.0000
-0.22
—
Square-root-space Mean-Variance Scaling
Oct
-0.21
-0.46 to +0.05
15/24
0.0689
0.1378
1.0000
-0.00
—
Square-root-space Mean-Variance Scaling
Nov
-0.07
-0.20 to +0.07
16/24
0.1659
0.1659
1.0000
-0.09
—
Square-root-space Mean-Variance Scaling
Dec
-0.07
-0.11 to -0.02
20/24
0.0055
0.0219
0.3063
-0.03
✓
Square-root-space Mean-Variance Scaling
Jan
-0.54
-0.78 to -0.31
20/24
0.0001
0.0003
0.0029
-0.72
✓✓
Square-root-space Mean-Variance Scaling
ONDJ
-0.37
-0.69 to -0.06
18/24
0.0163
0.0489
0.8962
-0.54
✓
Power Transformation
Oct
-0.09
-0.51 to +0.35
15/24
0.3515
1.0000
1.0000
+0.30
—
Power Transformation
Nov
+0.04
-0.13 to +0.23
14/24
0.6662
1.0000
1.0000
-0.17
—
Power Transformation
Dec
+0.04
-0.04 to +0.12
7/24
0.8435
1.0000
1.0000
+0.13
—
Power Transformation
Jan
-0.20
-0.43 to +0.02
14/24
0.0468
0.2342
1.0000
-0.38
—
Power Transformation
ONDJ
-0.04
-0.67 to +0.61
15/24
0.4455
1.0000
1.0000
-0.51
—
Delta Change
Oct
-0.88
-1.82 to -0.02
14/24
0.0363
0.1807
1.0000
+0.31
—
Delta Change
Nov
-0.13
-0.69 to +0.39
12/24
0.3266
0.9797
1.0000
+0.52
—
Delta Change
Dec
-0.03
-0.21 to +0.17
13/24
0.3855
0.9797
1.0000
-0.22
—
Delta Change
Jan
-0.09
-0.56 to +0.33
11/24
0.3514
0.9797
1.0000
-0.33
—
Delta Change
ONDJ
-1.34
-2.71 to +0.06
16/24
0.0361
0.1807
1.0000
+2.26
—
Local Intensity Scaling
Oct
+0.63
-0.17 to +1.50
11/24
0.9186
1.0000
1.0000
+0.33
—
Local Intensity Scaling
Nov
+0.13
-0.04 to +0.29
9/24
0.9266
1.0000
1.0000
+0.58
—
Local Intensity Scaling
Dec
+0.10
-0.04 to +0.23
7/24
0.9037
1.0000
1.0000
+0.20
—
Local Intensity Scaling
Jan
+0.18
-0.35 to +0.68
11/24
0.7412
1.0000
1.0000
+0.09
—
Local Intensity Scaling
ONDJ
+0.31
-0.99 to +1.56
13/24
0.6724
1.0000
1.0000
+2.54
—
Empirical Quantile Mapping
Oct
+0.33
-0.20 to +0.84
11/24
0.8836
1.0000
1.0000
+0.82
—
Empirical Quantile Mapping
Nov
+0.20
-0.16 to +0.58
13/24
0.8435
1.0000
1.0000
-0.00
—
Empirical Quantile Mapping
Dec
-0.03
-0.17 to +0.12
12/24
0.3440
1.0000
1.0000
-0.09
—
Empirical Quantile Mapping
Jan
-0.39
-0.66 to -0.13
14/24
0.0047
0.0237
0.2702
-0.76
✓
Empirical Quantile Mapping
ONDJ
+0.87
-0.25 to +2.16
12/24
0.8950
1.0000
1.0000
+0.53
—
Gamma Quantile Mapping
Oct
-0.24
-0.57 to +0.09
14/24
0.0911
0.2733
1.0000
+0.01
—
Gamma Quantile Mapping
Nov
-0.03
-0.20 to +0.14
12/24
0.3567
0.7133
1.0000
-0.14
—
Gamma Quantile Mapping
Dec
-0.01
-0.05 to +0.04
14/24
0.3842
0.7133
1.0000
+0.02
—
Gamma Quantile Mapping
Jan
-0.41
-0.58 to -0.25
21/24
0.0000
0.0001
0.0009
-0.55
✓✓
Gamma Quantile Mapping
ONDJ
-0.44
-0.85 to -0.05
18/24
0.0222
0.0889
1.0000
-0.67
—
Detrended Quantile Mapping
Oct
-0.21
-0.90 to +0.45
15/24
0.2742
1.0000
1.0000
+0.75
—
Detrended Quantile Mapping
Nov
+0.18
-0.16 to +0.54
12/24
0.8378
1.0000
1.0000
+0.98
—
Detrended Quantile Mapping
Dec
+0.21
+0.04 to +0.40
8/24
0.9834
1.0000
1.0000
+0.04
—
Detrended Quantile Mapping
Jan
+0.04
-0.59 to +0.58
9/24
0.5430
1.0000
1.0000
-0.08
—
Detrended Quantile Mapping
ONDJ
-0.01
-1.05 to +1.11
15/24
0.4933
1.0000
1.0000
+3.22
—
Quantile Delta Mapping
Oct
-0.40
-1.14 to +0.32
15/24
0.1534
0.7671
1.0000
+0.70
—
Quantile Delta Mapping
Nov
+0.14
-0.15 to +0.45
11/24
0.8109
1.0000
1.0000
+0.81
—
Quantile Delta Mapping
Dec
+0.09
-0.10 to +0.31
11/24
0.7625
1.0000
1.0000
+0.05
—
Quantile Delta Mapping
Jan
-0.20
-0.72 to +0.27
11/24
0.2326
0.9305
1.0000
-0.47
—
Quantile Delta Mapping
ONDJ
-0.22
-1.09 to +0.74
16/24
0.3323
0.9969
1.0000
+3.08
—
Scaled Distribution Mapping
Oct
+0.11
-1.06 to +1.39
13/24
0.5643
1.0000
1.0000
+1.08
—
Scaled Distribution Mapping
Nov
+0.43
-0.24 to +1.17
12/24
0.8633
1.0000
1.0000
+1.33
—
Scaled Distribution Mapping
Dec
+0.41
-0.07 to +0.89
9/24
0.9405
1.0000
1.0000
+0.12
—
Scaled Distribution Mapping
Jan
+0.97
+0.20 to +1.72
11/24
0.9881
1.0000
1.0000
+0.42
—
Scaled Distribution Mapping
ONDJ
+0.62
-0.78 to +2.23
15/24
0.7620
1.0000
1.0000
+3.62
—
CDF-transform
Oct
-0.01
-0.78 to +0.76
14/24
0.4878
1.0000
1.0000
+0.90
—
CDF-transform
Nov
+0.27
-0.03 to +0.59
11/24
0.9433
1.0000
1.0000
+0.90
—
CDF-transform
Dec
+0.34
+0.13 to +0.59
7/24
0.9984
1.0000
1.0000
+0.30
—
CDF-transform
Jan
+0.28
-0.42 to +0.89
7/24
0.7809
1.0000
1.0000
+0.27
—
CDF-transform
ONDJ
+0.04
-0.93 to +1.10
15/24
0.5277
1.0000
1.0000
+3.13
—
MVS with all-zero guard (variant)
Oct
+0.00
+0.00 to +0.00
0/24
1.0000
1.0000
— (variant)
+0.00
—
MVS with all-zero guard (variant)
Nov
+0.00
+0.00 to +0.00
0/24
1.0000
1.0000
— (variant)
+0.00
—
MVS with all-zero guard (variant)
Dec
+0.00
+0.00 to +0.00
0/24
1.0000
1.0000
— (variant)
+0.00
—
MVS with all-zero guard (variant)
Jan
+0.00
+0.00 to +0.00
0/24
1.0000
1.0000
— (variant)
+0.00
—
MVS with all-zero guard (variant)
ONDJ
+0.00
+0.00 to +0.00
0/24
1.0000
1.0000
— (variant)
+0.00
—
Screening statistics, RPS (no blend) (method minus Mean-Variance Scaling; negative favours the method)
Method
Target
Δ RPS (no blend) 1993–2016
95% interval
Years better
p (one-sided)
Holm p (method)
Holm p (all 60)
Δ 2017–2024
Screening
Linear Scaling
Oct
+0.0109
-0.0080 to +0.0289
9/24
0.8667
1.0000
1.0000
-0.0219
—
Linear Scaling
Nov
+0.0043
-0.0098 to +0.0183
10/24
0.7164
1.0000
1.0000
+0.0150
—
Linear Scaling
Dec
+0.0056
-0.0219 to +0.0318
9/24
0.6546
1.0000
1.0000
-0.0096
—
Linear Scaling
Jan
-0.0315
-0.1398 to +0.0731
10/24
0.2926
1.0000
1.0000
-0.1296
—
Linear Scaling
ONDJ
+0.0048
-0.0056 to +0.0156
12/24
0.8009
1.0000
1.0000
+0.0033
—
Variance Scaling (unbounded)
Oct
+0.0001
-0.0013 to +0.0013
9/24
0.5294
0.9337
1.0000
+0.0014
—
Variance Scaling (unbounded)
Nov
-0.0006
-0.0015 to +0.0003
13/24
0.1050
0.4199
1.0000
-0.0013
—
Variance Scaling (unbounded)
Dec
-0.0035
-0.0087 to +0.0018
15/24
0.1094
0.4199
1.0000
-0.0030
—
Variance Scaling (unbounded)
Jan
-0.0168
-0.0268 to -0.0066
16/24
0.0029
0.0143
0.1568
-0.0356
✓
Variance Scaling (unbounded)
ONDJ
-0.0001
-0.0022 to +0.0019
8/24
0.4668
0.9337
1.0000
+0.0005
—
Square-root-space Mean-Variance Scaling
Oct
-0.0015
-0.0046 to +0.0015
12/24
0.1727
0.2718
1.0000
-0.0028
—
Square-root-space Mean-Variance Scaling
Nov
-0.0071
-0.0106 to -0.0039
19/24
0.0002
0.0009
0.0128
-0.0077
✓✓
Square-root-space Mean-Variance Scaling
Dec
-0.0170
-0.0313 to -0.0039
15/24
0.0121
0.0363
0.6531
-0.0070
✓
Square-root-space Mean-Variance Scaling
Jan
-0.0890
-0.1345 to -0.0459
18/24
0.0002
0.0008
0.0097
-0.1581
✓✓
Square-root-space Mean-Variance Scaling
ONDJ
-0.0014
-0.0037 to +0.0010
13/24
0.1359
0.2718
1.0000
-0.0036
—
Power Transformation
Oct
+0.0022
-0.0045 to +0.0086
9/24
0.7383
1.0000
1.0000
+0.0020
—
Power Transformation
Nov
-0.0002
-0.0047 to +0.0044
11/24
0.4697
1.0000
1.0000
-0.0043
—
Power Transformation
Dec
-0.0086
-0.0192 to +0.0013
14/24
0.0637
0.2546
1.0000
-0.0106
—
Power Transformation
Jan
-0.0756
-0.1179 to -0.0359
17/24
0.0004
0.0022
0.0254
-0.1404
✓✓
Power Transformation
ONDJ
-0.0001
-0.0080 to +0.0080
13/24
0.4871
1.0000
1.0000
+0.0000
—
Delta Change
Oct
-0.0027
-0.0215 to +0.0154
12/24
0.3906
1.0000
1.0000
+0.0149
—
Delta Change
Nov
-0.0000
-0.0222 to +0.0210
10/24
0.4979
1.0000
1.0000
+0.0294
—
Delta Change
Dec
+0.0389
+0.0008 to +0.0791
8/24
0.9661
1.0000
1.0000
+0.0056
—
Delta Change
Jan
+0.0006
-0.0759 to +0.0710
8/24
0.5058
1.0000
1.0000
-0.1111
—
Delta Change
ONDJ
+0.0032
-0.0143 to +0.0200
10/24
0.6366
1.0000
1.0000
+0.0245
—
Local Intensity Scaling
Oct
+0.0088
-0.0045 to +0.0215
9/24
0.8941
1.0000
1.0000
-0.0110
—
Local Intensity Scaling
Nov
-0.0015
-0.0125 to +0.0092
10/24
0.3979
1.0000
1.0000
+0.0185
—
Local Intensity Scaling
Dec
+0.0185
-0.0221 to +0.0569
9/24
0.8074
1.0000
1.0000
-0.0057
—
Local Intensity Scaling
Jan
-0.0273
-0.1362 to +0.0798
10/24
0.3191
1.0000
1.0000
-0.1266
—
Local Intensity Scaling
ONDJ
+0.0050
-0.0058 to +0.0162
12/24
0.8044
1.0000
1.0000
+0.0033
—
Empirical Quantile Mapping
Oct
+0.0065
-0.0061 to +0.0192
12/24
0.8336
1.0000
1.0000
+0.0226
—
Empirical Quantile Mapping
Nov
-0.0007
-0.0126 to +0.0106
11/24
0.4502
1.0000
1.0000
+0.0080
—
Empirical Quantile Mapping
Dec
-0.0011
-0.0290 to +0.0265
10/24
0.4704
1.0000
1.0000
-0.0160
—
Empirical Quantile Mapping
Jan
-0.0920
-0.1479 to -0.0393
16/24
0.0022
0.0109
0.1215
-0.1762
✓
Empirical Quantile Mapping
ONDJ
+0.0047
-0.0048 to +0.0146
12/24
0.8196
1.0000
1.0000
+0.0072
—
Gamma Quantile Mapping
Oct
-0.0010
-0.0071 to +0.0049
13/24
0.3697
0.7395
1.0000
+0.0057
—
Gamma Quantile Mapping
Nov
-0.0035
-0.0107 to +0.0030
11/24
0.1715
0.6859
1.0000
-0.0041
—
Gamma Quantile Mapping
Dec
+0.0195
+0.0047 to +0.0351
8/24
0.9894
0.9894
1.0000
+0.0402
—
Gamma Quantile Mapping
Jan
-0.0794
-0.1078 to -0.0523
22/24
0.0000
0.0000
0.0000
-0.1294
✓✓
Gamma Quantile Mapping
ONDJ
-0.0014
-0.0045 to +0.0017
13/24
0.1926
0.6859
1.0000
-0.0049
—
Detrended Quantile Mapping
Oct
+0.0050
-0.0072 to +0.0169
12/24
0.7830
1.0000
1.0000
+0.0171
—
Detrended Quantile Mapping
Nov
+0.0060
-0.0094 to +0.0214
9/24
0.7698
1.0000
1.0000
+0.0271
—
Detrended Quantile Mapping
Dec
+0.0548
+0.0168 to +0.0917
6/24
0.9949
1.0000
1.0000
+0.0172
—
Detrended Quantile Mapping
Jan
-0.0011
-0.0787 to +0.0705
8/24
0.4885
1.0000
1.0000
-0.1118
—
Detrended Quantile Mapping
ONDJ
+0.0113
+0.0026 to +0.0204
9/24
0.9874
1.0000
1.0000
+0.0187
—
Quantile Delta Mapping
Oct
+0.0027
-0.0099 to +0.0151
12/24
0.6596
1.0000
1.0000
+0.0129
—
Quantile Delta Mapping
Nov
+0.0109
-0.0027 to +0.0242
7/24
0.9320
1.0000
1.0000
+0.0231
—
Quantile Delta Mapping
Dec
+0.0218
-0.0128 to +0.0559
9/24
0.8812
1.0000
1.0000
-0.0104
—
Quantile Delta Mapping
Jan
-0.0632
-0.1330 to +0.0038
12/24
0.0487
0.2434
1.0000
-0.1719
—
Quantile Delta Mapping
ONDJ
+0.0121
+0.0034 to +0.0209
7/24
0.9931
1.0000
1.0000
+0.0208
—
Scaled Distribution Mapping
Oct
+0.0075
-0.0090 to +0.0241
13/24
0.8035
1.0000
1.0000
+0.0193
—
Scaled Distribution Mapping
Nov
+0.0116
-0.0137 to +0.0371
9/24
0.8078
1.0000
1.0000
+0.0481
—
Scaled Distribution Mapping
Dec
+0.0563
-0.0121 to +0.1223
8/24
0.9386
1.0000
1.0000
+0.0181
—
Scaled Distribution Mapping
Jan
+0.0489
-0.0850 to +0.1802
9/24
0.7543
1.0000
1.0000
-0.0774
—
Scaled Distribution Mapping
ONDJ
+0.0185
+0.0070 to +0.0301
8/24
0.9973
1.0000
1.0000
+0.0250
—
CDF-transform
Oct
+0.0078
-0.0023 to +0.0179
8/24
0.9235
1.0000
1.0000
+0.0110
—
CDF-transform
Nov
+0.0155
+0.0032 to +0.0279
6/24
0.9883
1.0000
1.0000
+0.0220
—
CDF-transform
Dec
+0.0786
+0.0382 to +0.1216
7/24
0.9995
1.0000
1.0000
+0.0325
—
CDF-transform
Jan
+0.0188
-0.0635 to +0.0931
8/24
0.6745
1.0000
1.0000
-0.1226
—
CDF-transform
ONDJ
+0.0110
+0.0038 to +0.0183
6/24
0.9959
1.0000
1.0000
+0.0165
—
MVS with all-zero guard (variant)
Oct
+0.0000
+0.0000 to +0.0000
0/24
1.0000
1.0000
— (variant)
+0.0000
—
MVS with all-zero guard (variant)
Nov
+0.0000
+0.0000 to +0.0000
0/24
1.0000
1.0000
— (variant)
+0.0000
—
MVS with all-zero guard (variant)
Dec
+0.0000
+0.0000 to +0.0000
0/24
1.0000
1.0000
— (variant)
+0.0000
—
MVS with all-zero guard (variant)
Jan
+0.0000
+0.0000 to +0.0000
0/24
1.0000
1.0000
— (variant)
+0.0000
—
MVS with all-zero guard (variant)
ONDJ
+0.0000
+0.0000 to +0.0000
0/24
1.0000
1.0000
— (variant)
+0.0000
—
How often limits, caps and fallbacks act
How often limits, caps and fallbacks act, leave-one-year-out 1993–2016 (mean over folds)
Method
Target
Activated (share of the corrected area, or of members / cells for events)
Linear Scaling
Dec
mean fallback: 0.4% of the area
Linear Scaling
Jan
mean fallback: 2.8% of the area
Mean-Variance Scaling (operational)
Oct
ratio lower limit: 0.9% of the area; ratio upper limit: 11.8% of the area; clipped at zero: 6.5%
Mean-Variance Scaling (operational)
Nov
ratio lower limit: 5.2% of the area; ratio upper limit: 9.4% of the area; clipped at zero: 8.0%
Mean-Variance Scaling (operational)
Dec
sd fallback: 1.3% of the area; ratio lower limit: 17.3% of the area; ratio upper limit: 5.8% of the area; clipped at zero: 12.2%
Mean-Variance Scaling (operational)
Jan
sd fallback: 3.9% of the area; ratio lower limit: 25.8% of the area; ratio upper limit: 28.2% of the area; clipped at zero: 4.5%
Mean-Variance Scaling (operational)
ONDJ
ratio lower limit: 2.2% of the area; ratio upper limit: 22.3% of the area; clipped at zero: 1.7%
Variance Scaling (unbounded)
Oct
clipped at zero: 6.8%
Variance Scaling (unbounded)
Nov
clipped at zero: 8.2%
Variance Scaling (unbounded)
Dec
sd fallback: 1.3% of the area; clipped at zero: 8.9%
Variance Scaling (unbounded)
Jan
sd fallback: 3.9% of the area; clipped at zero: 1.8%
Variance Scaling (unbounded)
ONDJ
clipped at zero: 2.2%
Square-root-space Mean-Variance Scaling
Oct
ratio upper limit: 0.4% of the area; clipped at zero: 1.5%
Square-root-space Mean-Variance Scaling
Nov
ratio lower limit: 0.3% of the area; clipped at zero: 2.3%
Square-root-space Mean-Variance Scaling
Dec
ratio lower limit: 14.0% of the area; clipped at zero: 2.9%
Square-root-space Mean-Variance Scaling
Jan
ratio lower limit: 30.9% of the area; ratio upper limit: 0.3% of the area; clipped at zero: 1.0%
Square-root-space Mean-Variance Scaling
ONDJ
ratio lower limit: 0.0% of the area; ratio upper limit: 1.8% of the area; clipped at zero: 0.0%
Power Transformation
Dec
b at bound: 1.7% of the area
Power Transformation
Jan
b at bound: 23.3% of the area
Delta Change
Dec
mean fallback: 0.4% of the area; ratio capped: 0.1%
Delta Change
Jan
mean fallback: 2.8% of the area; ratio capped: 1.1%
Local Intensity Scaling
Oct
always wet: 91.6% of the area
Local Intensity Scaling
Nov
always wet: 78.9% of the area
Local Intensity Scaling
Dec
always wet: 73.6% of the area; never wet: 2.9% of the area
Local Intensity Scaling
Jan
always wet: 80.2% of the area; never wet: 9.2% of the area
Local Intensity Scaling
ONDJ
always wet: 100.0% of the area
Empirical Quantile Mapping
Oct
model has dry: 25.2% of the area; obs has dry: 8.4% of the area; extrapolated: 0.3%
Empirical Quantile Mapping
Nov
model has dry: 86.0% of the area; obs has dry: 21.1% of the area; extrapolated: 0.2%
Empirical Quantile Mapping
Dec
model has dry: 98.9% of the area; obs has dry: 26.4% of the area; extrapolated: 0.2%
Empirical Quantile Mapping
Jan
model has dry: 100.0% of the area; obs has dry: 19.8% of the area; extrapolated: 0.2%
Empirical Quantile Mapping
ONDJ
model has dry: 1.6% of the area; extrapolated: 0.4%
Gamma Quantile Mapping
Oct
model has dry: 25.2% of the area; obs has dry: 8.4% of the area
Gamma Quantile Mapping
Nov
model has dry: 86.0% of the area; obs has dry: 21.1% of the area
Gamma Quantile Mapping
Dec
gamma fallback: 2.7% of the area; model has dry: 98.9% of the area; obs has dry: 26.4% of the area
Gamma Quantile Mapping
Jan
gamma fallback: 4.5% of the area; model has dry: 100.0% of the area; obs has dry: 19.8% of the area
Gamma Quantile Mapping
ONDJ
model has dry: 1.6% of the area
Detrended Quantile Mapping
Oct
model has dry: 25.2% of the area; obs has dry: 8.4% of the area; extrapolated: 0.2%
Detrended Quantile Mapping
Nov
model has dry: 86.0% of the area; obs has dry: 21.1% of the area; extrapolated: 0.1%
Detrended Quantile Mapping
Dec
model has dry: 98.9% of the area; obs has dry: 26.4% of the area; ratio capped: 0.1%; extrapolated: 0.1%
Detrended Quantile Mapping
Jan
model has dry: 100.0% of the area; obs has dry: 19.8% of the area; ratio capped: 1.1%; extrapolated: 0.1%
Detrended Quantile Mapping
ONDJ
model has dry: 1.6% of the area; extrapolated: 0.2%
Quantile Delta Mapping
Oct
model has dry: 25.2% of the area; obs has dry: 8.4% of the area; low denominator: 0.6%; ratio capped: 0.0%
Quantile Delta Mapping
Nov
model has dry: 86.0% of the area; obs has dry: 21.1% of the area; low denominator: 7.9%; ratio capped: 0.3%
Quantile Delta Mapping
Dec
model has dry: 98.9% of the area; obs has dry: 26.4% of the area; low denominator: 31.5%; ratio capped: 0.4%
Quantile Delta Mapping
Jan
model has dry: 100.0% of the area; obs has dry: 19.8% of the area; low denominator: 54.4%; ratio capped: 0.2%
Quantile Delta Mapping
ONDJ
model has dry: 1.6% of the area; ratio capped: 0.0%
Scaled Distribution Mapping
Dec
gamma fallback: 5.5% of the area; linear scaling fallback: 5.9%
Scaled Distribution Mapping
Jan
gamma fallback: 13.7% of the area; linear scaling fallback: 23.4%
CDF-transform
Oct
at forecast range edge: 13.9%
CDF-transform
Nov
at forecast range edge: 7.1%
CDF-transform
Dec
mean fallback: 0.4% of the area; at forecast range edge: 2.2%
CDF-transform
Jan
mean fallback: 2.8% of the area; at forecast range edge: 0.6%
CDF-transform
ONDJ
at forecast range edge: 9.5%
MVS with all-zero guard (variant)
Oct
ratio lower limit: 0.9% of the area; ratio upper limit: 11.8% of the area; clipped at zero: 6.5%
MVS with all-zero guard (variant)
Nov
ratio lower limit: 5.2% of the area; ratio upper limit: 9.4% of the area; clipped at zero: 8.0%
MVS with all-zero guard (variant)
Dec
sd fallback: 1.3% of the area; ratio lower limit: 17.3% of the area; ratio upper limit: 5.8% of the area; clipped at zero: 12.2%
MVS with all-zero guard (variant)
Jan
sd fallback: 3.9% of the area; ratio lower limit: 25.8% of the area; ratio upper limit: 28.2% of the area; clipped at zero: 4.5%
MVS with all-zero guard (variant)
ONDJ
ratio lower limit: 2.2% of the area; ratio upper limit: 22.3% of the area; clipped at zero: 1.7%
Where the amount differences come from: cells grouped by their training-year climate
Each cell is grouped by its CHIRPS totals in the fold’s training years only: every year exactly 0 mm; every year ≤ 1 mm (not all 0); some years dry and some wet; never dry. Contributions are area-weighted CRPS differences from Mean-Variance Scaling (mm; negative favours the method) and add up to the national difference. Leave-one-year-out 1993–2016, All Ethiopia.
Oct: contributions to the CRPS difference from Mean-Variance Scaling (mm)
Method
Total Δ CRPS
all 0 mm 0.0% of area
all ≤ 1 mm 0.0% of area
mixed 8.4% of area
always wet 91.6% of area
Linear Scaling
+0.415
+0.000
+0.000
+0.034
+0.381
Variance Scaling (unbounded)
+0.067
+0.000
+0.000
+0.000
+0.067
Square-root-space Mean-Variance Scaling
-0.227
+0.000
+0.000
-0.014
-0.213
Power Transformation
-0.087
+0.000
+0.000
+0.005
-0.092
Delta Change
-0.677
+0.000
+0.000
-0.044
-0.634
Local Intensity Scaling
+0.417
+0.000
+0.000
-0.010
+0.427
Empirical Quantile Mapping
+0.318
+0.000
+0.000
+0.021
+0.298
Gamma Quantile Mapping
-0.263
+0.000
+0.000
-0.010
-0.253
Detrended Quantile Mapping
-0.204
+0.000
+0.000
-0.022
-0.182
Quantile Delta Mapping
-0.357
+0.000
+0.000
-0.037
-0.320
Scaled Distribution Mapping
+0.001
+0.000
+0.000
-0.023
+0.024
CDF-transform
-0.099
+0.000
+0.000
-0.016
-0.083
MVS with all-zero guard (variant)
+0.000
+0.000
+0.000
+0.000
+0.000
Nov: contributions to the CRPS difference from Mean-Variance Scaling (mm)
Method
Total Δ CRPS
all 0 mm 0.0% of area
all ≤ 1 mm 0.0% of area
mixed 21.1% of area
always wet 78.9% of area
Linear Scaling
+0.221
+0.000
+0.000
+0.088
+0.133
Variance Scaling (unbounded)
+0.046
+0.000
+0.000
+0.002
+0.044
Square-root-space Mean-Variance Scaling
-0.093
+0.000
+0.000
-0.020
-0.073
Power Transformation
+0.047
+0.000
+0.000
+0.026
+0.021
Delta Change
-0.016
+0.000
+0.000
+0.061
-0.077
Local Intensity Scaling
+0.095
+0.000
+0.000
-0.012
+0.107
Empirical Quantile Mapping
+0.186
+0.000
+0.000
+0.039
+0.146
Gamma Quantile Mapping
-0.065
+0.000
+0.000
-0.009
-0.055
Detrended Quantile Mapping
+0.182
+0.000
+0.000
+0.069
+0.113
Quantile Delta Mapping
+0.154
+0.000
+0.000
+0.062
+0.091
Scaled Distribution Mapping
+0.323
+0.000
+0.000
+0.068
+0.254
CDF-transform
+0.228
+0.000
+0.000
+0.069
+0.159
MVS with all-zero guard (variant)
+0.000
+0.000
+0.000
+0.000
+0.000
Dec: contributions to the CRPS difference from Mean-Variance Scaling (mm)
Method
Total Δ CRPS
all 0 mm 0.0% of area
all ≤ 1 mm 2.9% of area
mixed 23.6% of area
always wet 73.6% of area
Linear Scaling
+0.266
+0.000
-0.001
+0.002
+0.264
Variance Scaling (unbounded)
-0.022
+0.000
-0.001
-0.004
-0.017
Square-root-space Mean-Variance Scaling
-0.065
+0.000
-0.001
-0.014
-0.051
Power Transformation
+0.063
+0.000
-0.001
-0.013
+0.077
Delta Change
+0.019
+0.000
-0.001
-0.028
+0.048
Local Intensity Scaling
+0.136
+0.000
+0.001
+0.005
+0.130
Empirical Quantile Mapping
-0.033
+0.000
+0.001
+0.011
-0.044
Gamma Quantile Mapping
-0.015
+0.000
+0.001
+0.010
-0.026
Detrended Quantile Mapping
+0.218
+0.000
+0.001
+0.018
+0.199
Quantile Delta Mapping
+0.105
+0.000
+0.001
+0.007
+0.097
Scaled Distribution Mapping
+0.360
+0.000
-0.001
+0.006
+0.354
CDF-transform
+0.346
+0.000
-0.001
-0.006
+0.353
MVS with all-zero guard (variant)
+0.000
+0.000
+0.000
+0.000
+0.000
Jan: contributions to the CRPS difference from Mean-Variance Scaling (mm)
Method
Total Δ CRPS
all 0 mm 0.0% of area
all ≤ 1 mm 9.2% of area
mixed 10.6% of area
always wet 80.2% of area
Linear Scaling
+0.487
+0.000
+0.003
+0.003
+0.480
Variance Scaling (unbounded)
-0.240
+0.000
-0.005
-0.006
-0.229
Square-root-space Mean-Variance Scaling
-0.479
+0.000
-0.003
-0.018
-0.458
Power Transformation
-0.134
+0.000
+0.001
-0.004
-0.131
Delta Change
-0.005
+0.000
+0.001
-0.006
-0.001
Local Intensity Scaling
+0.325
+0.000
+0.010
+0.011
+0.303
Empirical Quantile Mapping
-0.337
+0.000
+0.010
+0.011
-0.359
Gamma Quantile Mapping
-0.365
+0.000
+0.010
+0.003
-0.378
Detrended Quantile Mapping
+0.100
+0.000
+0.010
+0.011
+0.079
Quantile Delta Mapping
-0.121
+0.000
+0.010
+0.012
-0.144
Scaled Distribution Mapping
+0.977
+0.000
+0.003
+0.027
+0.947
CDF-transform
+0.350
+0.000
+0.004
+0.003
+0.343
MVS with all-zero guard (variant)
+0.000
+0.000
+0.000
+0.000
+0.000
ONDJ: contributions to the CRPS difference from Mean-Variance Scaling (mm)
Method
Total Δ CRPS
all 0 mm 0.0% of area
all ≤ 1 mm 0.0% of area
mixed 0.0% of area
always wet 100.0% of area
Linear Scaling
-0.012
+0.000
+0.000
+0.000
-0.012
Variance Scaling (unbounded)
+0.336
+0.000
+0.000
+0.000
+0.336
Square-root-space Mean-Variance Scaling
-0.432
+0.000
+0.000
+0.000
-0.432
Power Transformation
-0.028
+0.000
+0.000
+0.000
-0.028
Delta Change
-1.044
+0.000
+0.000
+0.000
-1.044
Local Intensity Scaling
+0.014
+0.000
+0.000
+0.000
+0.014
Empirical Quantile Mapping
+0.779
+0.000
+0.000
+0.000
+0.779
Gamma Quantile Mapping
-0.524
+0.000
+0.000
+0.000
-0.524
Detrended Quantile Mapping
-0.086
+0.000
+0.000
+0.000
-0.086
Quantile Delta Mapping
-0.218
+0.000
+0.000
+0.000
-0.218
Scaled Distribution Mapping
+0.402
+0.000
+0.000
+0.000
+0.402
CDF-transform
-0.179
+0.000
+0.000
+0.000
-0.179
MVS with all-zero guard (variant)
+0.000
+0.000
+0.000
+0.000
+0.000
Confirmation: full pipeline and method selection
The screening isolates the amount correction. The confirmation evaluates what the site publishes: each method’s
corrected members go through the full probability pipeline (tercile counts, smoothing and the climatology blend), with every fit and
the blend weight inside the cross-validation folds. Two selection-aware procedures then choose a method for each
left-out year using only the other training years — SEL-P by the lowest inner blended RPS (probabilities),
SEL-A by the lowest inner CRPS (amounts) — so their scores include the effect of choosing among the
14 declared methods. ✓ = better than Mean-Variance Scaling with Holm-adjusted p < 0.05 (methods: across all
methods and targets; SEL-P/SEL-A: across the targets) and not worse over 2017–2024. Scope: All Ethiopia.
ONDJ season through the full pipeline (outer leave-one-year-out 1993–2016; test years exploratory)
Method
Blended RPSS 1993–2016
Blended RPSS 2017–2024
BSS below 1993–2016
BSS above 1993–2016
Amount CRPSS 1993–2016
Amount CRPSS 2017–2024
Mean blend weight λ
Mean-Variance Scaling (operational)
+0.039
+0.075
+0.028
+0.051
+0.070
+0.178
0.20
Linear Scaling
+0.037
+0.071
+0.018
+0.056
+0.070
+0.131
0.28
Variance Scaling (unbounded)
+0.039
+0.074
+0.029
+0.050
+0.063
+0.182
0.21
Square-root-space Mean-Variance Scaling
+0.040
+0.080
+0.030
+0.050
+0.080
+0.189
0.18
Power Transformation
+0.038
+0.075
+0.028
+0.049
+0.071
+0.188
0.19
Delta Change
+0.026
+0.029
+0.016
+0.035
+0.093
+0.114
0.23
Local Intensity Scaling
+0.037
+0.071
+0.018
+0.056
+0.070
+0.131
0.29
Empirical Quantile Mapping
+0.028
+0.062
+0.016
+0.040
+0.053
+0.168
0.22
Gamma Quantile Mapping
+0.041
+0.082
+0.031
+0.050
+0.082
+0.192
0.18
Detrended Quantile Mapping
+0.020
+0.045
+0.007
+0.032
+0.072
+0.115
0.32
Quantile Delta Mapping
+0.018
+0.041
+0.003
+0.033
+0.075
+0.118
0.31
Scaled Distribution Mapping
+0.015
+0.040
-0.000
+0.030
+0.061
+0.108
0.38
CDF-transform
+0.022
+0.049
+0.009
+0.036
+0.074
+0.118
0.32
MVS with all-zero guard (variant)
+0.039
+0.075
+0.028
+0.051
+0.070
+0.178
0.20
SEL-P
+0.040
+0.082
+0.030
+0.050
+0.081
+0.192
—
SEL-A
+0.026
+0.029
+0.016
+0.035
+0.093
+0.114
—
Blended tercile RPSS by target, outer leave-one-year-out 1993–2016
Method
Oct
Nov
Dec
Jan
ONDJ
Mean-Variance Scaling (operational)
+0.013
+0.040
+0.003
+0.001
+0.039
Linear Scaling
+0.013
+0.038
+0.006
-0.000
+0.037
Variance Scaling (unbounded)
+0.013
+0.041
+0.004
+0.001
+0.039
Square-root-space Mean-Variance Scaling
+0.014
+0.050
+0.007
+0.007
+0.040
Power Transformation
+0.012
+0.039
+0.005
+0.003
+0.038
Delta Change
+0.004
+0.035
-0.000
-0.006
+0.026
Local Intensity Scaling
+0.012
+0.043
+0.006
+0.001
+0.037
Empirical Quantile Mapping
+0.002
+0.034
+0.005
-0.003
+0.028
Gamma Quantile Mapping
+0.014
+0.044
+0.006
+0.005
+0.041
Detrended Quantile Mapping
+0.003
+0.028
+0.001
-0.006
+0.020
Quantile Delta Mapping
+0.004
+0.021
+0.006
-0.005
+0.018
Scaled Distribution Mapping
+0.004
+0.028
+0.006
-0.002
+0.015
CDF-transform
+0.005
+0.023
-0.001
-0.003
+0.022
MVS with all-zero guard (variant)
+0.013
+0.040
+0.003
+0.001
+0.039
SEL-P
+0.014
+0.050
+0.007
+0.007
+0.040
SEL-A
+0.004
+0.050
+0.002
+0.007
+0.026
Amount CRPSS by target in the confirmation design, and the selection-aware procedures
Amount CRPSS by target, outer leave-one-year-out 1993–2016
Method
Oct
Nov
Dec
Jan
ONDJ
Mean-Variance Scaling (operational)
-0.002
+0.084
+0.028
-0.048
+0.070
Linear Scaling
-0.016
+0.073
-0.008
-0.132
+0.070
Variance Scaling (unbounded)
-0.004
+0.082
+0.031
-0.007
+0.063
Square-root-space Mean-Variance Scaling
+0.006
+0.089
+0.037
+0.034 ✓
+0.080
Power Transformation
+0.001
+0.082
+0.020
-0.025
+0.071
Delta Change
+0.021
+0.085
+0.026
-0.047
+0.093
Local Intensity Scaling
-0.016
+0.079
+0.010
-0.104
+0.070
Empirical Quantile Mapping
-0.012
+0.075
+0.033
+0.010
+0.053
Gamma Quantile Mapping
+0.007
+0.088
+0.030
+0.015 ✓
+0.082
Detrended Quantile Mapping
+0.005
+0.075
-0.001
-0.065
+0.072
Quantile Delta Mapping
+0.010
+0.076
+0.014
-0.027
+0.075
Scaled Distribution Mapping
-0.002
+0.068
-0.021
-0.216
+0.061
CDF-transform
+0.002
+0.073
-0.019
-0.108
+0.074
MVS with all-zero guard (variant)
-0.002
+0.084
+0.028
-0.048
+0.070
SEL-P
+0.007
+0.089
+0.037
+0.034
+0.081
SEL-A
+0.021
+0.089
+0.034
+0.034 ✓
+0.093
Selection-aware procedures against the operational method (Δ: RPS for SEL-P, CRPS for SEL-A; negative favours the procedure)
The operational correction limits the spread ratio r = σobs/σmodel to 0.5–2. This study runs the same
screening and confirmation for that correction with wider limits (1/3–3, 1/4–4) and none, all with the same fallback (r = 1 where
the model spread is below 1 mm), to see whether the limits are worth changing. ✓ = better than the operational limits with
Holm-adjusted p < 0.05 across the 3 alternatives × 5 targets and not worse over the test years.
Run at commit fb7425f.
Confirmed better than the operational limits — published (blended) probabilities: none;
rainfall amounts: MVS, ratio limits 1/3-3 (Jan), MVS, ratio limits 1/4-4 (Jan) and Variance Scaling (unbounded) (Jan).
Blended tercile RPSS through the full pipeline, outer leave-one-year-out 1993–2016
Method
Oct
Nov
Dec
Jan
ONDJ
Mean-Variance Scaling (operational, 0.5–2)
+0.013
+0.040
+0.003
+0.001
+0.039
MVS, ratio limits 1/3-3
+0.013
+0.041
+0.004
+0.001
+0.039
MVS, ratio limits 1/4-4
+0.013
+0.041
+0.004
+0.001
+0.039
Variance Scaling (unbounded)
+0.013
+0.041
+0.004
+0.001
+0.039
Amount CRPSS, leave-one-year-out 1993–2016
Method
Oct
Nov
Dec
Jan
ONDJ
Mean-Variance Scaling (operational, 0.5–2)
-0.002
+0.084
+0.028
-0.048
+0.070
MVS, ratio limits 1/3-3
-0.004
+0.082
+0.031
-0.013 ✓
+0.063
MVS, ratio limits 1/4-4
-0.004
+0.082
+0.031
-0.008 ✓
+0.063
Variance Scaling (unbounded)
-0.004
+0.082
+0.031
-0.007 ✓
+0.063
Where the operational limits act
Share of the corrected area, mean over the leave-one-year-out folds, 1993–2016
Target
Lower limit active (r would be < 0.5)
Upper limit active (r would be > 2)
Spread–error, operational
Spread–error, no limits
Oct
1%
12%
0.90
0.93
Nov
5%
9%
1.01
1.02
Dec
17%
6%
0.96
1.00
Jan
26%
28%
0.83
1.00
ONDJ
2%
22%
0.96
1.01
Figures
Figures show the national aggregate (All Ethiopia) or per-cell maps of the whole country, whatever region is selected for the tables.
Interpretation — national aggregate (All Ethiopia)
All tested corrections improve national ONDJ rainfall-amount CRPSS over raw ECMWF in 1993–2016 (raw -0.180; corrected +0.053 to +0.093). Performance varies for monthly tercile probabilities: 3 method–month combinations score below the raw model on RPSS (Detrended Quantile Mapping in Dec, Scaled Distribution Mapping in Dec and CDF-transform in Dec).
Accounting for the whole search. With Holm adjustment across all 60 method–target comparisons, the amount (CRPS) screening passes are Square-root-space Mean-Variance Scaling (Jan) and Gamma Quantile Mapping (Jan), and the tercile (RPS) passes are Square-root-space Mean-Variance Scaling (Nov, Jan), Power Transformation (Jan) and Gamma Quantile Mapping (Jan). Within-method passes that do not survive this check: Empirical Quantile Mapping Jan, Gamma Quantile Mapping ONDJ, Square-root-space Mean-Variance Scaling Dec, Square-root-space Mean-Variance Scaling ONDJ and Variance Scaling (unbounded) Jan.
Square-root-space Mean-Variance Scaling is at least as good as Mean-Variance Scaling in the national aggregate for every tested target and period, on amounts and unblended terciles (ONDJ CRPSS +0.080 vs +0.070 in 1993–2016, +0.189 vs +0.178 in 2017–2024). Its ONDJ amount screening pass does not survive the family-wide correction. Members clipped to 0 mm in the months: 4.5%–12.2% with Mean-Variance Scaling, 1.0%–2.9% with this method. This need not hold in each region; see the tables for the ONDJ R3 (Deyr) domain.
The 0.5–2 limits of Mean-Variance Scaling matter most where the raw model is far too narrow (Jan). With the same 1 mm fallback in both, removing the limits is the only difference: there the upper limit is active over 28% of the area and Mean-Variance Scaling stays too narrow (spread–error 0.83), while the unbounded form reaches 1.00.
Empirical Quantile Mapping reproduces the CHIRPS distribution and, with the dry policy, its dry share (totals ≤ 1 mm: Dec 19.0% vs CHIRPS 18.9%; Jan 16.7% vs CHIRPS 16.6%); it passes the screening for Jan, but its ONDJ amount skill is lower than Mean-Variance Scaling (+0.053 vs +0.070). A possible explanation is sampling noise in an empirical quantile function built from 23 CHIRPS values per fold; the results do not isolate it.
Scaled Distribution Mapping follows the published algorithm (Switanek et al. 2017, steps 1–7; checked numerically against an independent implementation of the steps). Where the model is drier than CHIRPS it cannot add rain: in Jan 46% of model members exceed 1 mm against 83% of CHIRPS years, and SDM, by design, keeps the model’s number of rain members, so its corrected dry share is 55% (CHIRPS 17%).
Delta Change has a high ONDJ CRPSS in 1993–2016 (+0.093) but the gain does not pass the screening (Holm p = 0.38), it is lower in 2017–2024 (+0.114 vs +0.178), its ensemble is too wide (spread–error 1.16) and its tercile skill is low. It is the CHIRPS climatology rescaled by the forecast’s mean: historical scenarios, not corrected members.
The methods that use the forecast’s own distribution (Detrended Quantile Mapping, Quantile Delta Mapping, Scaled Distribution Mapping, CDF-transform) score lower on ONDJ terciles (-0.005 to +0.011 vs +0.035) and none passes the season screening. A possible explanation is that the distribution of a single forecast’s 25–51 members is a noisy estimate of the “future” distribution these methods were designed for; the results do not isolate the cause. Where model quantiles are dry, QDM falls back to the CHIRPS quantile (members affected: Dec 32% and Jan 54%), so its quantile changes are only partly preserved.
Linear Scaling and Local Intensity Scaling correct the mean only (LOCI nearly so for totals that are always wet), so the ensemble stays too narrow (spread–error 0.78 and 0.77 for ONDJ).
Dec remains hard: every method has negative amount skill over 2017–2024.
No tested method demonstrates a statistically significant improvement over Mean-Variance Scaling for the published tercile probabilities under this validation protocol, although several have slightly higher point estimates. Choosing the method each year from training-only scores, the probability procedure (SEL-P) scores ONDJ blended RPSS +0.040 against +0.039, confirmed for none. Amounts: the amount procedure (SEL-A) scores CRPSS +0.093 against +0.070, confirmed for Jan; fixed methods confirmed against the family of all declared methods and targets: Square-root-space Mean-Variance Scaling (Jan) and Gamma Quantile Mapping (Jan).
The climatology blend narrows the differences. Across the methods, ONDJ RPSS (1993–2016) spans 0.025 after the blend against 0.044 for the unblended screening counts. A better amount correction is trusted more by the blend: in Jan the fitted weight on climatology is 0.60 with Square-root-space Mean-Variance Scaling against 0.91 with Mean-Variance Scaling.
Choosing by training scores can backfire. For Oct, SEL-A chose Delta Change from the 1993–2016 scores; over 2017–2024 it has a worse mean CRPS (Δ +0.937 mm, 95% interval -0.229 to +2.405 mm; better than Mean-Variance Scaling in 4 of 8 years, with the largest losses in 2019 and 2023); for ONDJ, SEL-A chose Delta Change from the 1993–2016 scores; over 2017–2024 it has a worse mean CRPS (Δ +3.217 mm, 95% interval -1.217 to +9.206 mm; better than Mean-Variance Scaling in 5 of 8 years, with the largest losses in 2019 and 2023); for Oct, SEL-P chose Gamma Quantile Mapping from the 1993–2016 scores; over 2017–2024 it has a worse mean RPS (Δ +0.003, 95% interval -0.001 to +0.006; better than Mean-Variance Scaling in 4 of 8 years, with the largest losses in 2024 and 2019); for Dec, SEL-P chose Square-root-space Mean-Variance Scaling from the 1993–2016 scores; over 2017–2024 it has a worse mean RPS (Δ +0.001, 95% interval -0.012 to +0.012; better than Mean-Variance Scaling in 2 of 8 years, with the largest losses in 2023 and 2021). These choices fail the no-harm rule; where the interval includes 0 they do not establish a significant deterioration. A method that ranks first on the training years is not, on that alone, a replacement.
Where the confirmed amount gains come from (climate groups from each fold’s training years; contributions add up to the national difference from Mean-Variance Scaling): Square-root-space Mean-Variance Scaling in Jan (Δ CRPS -0.479 mm): all ≤ 1 mm -0.003 mm (1%; 9% of the area), mixed -0.018 mm (4%; 11% of the area), always wet -0.458 mm (96%; 80% of the area); Gamma Quantile Mapping in Jan (Δ CRPS -0.365 mm): all ≤ 1 mm +0.010 mm (-3%; 9% of the area), mixed +0.003 mm (-1%; 11% of the area), always wet -0.378 mm (104%; 80% of the area).
No cell of All Ethiopia has exactly 0 mm in every training year, for any target, at 0.25° with CHIRPS. The all-zero guard (a separate MVS variant, outside the declared family) therefore never acts and equals Mean-Variance Scaling: the non-zero totals that Mean-Variance Scaling gives where every training year is 0 mm (its spread ratio cannot fall below 0.5) do not arise in these data. The guard remains a documented option; a finite history of zero rainfall does not make rain impossible.
Caveats
Screening skill is from 1993–2016 leave-one-year-out (clean) and 2017–2024 (exploratory: these years were seen while the operational method was chosen).
Screening tercile scores use smoothed member counts without the climatology blend; the confirmation scores the blended product.
Two multiplicity families are shown: within one method across its targets (✓) and across all methods and targets (✓✓). The confirmation’s selection-aware procedures include the method choice in the evaluation itself.
Scores are area-weighted over many correlated cells but tested year by year, so each year counts once.
The ordinary CRPS scores the delivered ensemble; the fair CRPS is a diagnostic under a sampling interpretation that DC’s rescaled years and methods tied to the forecast mean or ranks only approximate.
Results are national aggregates unless a table says otherwise; a method can rank differently in a region (switch the tables to the regional view).
Boé, J., Terray, L., Habets, F., & Martin, E. (2007). Statistical and dynamical downscaling of the Seine basin climate for hydro-meteorological studies. International Journal of Climatology, 27, 1643–1655. doi:10.1002/joc.1602
Cannon, A. J., Sobie, S. R., & Murdock, T. Q. (2015). Bias correction of GCM precipitation by quantile mapping: how well do methods preserve changes in quantiles and extremes? Journal of Climate, 28, 6938–6959. doi:10.1175/JCLI-D-14-00754.1
Delle Monache, L., Hacker, J. P., Zhou, Y., Deng, X., & Stull, R. B. (2006). Probabilistic aspects of meteorological and ozone regional ensemble forecasts. Journal of Geophysical Research: Atmospheres, 111, D24307. doi:10.1029/2005JD006917
Ferro, C. A. T. (2014). Fair scores for ensemble forecasts. Quarterly Journal of the Royal Meteorological Society, 140, 1917–1923. doi:10.1002/qj.2270
Gudmundsson, L., Bremnes, J. B., Haugen, J. E., & Engen-Skaugen, T. (2012). Technical Note: Downscaling RCM precipitation to the station scale using statistical transformations — a comparison of methods. Hydrology and Earth System Sciences, 16, 3383–3390. doi:10.5194/hess-16-3383-2012
Hay, L. E., Wilby, R. L., & Leavesley, G. H. (2000). A comparison of delta change and downscaled GCM scenarios for three mountainous basins in the United States. JAWRA Journal of the American Water Resources Association, 36, 387–397. doi:10.1111/j.1752-1688.2000.tb04276.x
Johnson, S. J., Stockdale, T. N., Ferranti, L., et al. (2019). SEAS5: the new ECMWF seasonal forecast system. Geoscientific Model Development, 12, 1087–1117. doi:10.5194/gmd-12-1087-2019
Leander, R., & Buishand, T. A. (2007). Resampling of regional climate model output for the simulation of extreme river flows. Journal of Hydrology, 332, 487–496. doi:10.1016/j.jhydrol.2006.08.006
Lenderink, G., Buishand, A., & van Deursen, W. (2007). Estimates of future discharges of the river Rhine using two scenario methodologies: direct versus delta approach. Hydrology and Earth System Sciences, 11, 1145–1159. doi:10.5194/hess-11-1145-2007
Manzanas, R., Gutiérrez, J. M., Bhend, J., et al. (2019). Bias adjustment and ensemble recalibration methods for seasonal forecasting: a comprehensive intercomparison using the C3S dataset. Climate Dynamics, 53, 1287–1305. doi:10.1007/s00382-019-04640-4
Michelangeli, P.-A., Vrac, M., & Loukos, H. (2009). Probabilistic downscaling approaches: application to wind cumulative distribution functions. Geophysical Research Letters, 36, L11708. doi:10.1029/2009GL038401
Piani, C., Weedon, G. P., Best, M., et al. (2010). Statistical bias correction of global simulated daily precipitation and temperature for the application of hydrological models. Journal of Hydrology, 395, 199–215. doi:10.1016/j.jhydrol.2010.10.024
Schmidli, J., Frei, C., & Vidale, P. L. (2006). Downscaling from GCM precipitation: a benchmark for dynamical and statistical downscaling methods. International Journal of Climatology, 26, 679–689. doi:10.1002/joc.1287
Switanek, M. B., Troch, P. A., Castro, C. L., et al. (2017). Scaled distribution mapping: a bias correction method that preserves raw climate model projected changes. Hydrology and Earth System Sciences, 21, 2649–2666. doi:10.5194/hess-21-2649-2017
Teutschbein, C., & Seibert, J. (2012). Bias correction of regional climate model simulations for hydrological climate-change impact studies: review and evaluation of different methods. Journal of Hydrology, 456–457, 12–29. doi:10.1016/j.jhydrol.2012.05.052
Themeßl, M. J., Gobiet, A., & Leuprecht, A. (2011). Empirical-statistical downscaling and error correction of daily precipitation from regional climate models. International Journal of Climatology, 31, 1530–1544. doi:10.1002/joc.2168
Torralba, V., Doblas-Reyes, F. J., MacLeod, D., Christel, I., & Davis, M. (2017). Seasonal climate prediction: a new source of information for the management of wind energy resources. Journal of Applied Meteorology and Climatology, 56, 1231–1247. doi:10.1175/JAMC-D-16-0204.1
Vrac, M., Drobinski, P., Merlo, A., et al. (2012). Dynamical and statistical downscaling of the French Mediterranean climate: uncertainty assessment. Natural Hazards and Earth System Sciences, 12, 2769–2784. doi:10.5194/nhess-12-2769-2012
DOIs checked against Crossref, 11 October 2026.
Probability and rainfall-distribution calibration
Can a different probability method improve the tercile probabilities users receive? The published pipeline is MVS-corrected
members → smoothed member counts → climatology blend (the incumbent). Phase 1 keeps the amount correction fixed
(Pathway A) and replaces only the probability stage: every method starts from the same smoothed, unblended probabilities, except the
logistic models, which use declared ensemble predictors (standardized ensemble mean and log spread ratio). Every parameter — the
blend weight, the temperature, the Dirichlet map, the logistic coefficients — is fitted only on inner out-of-fold years within each
left-out year, and a selection-aware procedure (SEL) chooses the method for each year by inner cross-validation. Later phases add
binary-calibration extensions and full rainfall-distribution models (Pathway B). The published forecasts are unchanged.
Implementation plan (the order is a plan, not a ranking of performance)
Pseudocount smoothing pk = (nk + α)/(M + 3α) stabilizes count probabilities; the climatology
blend p = (1 − λ)·psmooth + λ·pclim learns how much forecast information to keep. Both are kept as references.
Dirichlet calibration (a regularized linear map of the log probabilities, then softmax) is not pseudocount smoothing.
Dirichlet uses only the log probabilities; multinomial logistic uses only the ensemble predictors, so
they are different models. Ordinal logistic uses the same predictors with ordered cutpoints (below → near → above).
All methods are pooled over the grid cells of a target with equal weight per year; a method that cannot be fitted falls back to
the incumbent and the fallback is counted.
January initialization · FMAM and its months
Confirmed better than the incumbent climatology blend for the published tercile probabilities (RPS): none.
✓ = better than the incumbent with Holm-adjusted p < 0.05 across every method and target (SEL: across the targets) and not worse
over 2017–2025. Amount correction fixed: MVS. National aggregate (All Ethiopia). Run at commit
0849f44.
Platt, beta and isotonic calibration of each category against the rest, divided by their sum inside the pipeline, against the
incumbent (their own family: Holm across these methods and the targets). Confirmed better: none.
Phase 2 · rainfall-distribution models (Pathway B)
Each model predicts a full rainfall distribution from the raw ensemble (pooled over cells in units relative to each cell's
climatology); terciles at the training CHIRPS boundaries, quantiles and intervals come from it. References, in the same folds:
the published probabilities (tercile RPS) and the MVS-corrected ensemble (CRPS, quantiles). ✓ = better than the reference with
Holm-adjusted p < 0.05 across the models and targets, and not worse over 2017–2025. Confirmed better — tercile probabilities:
none; rainfall amounts (CRPS): EMOS, censored shifted gamma (FMAM).
Tercile RPSS, outer leave-one-year-out 1993–2016
Method
Feb
Mar
Apr
May
FMAM
Published probabilities (incumbent)
+0.033
+0.002
+0.001
+0.028
+0.032
EMOS, censored shifted gamma
+0.043
-0.065
-0.001
+0.026
+0.037
Heteroscedastic extended logistic regression
+0.065
-0.065
-0.000
+0.027
+0.031
Regularized quantile regression
+0.039
-0.052
-0.001
+0.028
+0.030
Amount CRPSS against the CHIRPS climatology, 1993–2016
Method
Feb
Mar
Apr
May
FMAM
MVS-corrected ensemble
+0.074
-0.044
-0.016
+0.007
+0.025
EMOS, censored shifted gamma
+0.074
-0.026
+0.005
+0.014
+0.039 ✓
Heteroscedastic extended logistic regression
+0.072
-0.076
-0.005
-0.004
+0.032
Regularized quantile regression
+0.104
-0.018
+0.004
+0.012
+0.033
Interval coverage, median pinball loss, test years and the model definitions
Share of observations inside the 10–90% interval, 1993–2016 (80% is calibrated)
Method
Feb
Mar
Apr
May
FMAM
MVS-corrected ensemble
56%
54%
68%
69%
72%
EMOS, censored shifted gamma
82%
81%
77%
78%
78%
Heteroscedastic extended logistic regression
89%
92%
84%
85%
83%
Regularized quantile regression
78%
77%
77%
77%
77%
Pinball loss of the median (mm), 1993–2016 (lower is better)
ensemble mean m' and mean absolute difference md' (relative)
maximum likelihood, pooled over cells
CDF, quantiles, tercile probabilities
Heteroscedastic extended logistic regression
coherent CDF across all thresholds
sqrt of the ensemble mean m', log spread s' (relative)
log loss over each cell’s CHIRPS deciles, pooled
CDF, quantiles, tercile probabilities
Regularized quantile regression
conditional quantiles at 19 levels (5–95%), CDF by interpolation
ensemble mean m' and spread s' (relative)
pinball loss per level (Huber-smoothed), L2 1e-4, pooled
CDF, quantiles, tercile probabilities
Tercile RPSS and amount CRPSS of the Phase 2 distribution models against the published pipeline.
Phase 3 · rainfall-distribution models (Pathway B)
Each model predicts a full rainfall distribution from the raw ensemble (pooled over cells in units relative to each cell's
climatology); terciles at the training CHIRPS boundaries, quantiles and intervals come from it. References, in the same folds:
the published probabilities (tercile RPS) and the MVS-corrected ensemble (CRPS, quantiles). ✓ = better than the reference with
Holm-adjusted p < 0.05 across the models and targets, and not worse over 2017–2025. Confirmed better — tercile probabilities:
none; rainfall amounts (CRPS): none.
Tercile RPSS, outer leave-one-year-out 1993–2016
Method
Feb
Mar
Apr
May
FMAM
Published probabilities (incumbent)
+0.033
+0.002
+0.001
+0.028
+0.032
Bayesian joint probability
+0.026
-0.088
-0.005
+0.019
+0.030
Bayesian model averaging for precipitation
+0.014
-0.037
-0.010
+0.030
+0.044
Quantile regression forest
+0.028
-0.107
-0.087
-0.027
-0.025
Amount CRPSS against the CHIRPS climatology, 1993–2016
Method
Feb
Mar
Apr
May
FMAM
MVS-corrected ensemble
+0.074
-0.044
-0.016
+0.007
+0.025
Bayesian joint probability
+0.085
-0.048
-0.018
-0.016
+0.019
Bayesian model averaging for precipitation
+0.084
-0.014
-0.011
+0.008
+0.044
Quantile regression forest
+0.018
-0.100
-0.071
-0.033
-0.022
Interval coverage, median pinball loss, test years and the model definitions
Share of observations inside the 10–90% interval, 1993–2016 (80% is calibrated)
Method
Feb
Mar
Apr
May
FMAM
MVS-corrected ensemble
56%
54%
68%
69%
72%
Bayesian joint probability
83%
82%
81%
81%
82%
Bayesian model averaging for precipitation
82%
81%
82%
84%
80%
Quantile regression forest
74%
71%
72%
73%
72%
Pinball loss of the median (mm), 1993–2016 (lower is better)
Method
Feb
Mar
Apr
May
FMAM
MVS-corrected ensemble
5.09
14.09
20.47
20.44
33.73
Bayesian joint probability
5.09
14.77
20.24
20.56
33.97
Bayesian model averaging for precipitation
5.14
14.12
20.53
20.59
33.60
Quantile regression forest
5.50
15.36
21.74
21.36
35.85
Fit 1993–2016, scored 2017–2025 (exploratory)
Method
Feb
Mar
Apr
May
FMAM
Published probabilities / MVS ensemble
+0.020 / +0.002
+0.008 / +0.005
+0.002 / -0.006
+0.004 / -0.007
+0.017 / +0.016
Bayesian joint probability (RPSS / CRPSS)
-0.029 / +0.023
-0.037 / -0.034
-0.006 / -0.008
-0.006 / -0.056
+0.013 / +0.015
Bayesian model averaging for precipitation (RPSS / CRPSS)
-0.025 / +0.029
+0.013 / +0.023
-0.041 / -0.017
-0.051 / -0.042
+0.012 / +0.023
Quantile regression forest (RPSS / CRPSS)
-0.034 / -0.016
-0.007 / +0.004
-0.052 / -0.031
-0.086 / -0.049
-0.006 / +0.017
Models
Model
Estimates
Predictors
Fitting
Outputs
Bayesian joint probability
rainfall distribution (log-sinh normal, censored at zero, Student-t predictive)
ensemble mean m' (relative)
censored maximum likelihood of the transforms and the joint normal; parameter uncertainty integrated with the number of training years as the effective sample
CDF, quantiles, tercile probabilities
Bayesian model averaging for precipitation
mixture over members: probability of zero and a gamma for the cube root of the amount
each member's amount f' (relative), equal weights for exchangeable members
maximum likelihood of the mixture, pooled
CDF, quantiles, tercile probabilities
Quantile regression forest
conditional distribution as leaf-weighted training amounts; quantiles at 39 levels (2.5–97.5%)
m', s', md', ensemble 10% and 90% quantiles (relative), log climatological mean, CHIRPS coefficient of variation
200 trees, at least 40 samples per leaf, half the predictors per split, pooled
CDF, quantiles, tercile probabilities
Tercile RPSS and amount CRPSS of the Phase 3 distribution models against the published pipeline.
Shadow forecast · rainfall amounts and ranges (EMOS), not published
Not a published forecast. Since 2026-10-14, each cycle also runs the EMOS distribution model (censored
shifted gamma, fitted on the cycle's reference years) and records its median and 10–90% range for every target next to the
MVS-corrected ensemble. In Phase 2 the EMOS 10-90% intervals held 76-84% of observed totals where the MVS-corrected ensemble's held 46-76% (80% is calibrated), and EMOS was confirmed better in CRPS for the January-initialized FMAM season and JJAS September. The shadow builds independent evidence season by season before any amount or range product is considered. Each season is scored once its CHIRPS observations exist; any change to what is
published is a separate decision after several seasons.
2026 forecast · 5 of 5 targets observed so far
Forecast 2026: national area-weighted means over the modelled cells (fitted on 1993–2025)
Target
Climatology (mm)
Shadow: median (10–90%), mm
MVS ensemble: median (10–90%), mm
Range width / climatology (shadow / MVS)
Feb
20
18 (6–40)
15 (10–39)
2.01 / 1.56
Mar
53
50 (13–131)
47 (26–116)
2.48 / 2.00
Apr
99
86 (33–176)
85 (38–171)
1.58 / 1.50
May
110
98 (47–170)
98 (57–158)
1.25 / 1.07
FMAM
278
266 (165–402)
267 (170–396)
0.94 / 0.91
Scored against CHIRPS 2026 (one season each; 80% coverage is calibrated)
Confirmed better than the incumbent climatology blend for the published tercile probabilities (RPS): none.
✓ = better than the incumbent with Holm-adjusted p < 0.05 across every method and target (SEL: across the targets) and not worse
over 2017–2025. Amount correction fixed: MVS. National aggregate (All Ethiopia). Run at commit
0849f44.
Platt, beta and isotonic calibration of each category against the rest, divided by their sum inside the pipeline, against the
incumbent (their own family: Holm across these methods and the targets). Confirmed better: none.
Phase 2 · rainfall-distribution models (Pathway B)
Each model predicts a full rainfall distribution from the raw ensemble (pooled over cells in units relative to each cell's
climatology); terciles at the training CHIRPS boundaries, quantiles and intervals come from it. References, in the same folds:
the published probabilities (tercile RPS) and the MVS-corrected ensemble (CRPS, quantiles). ✓ = better than the reference with
Holm-adjusted p < 0.05 across the models and targets, and not worse over 2017–2025. Confirmed better — tercile probabilities:
none; rainfall amounts (CRPS): none.
Tercile RPSS, outer leave-one-year-out 1993–2016
Method
Feb
Mar
Apr
May
FMAM
Published probabilities (incumbent)
+0.137
+0.011
+0.009
+0.008
+0.021
EMOS, censored shifted gamma
+0.103
-0.043
-0.003
-0.008
+0.028
Heteroscedastic extended logistic regression
+0.168
-0.038
+0.004
-0.007
+0.021
Regularized quantile regression
+0.099
-0.021
-0.006
-0.008
+0.023
Amount CRPSS against the CHIRPS climatology, 1993–2016
Method
Feb
Mar
Apr
May
FMAM
MVS-corrected ensemble
+0.250
-0.034
-0.001
-0.005
-0.007
EMOS, censored shifted gamma
+0.248
-0.013
+0.003
-0.003
+0.026
Heteroscedastic extended logistic regression
+0.234
-0.067
-0.008
-0.023
+0.017
Regularized quantile regression
+0.259
-0.010
+0.000
-0.004
+0.020
Interval coverage, median pinball loss, test years and the model definitions
Share of observations inside the 10–90% interval, 1993–2016 (80% is calibrated)
Method
Feb
Mar
Apr
May
FMAM
MVS-corrected ensemble
55%
59%
68%
67%
70%
EMOS, censored shifted gamma
83%
81%
76%
78%
79%
Heteroscedastic extended logistic regression
90%
91%
84%
84%
84%
Regularized quantile regression
78%
77%
77%
77%
77%
Pinball loss of the median (mm), 1993–2016 (lower is better)
ensemble mean m' and mean absolute difference md' (relative)
maximum likelihood, pooled over cells
CDF, quantiles, tercile probabilities
Heteroscedastic extended logistic regression
coherent CDF across all thresholds
sqrt of the ensemble mean m', log spread s' (relative)
log loss over each cell’s CHIRPS deciles, pooled
CDF, quantiles, tercile probabilities
Regularized quantile regression
conditional quantiles at 19 levels (5–95%), CDF by interpolation
ensemble mean m' and spread s' (relative)
pinball loss per level (Huber-smoothed), L2 1e-4, pooled
CDF, quantiles, tercile probabilities
Tercile RPSS and amount CRPSS of the Phase 2 distribution models against the published pipeline.
Phase 3 · rainfall-distribution models (Pathway B)
Each model predicts a full rainfall distribution from the raw ensemble (pooled over cells in units relative to each cell's
climatology); terciles at the training CHIRPS boundaries, quantiles and intervals come from it. References, in the same folds:
the published probabilities (tercile RPS) and the MVS-corrected ensemble (CRPS, quantiles). ✓ = better than the reference with
Holm-adjusted p < 0.05 across the models and targets, and not worse over 2017–2025. Confirmed better — tercile probabilities:
none; rainfall amounts (CRPS): none.
Tercile RPSS, outer leave-one-year-out 1993–2016
Method
Feb
Mar
Apr
May
FMAM
Published probabilities (incumbent)
+0.137
+0.011
+0.009
+0.008
+0.021
Bayesian joint probability
+0.124
-0.071
-0.008
-0.011
+0.019
Bayesian model averaging for precipitation
+0.123
-0.011
+0.006
+0.015
+0.034
Quantile regression forest
+0.154
-0.120
-0.047
-0.081
-0.050
Amount CRPSS against the CHIRPS climatology, 1993–2016
Method
Feb
Mar
Apr
May
FMAM
MVS-corrected ensemble
+0.250
-0.034
-0.001
-0.005
-0.007
Bayesian joint probability
+0.222
-0.041
-0.021
-0.029
+0.007
Bayesian model averaging for precipitation
+0.237
+0.001
+0.001
-0.003
+0.030
Quantile regression forest
+0.261
-0.121
-0.034
-0.067
-0.051
Interval coverage, median pinball loss, test years and the model definitions
Share of observations inside the 10–90% interval, 1993–2016 (80% is calibrated)
Method
Feb
Mar
Apr
May
FMAM
MVS-corrected ensemble
55%
59%
68%
67%
70%
Bayesian joint probability
85%
82%
80%
81%
82%
Bayesian model averaging for precipitation
84%
81%
82%
83%
79%
Quantile regression forest
76%
71%
72%
71%
71%
Pinball loss of the median (mm), 1993–2016 (lower is better)
Method
Feb
Mar
Apr
May
FMAM
MVS-corrected ensemble
3.94
13.85
20.01
20.42
34.86
Bayesian joint probability
4.23
14.55
20.20
20.68
34.20
Bayesian model averaging for precipitation
4.18
13.80
20.17
20.45
33.89
Quantile regression forest
3.95
15.61
20.93
21.96
36.63
Fit 1993–2016, scored 2017–2025 (exploratory)
Method
Feb
Mar
Apr
May
FMAM
Published probabilities / MVS ensemble
+0.059 / +0.000
+0.029 / +0.065
+0.012 / +0.004
+0.026 / +0.025
+0.059 / +0.071
Bayesian joint probability (RPSS / CRPSS)
+0.033 / +0.056
-0.008 / -0.001
-0.004 / -0.007
+0.027 / -0.040
+0.057 / +0.041
Bayesian model averaging for precipitation (RPSS / CRPSS)
+0.046 / +0.067
+0.042 / +0.054
-0.018 / -0.011
-0.002 / -0.020
+0.077 / +0.063
Quantile regression forest (RPSS / CRPSS)
+0.028 / -0.064
+0.020 / +0.010
-0.078 / -0.071
-0.019 / -0.021
+0.019 / +0.020
Models
Model
Estimates
Predictors
Fitting
Outputs
Bayesian joint probability
rainfall distribution (log-sinh normal, censored at zero, Student-t predictive)
ensemble mean m' (relative)
censored maximum likelihood of the transforms and the joint normal; parameter uncertainty integrated with the number of training years as the effective sample
CDF, quantiles, tercile probabilities
Bayesian model averaging for precipitation
mixture over members: probability of zero and a gamma for the cube root of the amount
each member's amount f' (relative), equal weights for exchangeable members
maximum likelihood of the mixture, pooled
CDF, quantiles, tercile probabilities
Quantile regression forest
conditional distribution as leaf-weighted training amounts; quantiles at 39 levels (2.5–97.5%)
m', s', md', ensemble 10% and 90% quantiles (relative), log climatological mean, CHIRPS coefficient of variation
200 trees, at least 40 samples per leaf, half the predictors per split, pooled
CDF, quantiles, tercile probabilities
Tercile RPSS and amount CRPSS of the Phase 3 distribution models against the published pipeline.
Shadow forecast · rainfall amounts and ranges (EMOS), not published
Not a published forecast. Since 2026-10-14, each cycle also runs the EMOS distribution model (censored
shifted gamma, fitted on the cycle's reference years) and records its median and 10–90% range for every target next to the
MVS-corrected ensemble. In Phase 2 the EMOS 10-90% intervals held 76-84% of observed totals where the MVS-corrected ensemble's held 46-76% (80% is calibrated), and EMOS was confirmed better in CRPS for the January-initialized FMAM season and JJAS September. The shadow builds independent evidence season by season before any amount or range product is considered. Each season is scored once its CHIRPS observations exist; any change to what is
published is a separate decision after several seasons.
2026 forecast · 5 of 5 targets observed so far
Forecast 2026: national area-weighted means over the modelled cells (fitted on 1993–2025)
Target
Climatology (mm)
Shadow: median (10–90%), mm
MVS ensemble: median (10–90%), mm
Range width / climatology (shadow / MVS)
Feb
19
14 (5–31)
14 (10–27)
1.34 / 0.85
Mar
53
45 (12–118)
48 (22–106)
2.12 / 1.78
Apr
99
101 (44–197)
119 (59–197)
1.78 / 1.64
May
110
100 (45–182)
99 (52–172)
1.43 / 1.28
FMAM
278
286 (186–420)
301 (206–413)
0.94 / 0.86
Scored against CHIRPS 2026 (one season each; 80% coverage is calibrated)
Confirmed better than the incumbent climatology blend for the published tercile probabilities (RPS): none.
✓ = better than the incumbent with Holm-adjusted p < 0.05 across every method and target (SEL: across the targets) and not worse
over 2017–2025. Amount correction fixed: MVS. National aggregate (All Ethiopia). Run at commit
0849f44.
Platt, beta and isotonic calibration of each category against the rest, divided by their sum inside the pipeline, against the
incumbent (their own family: Holm across these methods and the targets). Confirmed better: none.
Phase 2 · rainfall-distribution models (Pathway B)
Each model predicts a full rainfall distribution from the raw ensemble (pooled over cells in units relative to each cell's
climatology); terciles at the training CHIRPS boundaries, quantiles and intervals come from it. References, in the same folds:
the published probabilities (tercile RPS) and the MVS-corrected ensemble (CRPS, quantiles). ✓ = better than the reference with
Holm-adjusted p < 0.05 across the models and targets, and not worse over 2017–2025. Confirmed better — tercile probabilities:
none; rainfall amounts (CRPS): EMOS, censored shifted gamma (Sep) and Regularized quantile regression (Sep).
Tercile RPSS, outer leave-one-year-out 1993–2016
Method
Jun
Jul
Aug
Sep
JJAS
Published probabilities (incumbent)
-0.000
+0.015
+0.012
+0.003
+0.027
EMOS, censored shifted gamma
-0.045
-0.004
-0.014
-0.013
+0.003
Heteroscedastic extended logistic regression
-0.052
-0.003
-0.008
-0.018
+0.005
Regularized quantile regression
-0.052
-0.013
-0.030
-0.020
+0.001
Amount CRPSS against the CHIRPS climatology, 1993–2016
Method
Jun
Jul
Aug
Sep
JJAS
MVS-corrected ensemble
-0.096
-0.005
-0.027
-0.060
-0.028
EMOS, censored shifted gamma
-0.031
+0.018
-0.004
-0.006 ✓
+0.017
Heteroscedastic extended logistic regression
-0.054
+0.013
-0.010
-0.017
+0.007
Regularized quantile regression
-0.015
+0.014
-0.004
-0.001 ✓
+0.014
Interval coverage, median pinball loss, test years and the model definitions
Share of observations inside the 10–90% interval, 1993–2016 (80% is calibrated)
Method
Jun
Jul
Aug
Sep
JJAS
MVS-corrected ensemble
65%
73%
75%
71%
70%
EMOS, censored shifted gamma
84%
81%
83%
82%
81%
Heteroscedastic extended logistic regression
90%
86%
88%
87%
87%
Regularized quantile regression
78%
78%
78%
78%
78%
Pinball loss of the median (mm), 1993–2016 (lower is better)
ensemble mean m' and mean absolute difference md' (relative)
maximum likelihood, pooled over cells
CDF, quantiles, tercile probabilities
Heteroscedastic extended logistic regression
coherent CDF across all thresholds
sqrt of the ensemble mean m', log spread s' (relative)
log loss over each cell’s CHIRPS deciles, pooled
CDF, quantiles, tercile probabilities
Regularized quantile regression
conditional quantiles at 19 levels (5–95%), CDF by interpolation
ensemble mean m' and spread s' (relative)
pinball loss per level (Huber-smoothed), L2 1e-4, pooled
CDF, quantiles, tercile probabilities
Tercile RPSS and amount CRPSS of the Phase 2 distribution models against the published pipeline.
Phase 3 · rainfall-distribution models (Pathway B)
Each model predicts a full rainfall distribution from the raw ensemble (pooled over cells in units relative to each cell's
climatology); terciles at the training CHIRPS boundaries, quantiles and intervals come from it. References, in the same folds:
the published probabilities (tercile RPS) and the MVS-corrected ensemble (CRPS, quantiles). ✓ = better than the reference with
Holm-adjusted p < 0.05 across the models and targets, and not worse over 2017–2025. Confirmed better — tercile probabilities:
none; rainfall amounts (CRPS): none.
Tercile RPSS, outer leave-one-year-out 1993–2016
Method
Jun
Jul
Aug
Sep
JJAS
Published probabilities (incumbent)
-0.000
+0.015
+0.012
+0.003
+0.027
Bayesian joint probability
-0.061
-0.016
-0.033
-0.033
-0.020
Bayesian model averaging for precipitation
-0.062
-0.024
-0.050
-0.038
+0.001
Quantile regression forest
-0.088
-0.050
-0.042
-0.067
-0.045
Amount CRPSS against the CHIRPS climatology, 1993–2016
Method
Jun
Jul
Aug
Sep
JJAS
MVS-corrected ensemble
-0.096
-0.005
-0.027
-0.060
-0.028
Bayesian joint probability
-0.121
-0.034
-0.075
-0.066
-0.101
Bayesian model averaging for precipitation
-0.083
-0.046
-0.055
-0.063
-0.002
Quantile regression forest
-0.065
-0.013
-0.021
-0.045
-0.021
Interval coverage, median pinball loss, test years and the model definitions
Share of observations inside the 10–90% interval, 1993–2016 (80% is calibrated)
Method
Jun
Jul
Aug
Sep
JJAS
MVS-corrected ensemble
65%
73%
75%
71%
70%
Bayesian joint probability
86%
85%
85%
85%
86%
Bayesian model averaging for precipitation
85%
83%
81%
82%
82%
Quantile regression forest
74%
74%
76%
74%
73%
Pinball loss of the median (mm), 1993–2016 (lower is better)
Method
Jun
Jul
Aug
Sep
JJAS
MVS-corrected ensemble
12.41
16.93
14.75
13.21
33.54
Bayesian joint probability
11.87
16.75
14.55
12.75
32.84
Bayesian model averaging for precipitation
11.88
17.13
14.55
12.84
32.31
Quantile regression forest
12.16
17.05
14.85
13.18
33.53
Fit 1993–2016, scored 2017–2025 (exploratory)
Method
Jun
Jul
Aug
Sep
JJAS
Published probabilities / MVS ensemble
+0.010 / -0.030
+0.042 / +0.002
+0.041 / +0.055
+0.008 / -0.034
+0.039 / -0.018
Bayesian joint probability (RPSS / CRPSS)
-0.056 / -0.088
+0.011 / -0.047
+0.009 / -0.036
-0.038 / -0.074
-0.002 / -0.142
Bayesian model averaging for precipitation (RPSS / CRPSS)
-0.013 / -0.046
-0.031 / -0.075
-0.030 / -0.050
-0.078 / -0.096
+0.033 / -0.012
Quantile regression forest (RPSS / CRPSS)
-0.050 / -0.032
-0.046 / -0.023
-0.017 / -0.009
-0.061 / -0.046
-0.029 / -0.032
Models
Model
Estimates
Predictors
Fitting
Outputs
Bayesian joint probability
rainfall distribution (log-sinh normal, censored at zero, Student-t predictive)
ensemble mean m' (relative)
censored maximum likelihood of the transforms and the joint normal; parameter uncertainty integrated with the number of training years as the effective sample
CDF, quantiles, tercile probabilities
Bayesian model averaging for precipitation
mixture over members: probability of zero and a gamma for the cube root of the amount
each member's amount f' (relative), equal weights for exchangeable members
maximum likelihood of the mixture, pooled
CDF, quantiles, tercile probabilities
Quantile regression forest
conditional distribution as leaf-weighted training amounts; quantiles at 39 levels (2.5–97.5%)
m', s', md', ensemble 10% and 90% quantiles (relative), log climatological mean, CHIRPS coefficient of variation
200 trees, at least 40 samples per leaf, half the predictors per split, pooled
CDF, quantiles, tercile probabilities
Tercile RPSS and amount CRPSS of the Phase 3 distribution models against the published pipeline.
Shadow forecast · rainfall amounts and ranges (EMOS), not published
Not a published forecast. Since 2026-10-14, each cycle also runs the EMOS distribution model (censored
shifted gamma, fitted on the cycle's reference years) and records its median and 10–90% range for every target next to the
MVS-corrected ensemble. In Phase 2 the EMOS 10-90% intervals held 76-84% of observed totals where the MVS-corrected ensemble's held 46-76% (80% is calibrated), and EMOS was confirmed better in CRPS for the January-initialized FMAM season and JJAS September. The shadow builds independent evidence season by season before any amount or range product is considered. Each season is scored once its CHIRPS observations exist; any change to what is
published is a separate decision after several seasons.
2026 forecast · 5 of 5 targets observed so far
Forecast 2026: national area-weighted means over the modelled cells (fitted on 1993–2025)
Target
Climatology (mm)
Shadow: median (10–90%), mm
MVS ensemble: median (10–90%), mm
Range width / climatology (shadow / MVS)
Jun
95
81 (45–132)
71 (49–100)
0.98 / 0.62
Jul
164
151 (101–212)
138 (96–184)
0.74 / 0.64
Aug
165
149 (104–206)
137 (102–180)
0.68 / 0.58
Sep
112
103 (61–161)
93 (58–141)
1.42 / 1.45
JJAS
516
473 (373–593)
430 (345–515)
0.79 / 0.73
Scored against CHIRPS 2026 (one season each; 80% coverage is calibrated)
Confirmed better than the incumbent climatology blend for the published tercile probabilities (RPS): none.
✓ = better than the incumbent with Holm-adjusted p < 0.05 across every method and target (SEL: across the targets) and not worse
over 2017–2024. Amount correction fixed: MVS. National aggregate (All Ethiopia). Run at commit
0849f44.
Platt, beta and isotonic calibration of each category against the rest, divided by their sum inside the pipeline, against the
incumbent (their own family: Holm across these methods and the targets). Confirmed better: none.
Phase 2 · rainfall-distribution models (Pathway B)
Each model predicts a full rainfall distribution from the raw ensemble (pooled over cells in units relative to each cell's
climatology); terciles at the training CHIRPS boundaries, quantiles and intervals come from it. References, in the same folds:
the published probabilities (tercile RPS) and the MVS-corrected ensemble (CRPS, quantiles). ✓ = better than the reference with
Holm-adjusted p < 0.05 across the models and targets, and not worse over 2017–2024. Confirmed better — tercile probabilities:
none; rainfall amounts (CRPS): none.
Tercile RPSS, outer leave-one-year-out 1993–2016
Method
Oct
Nov
Dec
Jan
ONDJ
Published probabilities (incumbent)
+0.013
+0.040
+0.003
+0.001
+0.039
EMOS, censored shifted gamma
+0.003
+0.037
-0.113
-0.060
+0.029
Heteroscedastic extended logistic regression
-0.000
+0.032
-0.076
-0.040
+0.030
Regularized quantile regression
-0.010
+0.017
-0.143
-0.064
+0.019
Amount CRPSS against the CHIRPS climatology, 1993–2016
Method
Oct
Nov
Dec
Jan
ONDJ
MVS-corrected ensemble
-0.002
+0.084
+0.029
-0.040
+0.070
EMOS, censored shifted gamma
+0.016
+0.071
+0.015
-0.029
+0.049
Heteroscedastic extended logistic regression
-0.011
+0.058
-0.017
-0.023
+0.062
Regularized quantile regression
-0.010
+0.056
+0.033
-0.036
+0.032
Interval coverage, median pinball loss, test years and the model definitions
Share of observations inside the 10–90% interval, 1993–2016 (80% is calibrated)
Method
Oct
Nov
Dec
Jan
ONDJ
MVS-corrected ensemble
72%
75%
76%
46%
75%
EMOS, censored shifted gamma
77%
78%
84%
80%
79%
Heteroscedastic extended logistic regression
90%
89%
92%
89%
83%
Regularized quantile regression
77%
77%
79%
77%
76%
Pinball loss of the median (mm), 1993–2016 (lower is better)
ensemble mean m' and mean absolute difference md' (relative)
maximum likelihood, pooled over cells
CDF, quantiles, tercile probabilities
Heteroscedastic extended logistic regression
coherent CDF across all thresholds
sqrt of the ensemble mean m', log spread s' (relative)
log loss over each cell’s CHIRPS deciles, pooled
CDF, quantiles, tercile probabilities
Regularized quantile regression
conditional quantiles at 19 levels (5–95%), CDF by interpolation
ensemble mean m' and spread s' (relative)
pinball loss per level (Huber-smoothed), L2 1e-4, pooled
CDF, quantiles, tercile probabilities
Tercile RPSS and amount CRPSS of the Phase 2 distribution models against the published pipeline.
Phase 3 · rainfall-distribution models (Pathway B)
Each model predicts a full rainfall distribution from the raw ensemble (pooled over cells in units relative to each cell's
climatology); terciles at the training CHIRPS boundaries, quantiles and intervals come from it. References, in the same folds:
the published probabilities (tercile RPS) and the MVS-corrected ensemble (CRPS, quantiles). ✓ = better than the reference with
Holm-adjusted p < 0.05 across the models and targets, and not worse over 2017–2024. Confirmed better — tercile probabilities:
none; rainfall amounts (CRPS): none.
Tercile RPSS, outer leave-one-year-out 1993–2016
Method
Oct
Nov
Dec
Jan
ONDJ
Published probabilities (incumbent)
+0.013
+0.040
+0.003
+0.001
+0.039
Bayesian joint probability
-0.030
+0.013
-0.126
-0.058
+0.017
Bayesian model averaging for precipitation
-0.004
+0.036
-0.152
-0.033
+0.042
Quantile regression forest
-0.046
+0.010
-0.129
-0.119
-0.008
Amount CRPSS against the CHIRPS climatology, 1993–2016
Method
Oct
Nov
Dec
Jan
ONDJ
MVS-corrected ensemble
-0.002
+0.084
+0.029
-0.040
+0.070
Bayesian joint probability
-0.041
+0.048
+0.014
-0.010
+0.042
Bayesian model averaging for precipitation
+0.010
+0.073
+0.021
-0.002
+0.069
Quantile regression forest
-0.056
+0.015
-0.054
-0.085
-0.052
Interval coverage, median pinball loss, test years and the model definitions
Share of observations inside the 10–90% interval, 1993–2016 (80% is calibrated)
Method
Oct
Nov
Dec
Jan
ONDJ
MVS-corrected ensemble
72%
75%
76%
46%
75%
Bayesian joint probability
81%
81%
83%
81%
79%
Bayesian model averaging for precipitation
80%
80%
79%
78%
80%
Quantile regression forest
73%
72%
75%
72%
69%
Pinball loss of the median (mm), 1993–2016 (lower is better)
Method
Oct
Nov
Dec
Jan
ONDJ
MVS-corrected ensemble
21.00
12.02
5.05
5.41
28.80
Bayesian joint probability
21.33
12.61
5.15
5.55
29.36
Bayesian model averaging for precipitation
20.98
12.27
5.14
5.46
28.76
Quantile regression forest
22.01
12.88
5.39
5.78
32.13
Fit 1993–2016, scored 2017–2024 (exploratory)
Method
Oct
Nov
Dec
Jan
ONDJ
Published probabilities / MVS ensemble
+0.027 / +0.059
+0.053 / +0.158
+0.016 / -0.033
-0.004 / -0.066
+0.075 / +0.178
Bayesian joint probability (RPSS / CRPSS)
+0.005 / -0.029
-0.013 / +0.101
-0.183 / -0.021
-0.057 / -0.010
+0.020 / +0.122
Bayesian model averaging for precipitation (RPSS / CRPSS)
-0.032 / -0.005
+0.006 / +0.097
-0.193 / -0.001
-0.047 / +0.013
+0.040 / +0.120
Quantile regression forest (RPSS / CRPSS)
+0.030 / +0.043
+0.031 / +0.137
-0.104 / +0.001
-0.025 / -0.215
+0.076 / +0.185
Models
Model
Estimates
Predictors
Fitting
Outputs
Bayesian joint probability
rainfall distribution (log-sinh normal, censored at zero, Student-t predictive)
ensemble mean m' (relative)
censored maximum likelihood of the transforms and the joint normal; parameter uncertainty integrated with the number of training years as the effective sample
CDF, quantiles, tercile probabilities
Bayesian model averaging for precipitation
mixture over members: probability of zero and a gamma for the cube root of the amount
each member's amount f' (relative), equal weights for exchangeable members
maximum likelihood of the mixture, pooled
CDF, quantiles, tercile probabilities
Quantile regression forest
conditional distribution as leaf-weighted training amounts; quantiles at 39 levels (2.5–97.5%)
m', s', md', ensemble 10% and 90% quantiles (relative), log climatological mean, CHIRPS coefficient of variation
200 trees, at least 40 samples per leaf, half the predictors per split, pooled
CDF, quantiles, tercile probabilities
Tercile RPSS and amount CRPSS of the Phase 3 distribution models against the published pipeline.
Shadow forecast · rainfall amounts and ranges (EMOS), not published
Not a published forecast. Since 2026-10-14, each cycle also runs the EMOS distribution model (censored
shifted gamma, fitted on the cycle's reference years) and records its median and 10–90% range for every target next to the
MVS-corrected ensemble. In Phase 2 the EMOS 10-90% intervals held 76-84% of observed totals where the MVS-corrected ensemble's held 46-76% (80% is calibrated), and EMOS was confirmed better in CRPS for the January-initialized FMAM season and JJAS September. The shadow builds independent evidence season by season before any amount or range product is considered. Each season is scored once its CHIRPS observations exist; any change to what is
published is a separate decision after several seasons.
2026 forecast · 0 of 5 targets observed so far
Forecast 2026: national area-weighted means over the modelled cells (fitted on 1993–2024)
Guo, C., Pleiss, G., Sun, Y., & Weinberger, K. Q. (2017). On calibration of modern neural networks. Proceedings of the 34th International Conference on Machine Learning, PMLR 70, 1321–1330. proceedings.mlr.press/v70/guo17a.html
Kull, M., Perello-Nieto, M., Kängsepp, M., Silva Filho, T., Song, H., & Flach, P. (2019). Beyond temperature scaling: obtaining well-calibrated multiclass probabilities with Dirichlet calibration. Advances in Neural Information Processing Systems 32 (NeurIPS 2019). arxiv.org/abs/1910.12656
Rajagopalan, B., Lall, U., & Zebiak, S. E. (2002). Categorical climate forecasts through regularization and optimal combination of multiple GCM ensembles. Monthly Weather Review, 130, 1792–1811. doi.org/10.1175/1520-0493(2002)130<1792:CCFTRA>2.0.CO;2
Wilks, D. S. (2019). Statistical Methods in the Atmospheric Sciences (4th ed.). Elsevier.
Platt, J. C. (1999). Probabilistic outputs for support vector machines and comparisons to regularized likelihood methods. In Advances in Large Margin Classifiers (pp. 61–74). MIT Press.
Kull, M., Silva Filho, T., & Flach, P. (2017). Beta calibration: a well-founded and easily implemented improvement on logistic calibration for binary classifiers. Proceedings of AISTATS 2017, PMLR 54. proceedings.mlr.press/v54/kull17a.html
Zadrozny, B., & Elkan, C. (2002). Transforming classifier scores into accurate multiclass probability estimates. Proceedings of the 8th ACM SIGKDD, 694–699. doi.org/10.1145/775047.775151
Scheuerer, M., & Hamill, T. M. (2015). Statistical postprocessing of ensemble precipitation forecasts by fitting censored, shifted gamma distributions. Monthly Weather Review, 143, 4578–4596. doi.org/10.1175/MWR-D-15-0061.1
Wilks, D. S. (2009). Extending logistic regression to provide full-probability-distribution MOS forecasts. Meteorological Applications, 16, 361–368. doi.org/10.1002/met.134
Messner, J. W., Mayr, G. J., Zeileis, A., & Wilks, D. S. (2014). Heteroscedastic extended logistic regression for postprocessing of ensemble guidance. Monthly Weather Review, 142, 448–456. doi.org/10.1175/MWR-D-13-00271.1
Koenker, R., & Bassett, G. (1978). Regression quantiles. Econometrica, 46, 33–50. doi.org/10.2307/1913643
Wang, Q. J., Robertson, D. E., & Chiew, F. H. S. (2009). A Bayesian joint probability modeling approach for seasonal forecasting of streamflows at multiple sites. Water Resources Research, 45, W05407. doi.org/10.1029/2008WR007355
Wang, Q. J., & Robertson, D. E. (2011). Multisite probabilistic forecasting of seasonal flows for streams with zero value occurrences. Water Resources Research, 47, W02546. doi.org/10.1029/2010WR009333
Wang, Q. J., Shrestha, D. L., Robertson, D. E., & Pokhrel, P. (2012). A log-sinh transformation for data normalization and variance stabilization. Water Resources Research, 48, W05514. doi.org/10.1029/2011WR010973
Sloughter, J. M., Raftery, A. E., Gneiting, T., & Fraley, C. (2007). Probabilistic quantitative precipitation forecasting using Bayesian model averaging. Monthly Weather Review, 135, 3209–3220. doi.org/10.1175/MWR3441.1
Fraley, C., Raftery, A. E., & Gneiting, T. (2010). Calibrating multimodel forecast ensembles with exchangeable and missing members using Bayesian model averaging. Monthly Weather Review, 138, 190–202. doi.org/10.1175/2009MWR3046.1
Where does a season's rain matter? Before a forecast domain is chosen, this review computes the observed climatology
(seasonal total, annual total and the season's share), compares it with EMI's published long-term maps, and tests every
combination of rainfall and annual-share cutoffs. Cutoffs are chosen for what the domain means climatologically, never
to improve a forecast score.
Methods & data
In brief
Each cycle starts from the ECMWF SEAS5 seasonal ensemble issued on the 1st of the initialization month. For every 0.25° grid cell in Ethiopia the forecast rainfall is corrected toward the CHIRPS observed mean and variability, then turned into tercile probabilities (below, near or above normal relative to the cycle's CHIRPS reference period). The probabilities are finally blended with climatology using one weight per target, chosen to give the best past scores. Climatology assigns approximately one-third probability to each tercile; the calculations use the observed category frequencies of the training reference period.
Probabilities and amounts are produced separately: the probability skill (RPSS) on this site refers to the blended probabilities, and the rainfall amount skill (CRPSS) to the amount-corrected ensemble.
The raw benchmark is the uncorrected model: raw ECMWF members counted against each cell's CHIRPS tercile limits, with no correction, smoothing or blend. For May-initialized JJAS over 2017–2025 it scores RPSS −0.44, far below climatology, which is why calibration is needed.
Data
Data sources
Source
Details
ECMWF SEAS5
Copernicus CDS seasonal-original-single-levels, system 51, total precipitation, 1993 to the forecast year; 25 members to 2016, 51 from 2017; 1° grid
CHIRPS v3.0
monthly rainfall, official 0.05° Africa product averaged onto the 0.25° grid (5 × 5 cells); archive from 1993; verification months from the official monthly files, checked against the archive where they overlap. Funk et al. (2026), The Climate Hazards Center Infrared Precipitation with Stations, Version 3, Scientific Data 13, 718, doi:10.1038/s41597-026-07096-4.
Areas
All Ethiopia (1,484 cells) and, per season, the rainfall domains offered in the area selector — FMAM: FMAM rainfall contribution domain; FMAM main-season rainfall domain (Belg / Gu / Ganna, >=40% of annual) · JJAS: JJAS R1+R2 rainfall domain · ONDJ: ONDJ R3 (Deyr) rainfall domain. Each definition is shown under the selector and in the rainfall-domain review. The domains are for display and summaries only; calibration uses every cell.
CHIRPS v2.0 vs v3.0 (why and what changed, 11 October 2026)
CHIRPS v3.0 (Funk et al. 2026) replaced v2.0 for calibration and verification. Over Ethiopia, 1993–2025, v3.0 is about
15% wetter (consistent with its gauge-undercatch correction) while each season's share of annual rainfall and the ranking of
years agree closely, so tercile limits move up. The same method was refitted on v3.0: the decision gates give the
same outcome, and skill is similar overall. Each version is scored against its own
observations.
Every stage is a script in scripts/; documents in docs/ record each step, issue and decision (runbook: docs/38; per-season guides: docs/40).
Equations
Amount correction per cell, equal weight per year: x̂ = max(0, μobs + r·(x − μmodel)), r = clip(σobs/σmodel, 0.5, 2)
Tercile probabilities from the corrected members against CHIRPS tercile limits, smoothed: (n + 0.5)/(M + 1.5)
Climatology blend: pfinal = (1 − λ)·pmodel + λ·pclimatology, with one λ per target fitted on leave-one-year-out RPS. pclimatology is, for each grid cell, the observed frequency of each tercile in the training reference years (about one-third each; it differs slightly because of sample size, category limits and ties).
Skill score: RPSS = 1 − RPSforecast / RPSclimatology; RPSS +0.05 means a 5% lower ranked probability score than climatology. CRPSS is the same for rainfall amounts.
Method and references
Rainfall amounts are corrected cell by cell with mean–variance scaling (also called simple bias
adjustment or variance scaling; Teutschbein & Seibert 2012; Torralba et al. 2017; Manzanas et al. 2019): each member is
shifted to the CHIRPS mean and its anomaly rescaled by the ratio of CHIRPS to model standard deviation (equations above).
It corrects the mean and spread, not the shape of the distribution; it is not quantile mapping. The model mean and spread
are pooled over all members and years, with equal weight per year (25 members to 2016, 51 from 2017); training years
1993–2025.
Probabilities are the share of corrected members in each CHIRPS tercile (ensemble relative frequency;
Wilks 2019), smoothed so no category is 0 or 1, then blended with climatology. Weighting a model against climatology
follows Rajagopalan et al. (2002) and Robertson et al. (2004); here one weight per target is fitted by minimising the
ranked probability score of leave-one-year-out probabilities.
Scores: ranked probability score (Epstein 1969) and continuous ranked probability score (Hersbach 2000),
as skill scores against climatology. Forecasts: ECMWF SEAS5 (Johnson et al. 2019); observations: CHIRPS v3.0
(Funk et al. 2026), v2.0 before 11 October 2026 (Funk et al. 2015).
Choices of this project, not taken from a single paper: the 0.5–2 limits on the spread ratio, mean-only
correction where the model spread is below 1 mm, clipping at 0 mm (its weakness in dry months, issue I-08), equal
weighting of years, the count smoothing and one blend weight shared by all cells. A square-root-space amount correction
passed the gate for amounts and is recommended for the next cycle (docs/36). Details: docs/46. DOIs checked on Crossref,
11 October 2026.
Funk, C., et al. (2015). The climate hazards infrared precipitation with stations — a new environmental record for monitoring extremes. Scientific Data, 2, 150066. doi:10.1038/sdata.2015.66
Funk, C., et al. (2026). The Climate Hazards Center Infrared Precipitation with Stations, Version 3. Scientific Data, 13, 718. doi:10.1038/s41597-026-07096-4
Johnson, S. J., et al. (2019). SEAS5: the new ECMWF seasonal forecast system. Geoscientific Model Development, 12, 1087–1117. doi:10.5194/gmd-12-1087-2019
Manzanas, R., et al. (2019). Bias adjustment and ensemble recalibration methods for seasonal forecasting: a comprehensive intercomparison using the C3S dataset. Climate Dynamics, 53, 1287–1305. doi:10.1007/s00382-019-04640-4
Rajagopalan, B., Lall, U., & Zebiak, S. E. (2002). Categorical climate forecasts through regularization and optimal combination of multiple GCM ensembles. Monthly Weather Review, 130(7), 1792–1811. doi:10.1175/1520-0493(2002)130<1792:CCFTRA>2.0.CO;2
Robertson, A. W., Lall, U., Zebiak, S. E., & Goddard, L. (2004). Improved combination of multiple atmospheric GCM ensembles for seasonal prediction. Monthly Weather Review, 132(12), 2732–2744. doi:10.1175/MWR2818.1
Teutschbein, C., & Seibert, J. (2012). Bias correction of regional climate model simulations for hydrological climate-change impact studies: review and evaluation of different methods. Journal of Hydrology, 456–457, 12–29. doi:10.1016/j.jhydrol.2012.05.052
Torralba, V., et al. (2017). Seasonal climate prediction: a new source of information for the management of wind energy resources. Journal of Applied Meteorology and Climatology, 56(5), 1231–1247. doi:10.1175/JAMC-D-16-0204.1
Wilks, D. S. (2019). Statistical Methods in the Atmospheric Sciences (4th ed.). Elsevier.
How the method was chosen
A change is adopted only if it improves the cross-validated 1993–2016 scores (Holm-adjusted p < 0.05 over the five JJAS targets) and does not worsen 2017–2025. Also evaluated and not adopted: regularized Dirichlet recalibration and per-cell or regime-specific blend weights.
Square-root amount correction (amounts, CRPS in mm)
−0.13 to −0.06
lower in all targets
Passes for all targets; candidate for the next cycle
Ensemble size and spread
Ensemble-size check, May-initialized JJAS targets, 2017–2025 (lower RPS is better)
Target
RPS, 51 members
RPS, 25-member subsets (mean)
Spread / error (hindcast → 2017–2025)
JJAS
0.4404
0.4420
0.68 → 0.75
Jun
0.4598
0.4601
0.62 → 0.63
Jul
0.4449
0.4467
0.71 → 0.76
Aug
0.4405
0.4415
0.74 → 0.73
Sep
0.4578
0.4587
0.75 → 0.76
Calibration parameters are fitted mostly on 25-member hindcasts and applied to 51-member forecasts. In 2017–2025 the 51-member forecasts scored about the same as, or slightly better than, 25-member subsets, so the transfer did not degrade scores in the years tested; this does not show it is neutral in every year or region. The corrected ensemble is under-dispersive (spread smaller than error), which the climatology blend partly offsets. Monthly and seasonal outlooks are calibrated separately: for JJAS 2026 over all Ethiopia the corrected monthly means sum to 432 mm against 430 mm for the season (+1.7 mm).
Quality control
Every forecast file is inventoried; re-downloaded years were bit-identical, confirming SEAS5 system 51.
Small negative daily increments (≤ 0.15 mm) are GRIB packing rounding; tolerated up to 0.2 mm and clipped, and the seasonal sum is checked.
CHIRPS sea cells (223) are always missing; no partial season enters any fit.
Verification observations are compared with the archive in the overlap year (tolerance 0.0001 mm/day) before use.
Limitations
Few evaluation years and single verification seasons give wide uncertainty; regional and monthly results are noisy.
The later evaluation years were inspected during method development; the cleanest evidence is the cross-validated 1993–2016 score.
The 0.25° maps repeat 1° model information; they add no dynamical detail.
Cycles before 2027 are research reconstructions produced after their initialization dates; from 2027 each forecast is issued and frozen before its season (docs/52). None is an official EMI or ICPAC forecast.
Raw ECMWF and CHIRPS data are not stored in the repository. Step-by-step guides: docs/40; project status: docs/36.
Downloads
Complete package
One ZIP file with every map (forecast and verification), the verification reports, the official-outlook comparison files and the forecast NetCDF files for the selected cycle. The PDF bulletin, summary CSV, metadata and README are listed below.