FMAM rainfall domain review fmam_chirps_domain_review_v1
CHIRPS v3.0 (0.05 deg monthly, 0.25 deg block mean) 1993–2025 · built 2026-10-10T23:38:08+00:00 · fingerprint 23f609561e41
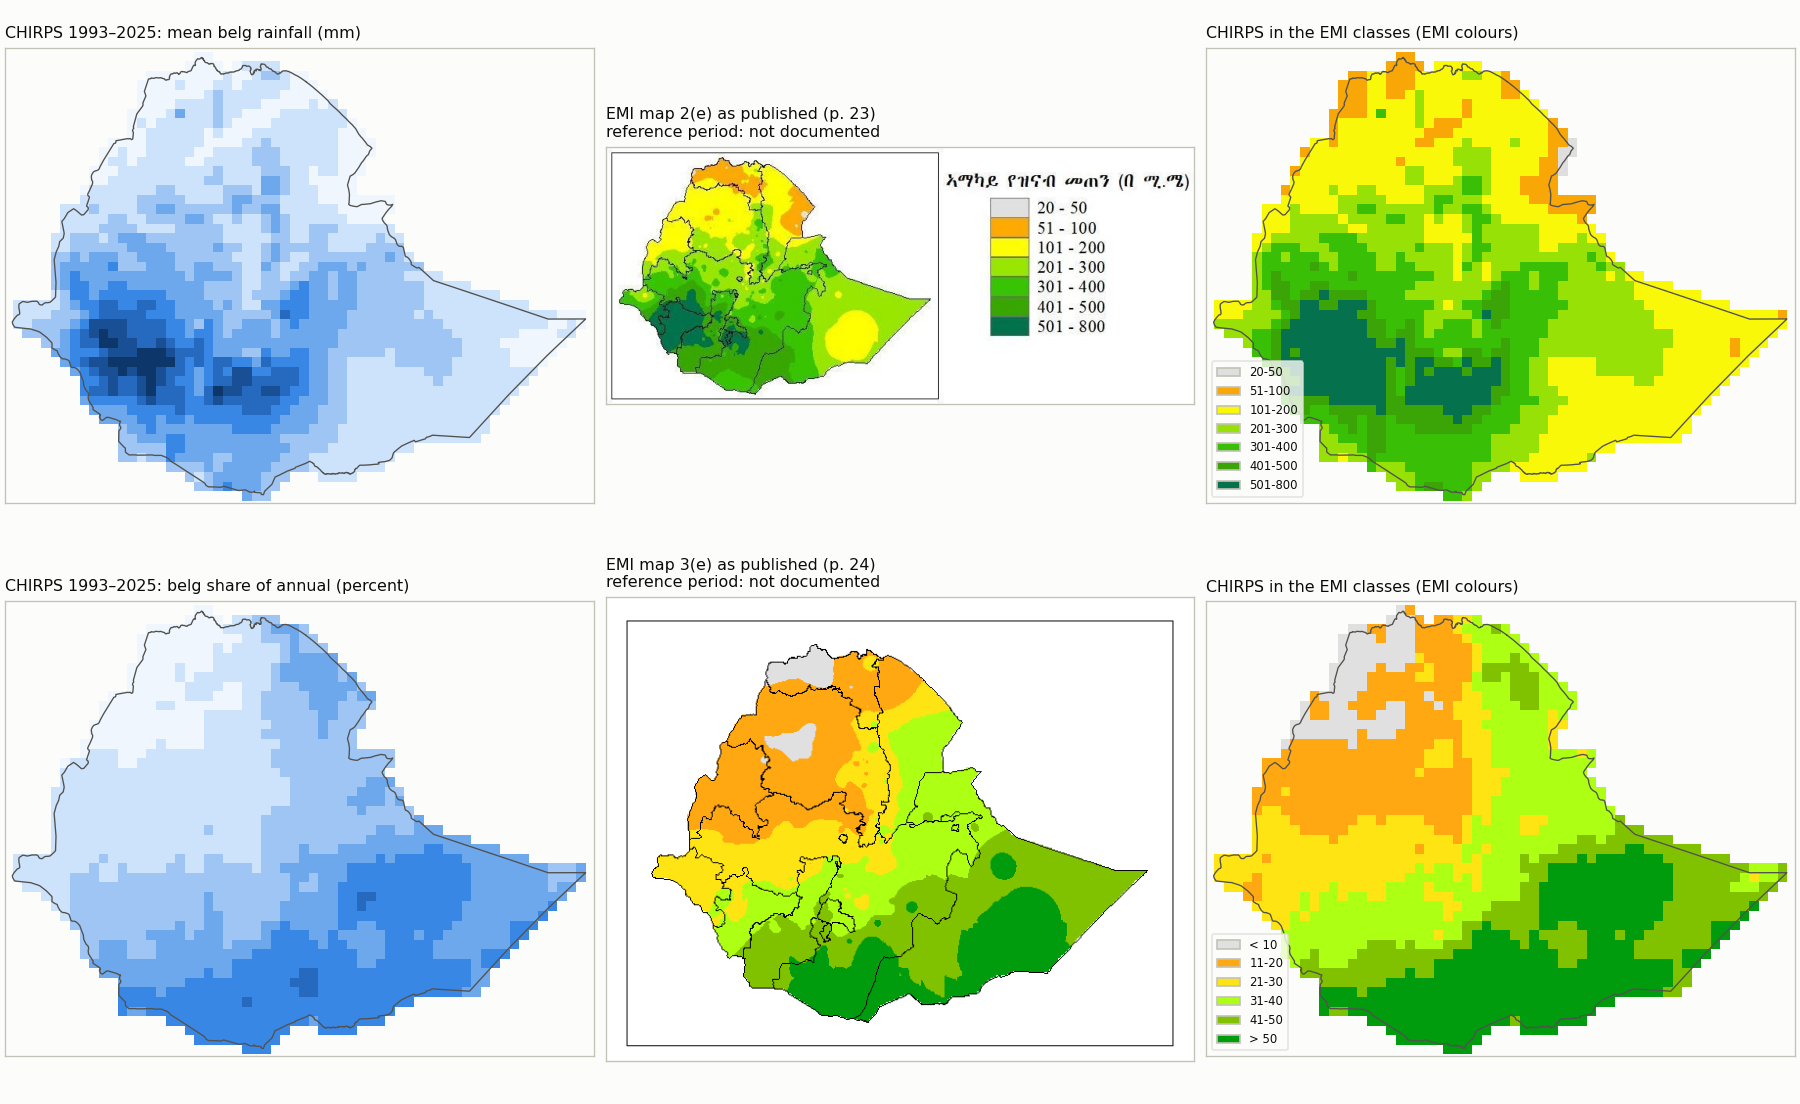
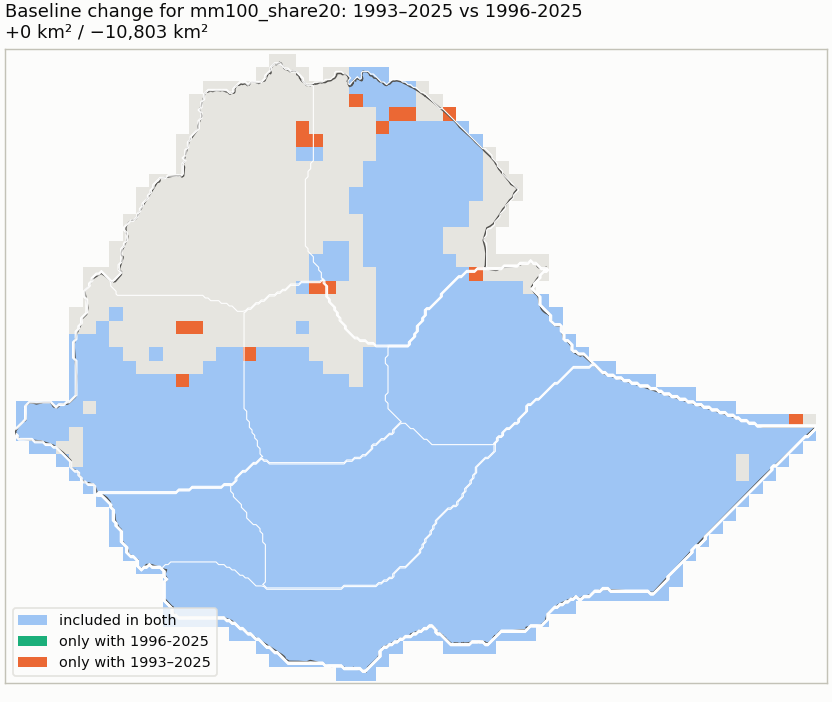
Selected candidate: mm100_share20 — Adopted 2026-10-10 as the broad FMAM working domain for Ethiopia: cells where FMAM contributes both a substantial amount (>= 100 mm) and a substantial share (>= 20%) of annual rainfall, i.e. a broad rainfall-contribution domain. The two cutoffs also coincide with EMI legend class breaks (101-200 mm; 21-30 %), which makes a visual comparison with EMI maps 2(e)/3(e) convenient; that comparison is visual and unreviewed and does not independently validate the thresholds. Stable against the 1996-2025 baseline. The included share of Ethiopia describes this rule, not an official estimate of Belg-dependent area.
1. Climatology
Ratio of climatological means from actual-calendar monthly totals (February 29 included); every year of the period required per cell.
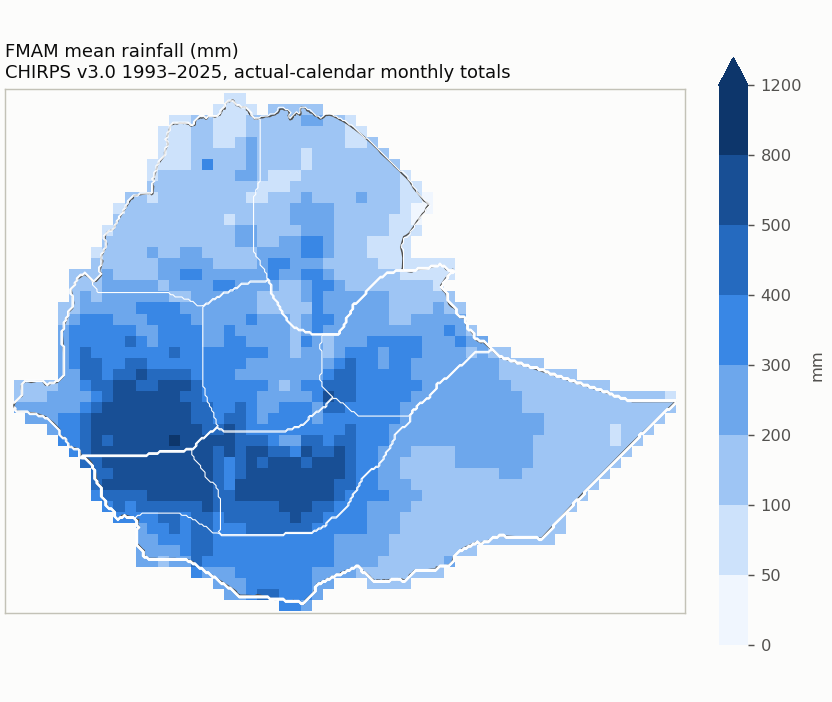
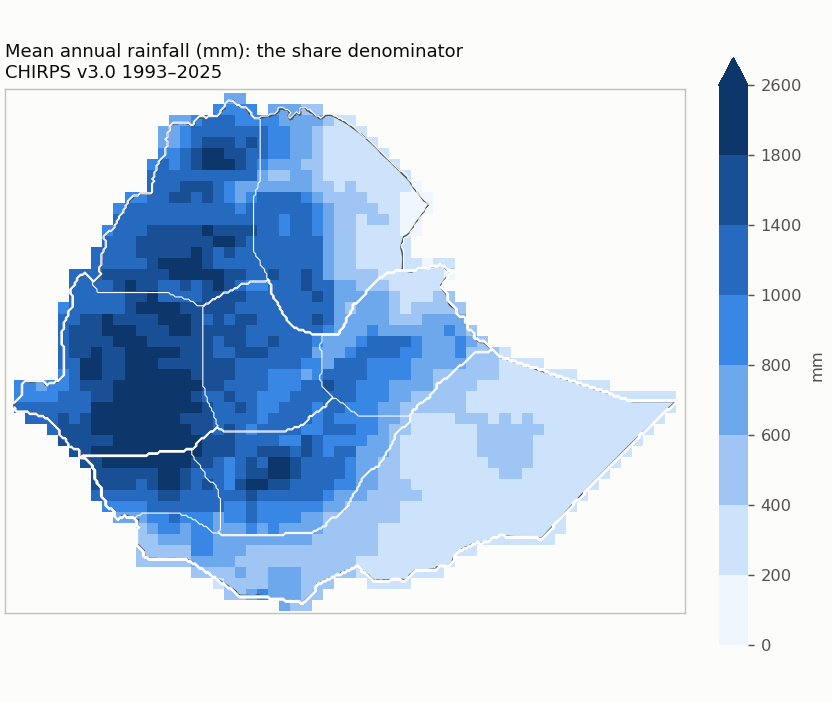
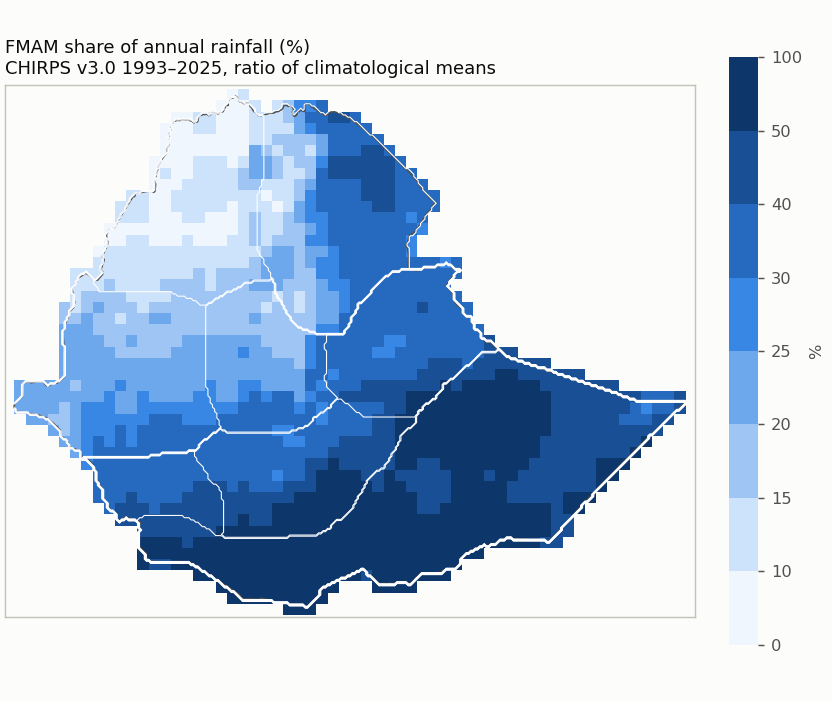
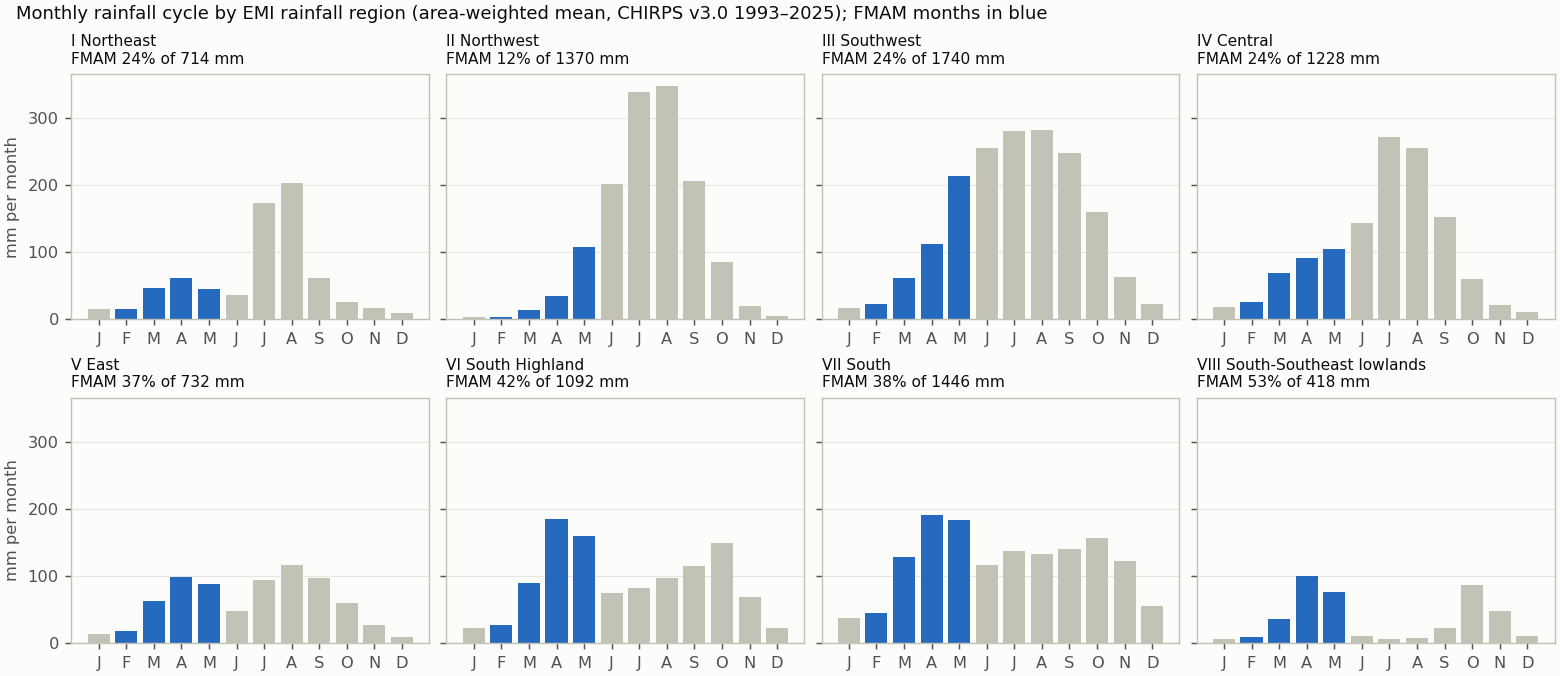
Reference periods
| Period | Status | Note |
|---|---|---|
| 1993-2025 | available | |
| 1981-2010 | unavailable | 12 of 30 years are not in the data (1981-1992); the period is not shortened. |
| 1991-2020 | unavailable | 2 of 30 years are not in the data (1991-1992); the period is not shortened. |
| 1996-2025 | available |
Quality control
| Check | Result | Detail |
|---|---|---|
| Calendar | passed | Not applicable: the cache holds the published monthly totals (calendar months, February 29 included as published); there is no daily cycle. |
| Units | mm | mm (monthly accumulation of daily mm amounts; no rate conversion) |
| Years | 1993–2025 (33) | gaps: none |
| Completeness | 0 cells | Cells touching Ethiopia whose CHIRPS record is not complete for every year and month. |
| Area | 1,129,938 km² | 3.6 km² beyond the grid; cell bounds intersected with the Ethiopia polygon, WGS84 geodesic areas |
| Source | CHIRPS v3.0 (0.05 deg monthly, 0.25 deg block mean) | sha256 17a229d0813d23f4… |
| Nested candidates | yes | raising either cutoff never adds a cell |
2. References
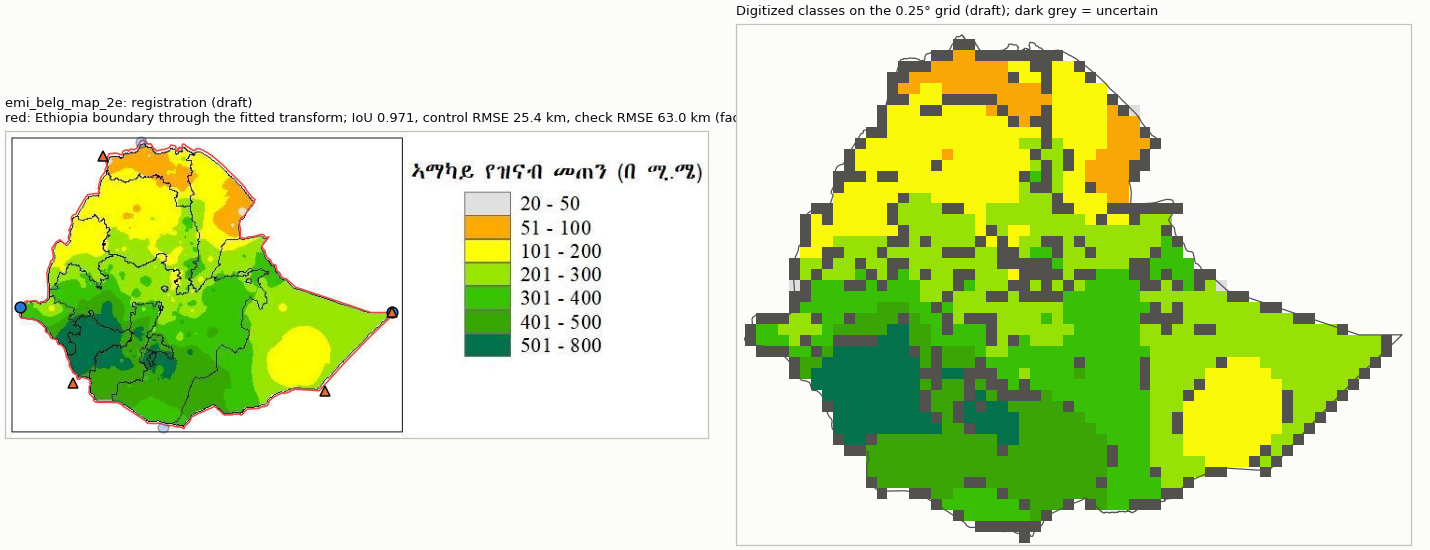
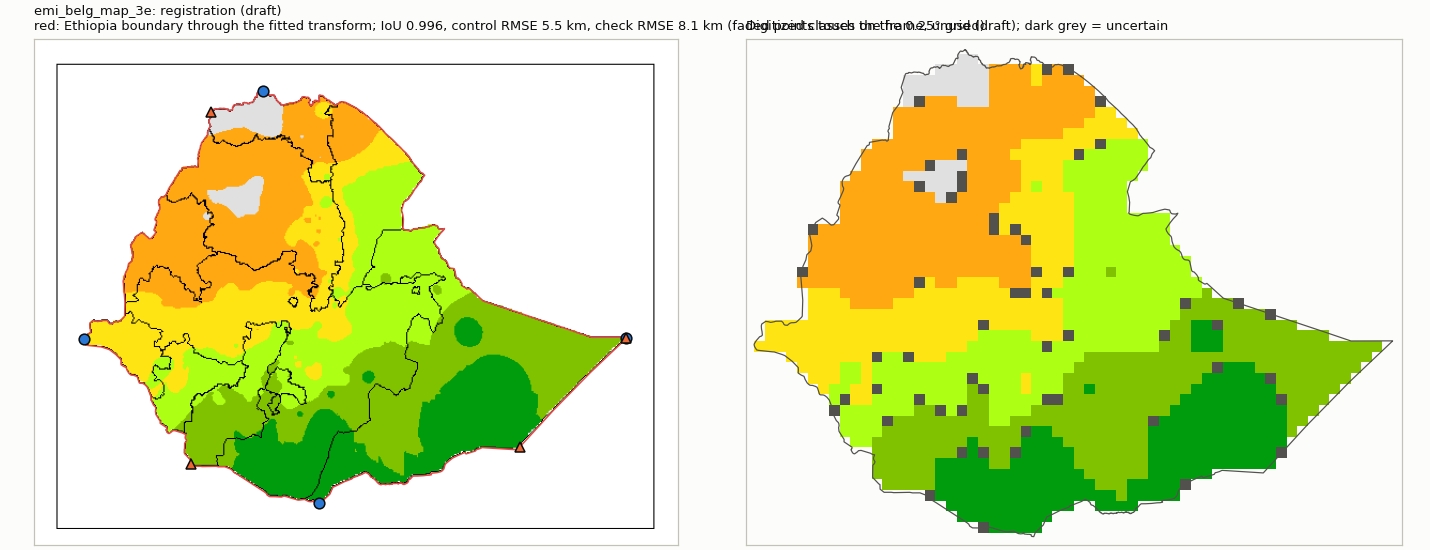
Registered EMI climatology panels (climatologies printed in a 2026 publication; their averaging period is not documented). The comparison mode follows the evidence: drafts stay visual only.
| Reference | Mode | Why not higher | Digitization | Outline IoU | Control / check RMSE (km) | Document |
|---|---|---|---|---|---|---|
| emi_belg_map_2e | visual_only | georeferencing and legend classes not reviewed | draft | 0.971 | 25.4 / 63.0 | 2fbeb7261fec |
| emi_belg_map_3e | visual_only | georeferencing and legend classes not reviewed | draft | 0.996 | 5.5 / 8.1 | 2fbeb7261fec |
3. Candidate domains
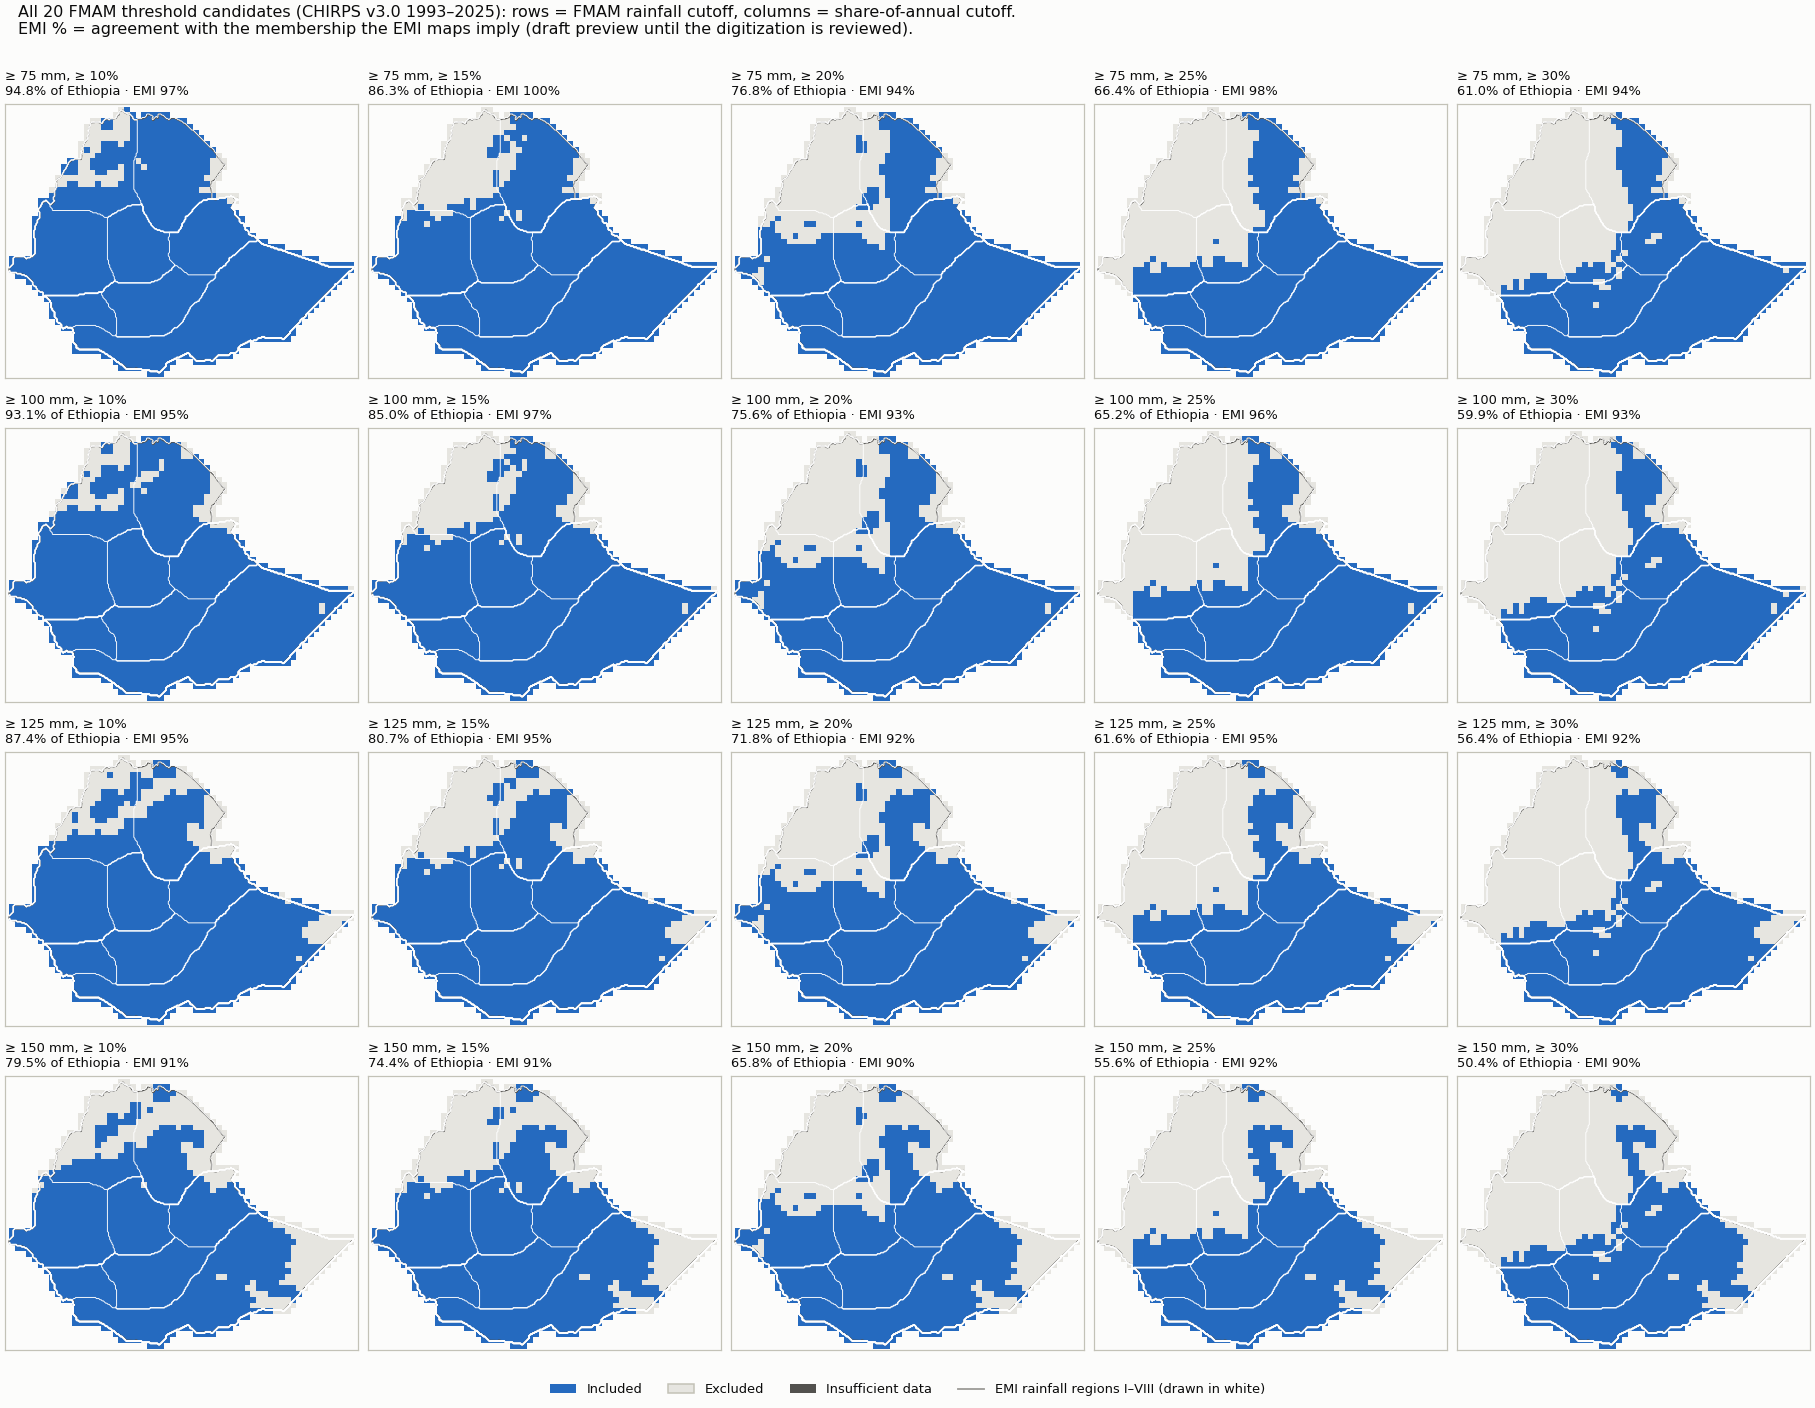
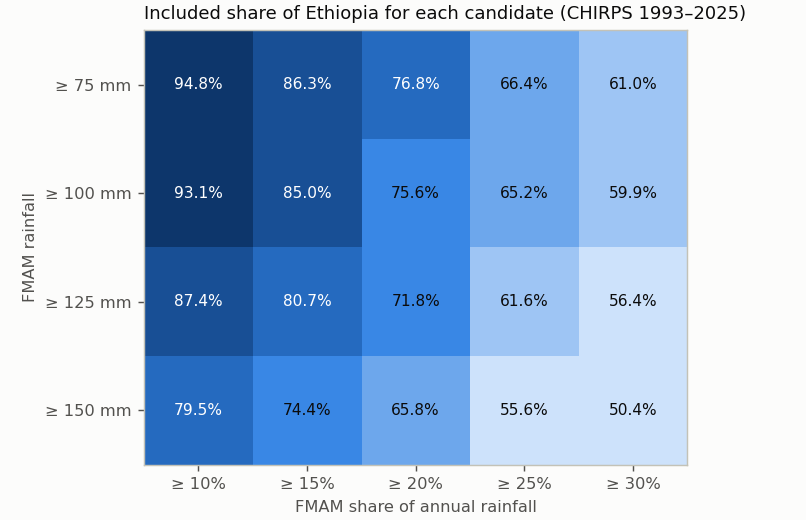
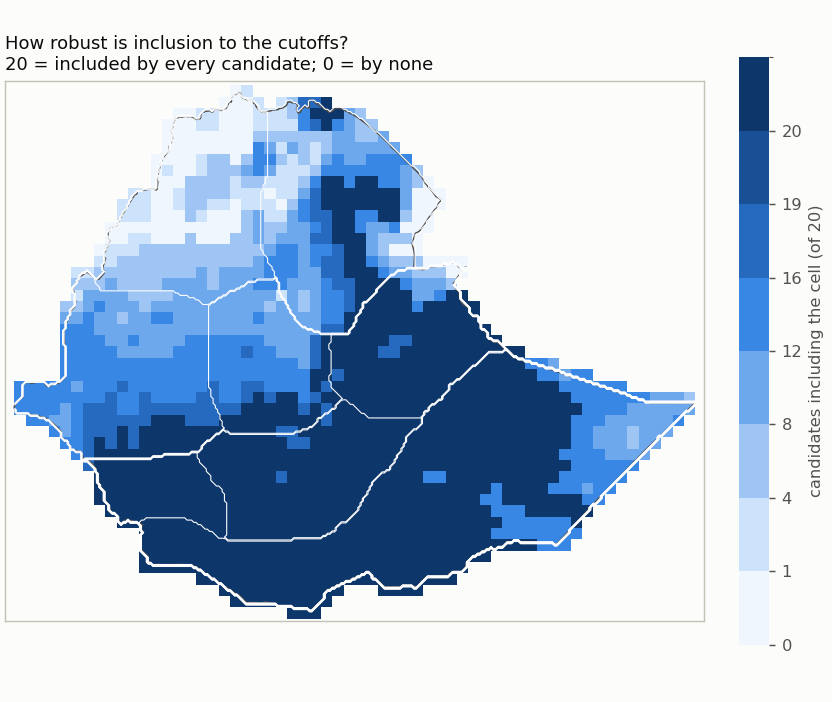
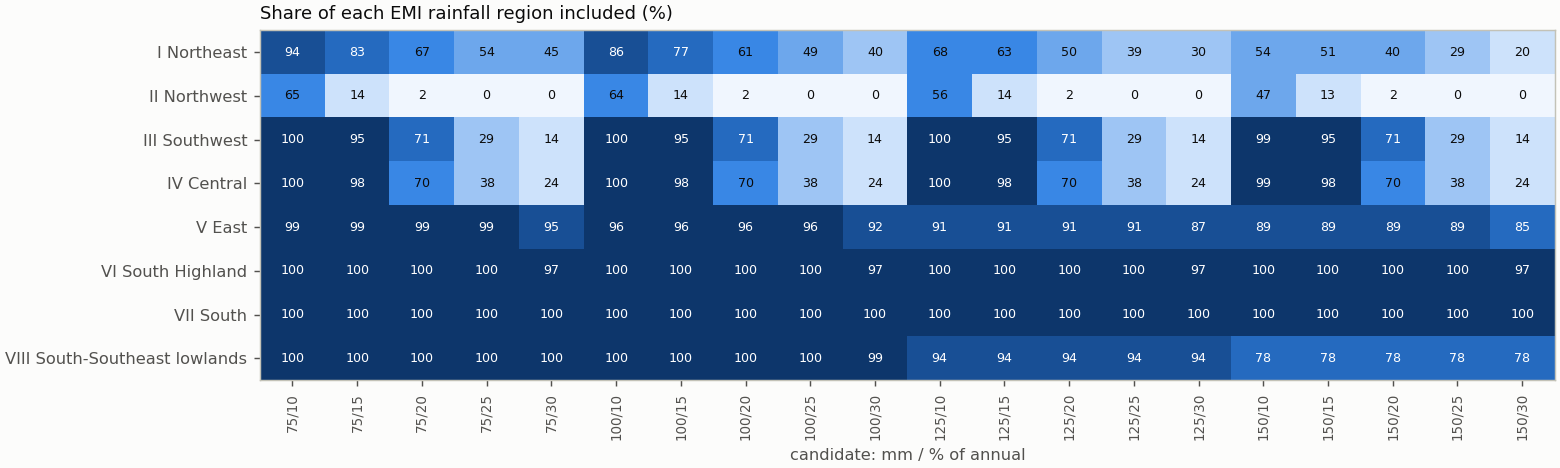
| Candidate | mm | % of annual | Included km² | % of Ethiopia | Unknown km² | Agreement with EMI-implied membership | Baseline change | Files |
|---|---|---|---|---|---|---|---|---|
| mm75_share10 | ≥ 75 | ≥ 10 | 1,071,699 | 94.8 | 4 | 97% (visual_only (draft preview)) | 1981-2010: unavailable; 1991-2020: unavailable; 1996-2025: +755/−4,503 km² | NetCDF · GeoJSON |
| mm75_share15 | ≥ 75 | ≥ 15 | 975,155 | 86.3 | 4 | 100% (visual_only (draft preview)) | 1981-2010: unavailable; 1991-2020: unavailable; 1996-2025: +755/−9,019 km² | NetCDF · GeoJSON |
| mm75_share20 | ≥ 75 | ≥ 20 | 867,407 | 76.8 | 4 | 94% (visual_only (draft preview)) | 1981-2010: unavailable; 1991-2020: unavailable; 1996-2025: +755/−8,290 km² | NetCDF · GeoJSON |
| mm75_share25 | ≥ 75 | ≥ 25 | 750,337 | 66.4 | 4 | 98% (visual_only (draft preview)) | 1981-2010: unavailable; 1991-2020: unavailable; 1996-2025: +755/−2,277 km² | NetCDF · GeoJSON |
| mm75_share30 | ≥ 75 | ≥ 30 | 689,780 | 61.0 | 4 | 94% (visual_only (draft preview)) | 1981-2010: unavailable; 1991-2020: unavailable; 1996-2025: +1,518/−13,644 km² | NetCDF · GeoJSON |
| mm100_share10 | ≥ 100 | ≥ 10 | 1,051,715 | 93.1 | 4 | 95% (visual_only (draft preview)) | 1981-2010: unavailable; 1991-2020: unavailable; 1996-2025: +0/−7,512 km² | NetCDF · GeoJSON |
| mm100_share15 | ≥ 100 | ≥ 15 | 960,567 | 85.0 | 4 | 97% (visual_only (draft preview)) | 1981-2010: unavailable; 1991-2020: unavailable; 1996-2025: +0/−10,782 km² | NetCDF · GeoJSON |
| mm100_share20 | ≥ 100 | ≥ 20 | 854,318 | 75.6 | 4 | 93% (visual_only (draft preview)) | 1981-2010: unavailable; 1991-2020: unavailable; 1996-2025: +0/−10,803 km² | NetCDF · GeoJSON |
| mm100_share25 | ≥ 100 | ≥ 25 | 737,247 | 65.2 | 4 | 96% (visual_only (draft preview)) | 1981-2010: unavailable; 1991-2020: unavailable; 1996-2025: +0/−4,790 km² | NetCDF · GeoJSON |
| mm100_share30 | ≥ 100 | ≥ 30 | 676,690 | 59.9 | 4 | 93% (visual_only (draft preview)) | 1981-2010: unavailable; 1991-2020: unavailable; 1996-2025: +763/−16,156 km² | NetCDF · GeoJSON |
| mm125_share10 | ≥ 125 | ≥ 10 | 987,090 | 87.4 | 4 | 95% (visual_only (draft preview)) | 1981-2010: unavailable; 1991-2020: unavailable; 1996-2025: +413/−7,516 km² | NetCDF · GeoJSON |
| mm125_share15 | ≥ 125 | ≥ 15 | 911,880 | 80.7 | 4 | 95% (visual_only (draft preview)) | 1981-2010: unavailable; 1991-2020: unavailable; 1996-2025: +413/−10,564 km² | NetCDF · GeoJSON |
| mm125_share20 | ≥ 125 | ≥ 20 | 811,916 | 71.8 | 4 | 92% (visual_only (draft preview)) | 1981-2010: unavailable; 1991-2020: unavailable; 1996-2025: +413/−11,302 km² | NetCDF · GeoJSON |
| mm125_share25 | ≥ 125 | ≥ 25 | 696,341 | 61.6 | 4 | 95% (visual_only (draft preview)) | 1981-2010: unavailable; 1991-2020: unavailable; 1996-2025: +413/−6,037 km² | NetCDF · GeoJSON |
| mm125_share30 | ≥ 125 | ≥ 30 | 637,296 | 56.4 | 4 | 92% (visual_only (draft preview)) | 1981-2010: unavailable; 1991-2020: unavailable; 1996-2025: +1,176/−17,404 km² | NetCDF · GeoJSON |
| mm150_share10 | ≥ 150 | ≥ 10 | 898,709 | 79.5 | 4 | 91% (visual_only (draft preview)) | 1981-2010: unavailable; 1991-2020: unavailable; 1996-2025: +1,281/−7,721 km² | NetCDF · GeoJSON |
| mm150_share15 | ≥ 150 | ≥ 15 | 840,193 | 74.4 | 4 | 91% (visual_only (draft preview)) | 1981-2010: unavailable; 1991-2020: unavailable; 1996-2025: +1,281/−10,764 km² | NetCDF · GeoJSON |
| mm150_share20 | ≥ 150 | ≥ 20 | 743,235 | 65.8 | 4 | 90% (visual_only (draft preview)) | 1981-2010: unavailable; 1991-2020: unavailable; 1996-2025: +1,281/−10,764 km² | NetCDF · GeoJSON |
| mm150_share25 | ≥ 150 | ≥ 25 | 628,410 | 55.6 | 4 | 92% (visual_only (draft preview)) | 1981-2010: unavailable; 1991-2020: unavailable; 1996-2025: +1,281/−4,828 km² | NetCDF · GeoJSON |
| mm150_share30 | ≥ 150 | ≥ 30 | 569,364 | 50.4 | 4 | 90% (visual_only (draft preview)) | 1981-2010: unavailable; 1991-2020: unavailable; 1996-2025: +2,044/−15,090 km² | NetCDF · GeoJSON |
Named comparisons
| Rule | Included km² | % of Ethiopia | Agreement with EMI-implied membership | Files |
|---|---|---|---|---|
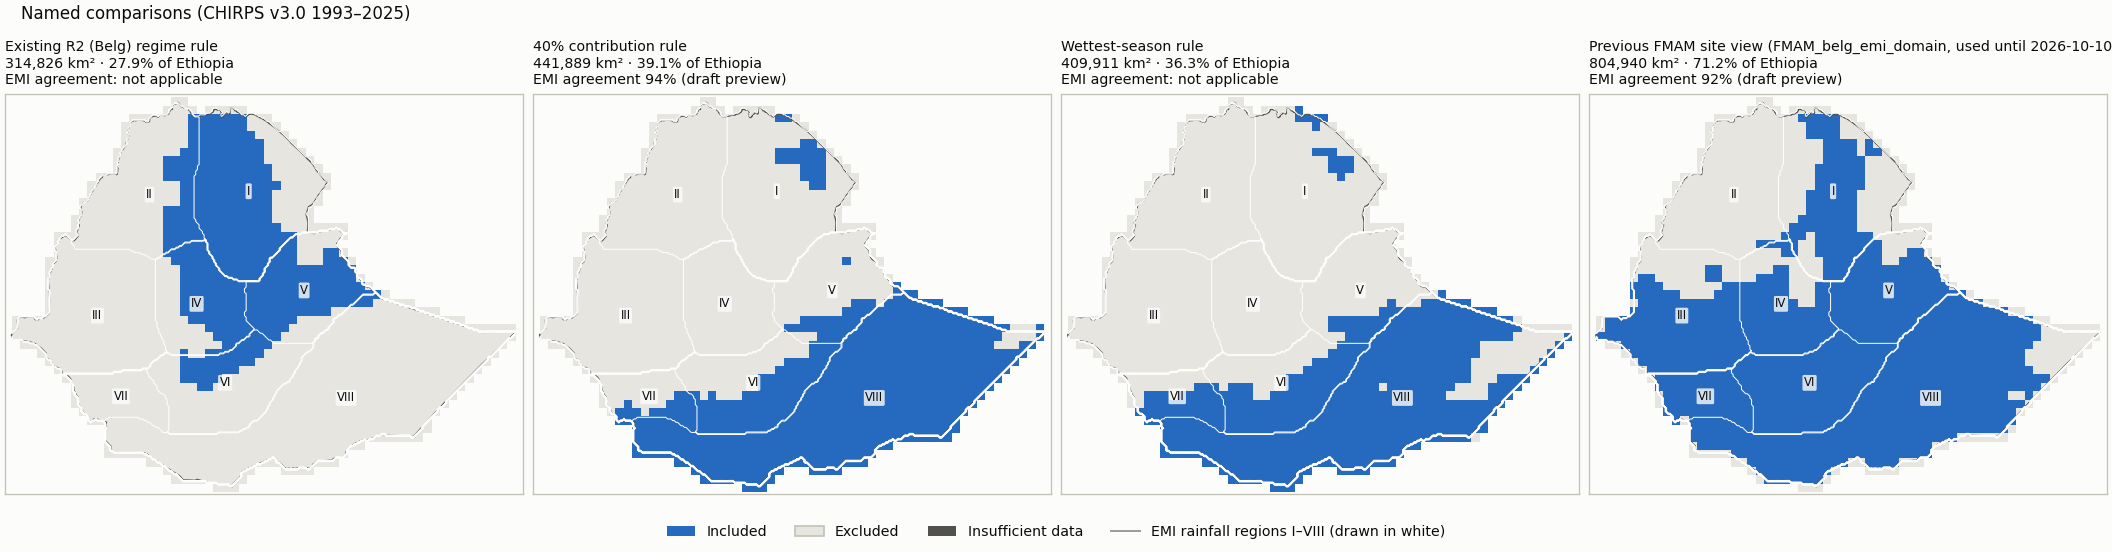
| Existing R2 (Belg) regime rule: R2 membership, FMAM >= 80 mm, patches < 3 cells removed | 314,826 | 27.9 | Regime membership is not an amount/share threshold, so EMI classes imply no membership for it. | NetCDF · GeoJSON |
| 40% contribution rule: FMAM >= 40% of annual and >= 80 mm (no cleanup) | 441,889 | 39.1 | 94% (visual_only (draft preview)) | NetCDF · GeoJSON |
| Wettest-season rule: FMAM wetter than JJAS and ONDJ, >= 80 mm (no cleanup) | 409,911 | 36.3 | Wettest-season membership compares FMAM with JJAS and ONDJ; the EMI maps give no JJAS/ONDJ amounts. | NetCDF · GeoJSON |
| Previous FMAM site view (FMAM_belg_emi_domain, used until 2026-10-10): >= 20% and >= 100 mm from the 365-day cycle, patches < 3 cells removed | 804,940 | 71.2 | 92% (visual_only (draft preview)) | NetCDF · GeoJSON |
Domain files: one NetCDF (membership codes: 1 included, 0 excluded, -1 insufficient data, -2 outside Ethiopia) and one GeoJSON outline (cells clipped to the border) per domain, in domains/. They are review candidates, not operational masks.
4. Assessment
Reference agreement
| Reference | Mode | Exact class | Within one class | CHIRPS wetter / drier | Outside-interval median / p90 | Comparable / uncertain area |
|---|---|---|---|---|---|---|
| emi_belg_map_2e | visual_only (draft preview) | 56% | 94% | 19% / 26% | 0.0 / 82.0 mm | 918,469 / 201,785 km² |
| emi_belg_map_3e | visual_only (draft preview) | 71% | 97% | 18% / 11% | 0.0 / 4.8 pp | 1,069,585 / 40,026 km² |
Agreement with EMI-implied membership counts only area where the EMI class lies entirely on one side of a cutoff (half a legend unit tolerance); straddling classes are undecided, never guessed.
Largest changes between neighbouring cutoffs
| From | To | Changed cutoff | Area switching |
|---|---|---|---|
| mm75_share20 | mm75_share25 | annual share percent | 117,070 km² |
| mm100_share20 | mm100_share25 | annual share percent | 117,070 km² |
| mm125_share20 | mm125_share25 | annual share percent | 115,575 km² |
| mm150_share20 | mm150_share25 | annual share percent | 114,825 km² |
| mm75_share15 | mm75_share20 | annual share percent | 107,748 km² |
| mm100_share15 | mm100_share20 | annual share percent | 106,249 km² |
| mm125_share15 | mm125_share20 | annual share percent | 99,963 km² |
| mm150_share15 | mm150_share20 | annual share percent | 96,958 km² |
| mm75_share10 | mm75_share15 | annual share percent | 96,543 km² |
| mm100_share10 | mm100_share15 | annual share percent | 91,148 km² |
Dataset sensitivity: not assessed (CHIRPS only). Forecast skill is reported for a selected domain but never used to move its boundary.
Inputs
{
 "review_config": "05dea88584aba955f940e0e5bf85956b3c2ea07c905b6eb82f60858a75f89625",
 "monthly_cache": "6f204093638aa6664abd5d4b12ad48d448c5af5edea71ce87b4592c60c037b17",
 "country_boundary": "96be2b2fc519922d12f4bb5165bad2ad518c2a3f9c8237a4481260d612b12b9f",
 "country_mask": "57ad8861c598abb9f175012920e5d0ef058e5b643cd6e4987cad3da6ac0b9e16",
 "reference_registry": "66d3098a0748af413afbd475edcbf173c2658cb808633380427bb9063bc38fb8",
 "regions_mask": "a6770d527fe05d756d2b158a8765a5b45e6694bc2e1944f4046a2a0d5d354658",
 "comparator:r2_regime_rule": "70b458cab7fe08be352b0c0744b0aa64f6f80eafae0f5cf2a52cc15ad2399088",
 "comparator:belg_emi_view": "a10f6ba0d583b29c8802a4431922d1bdd2bc0142d1f08f022d9b92aef44116fd",
 "extraction:emi_belg_map_2e": "b58529f7415d840a6d0d50af8d198fbbea505097964dcaa2b30abc7223701d76",
 "extraction:emi_belg_map_3e": "aa9ba9c59e588785c1cd51a3d8fbf64d0847319314dea2ef25439a28293f2d7d",
 "chirps_source_sha256": "17a229d0813d23f4c3a828717b1ca768d36afe0748f388fa5fd9d5a85e95ba50",
 "reference_documents": {
  "emi_belg_map_2e": [
   "2fbeb7261fec5d6bf3db030cf01694b9f69aa81740b3f637181af729e69a34d2",
   "5421fd8123b7cae56d1c2125cadad191db3497bce07d3362cb996316cb2d16c9"
  ],
  "emi_belg_map_3e": [
   "2fbeb7261fec5d6bf3db030cf01694b9f69aa81740b3f637181af729e69a34d2",
   "4483182ee56a64cde90339785b8c7201e17adc1bfdb49558d5b3d3efe5d7acb6"
  ]
 },
 "season_months": [
  2,
  3,
  4,
  5
 ],
 "application_period": [
  1993,
  2025
 ],
 "thresholds": {
  "seasonal_rainfall_mm": [
   75,
   100,
   125,
   150
  ],
  "annual_share_percent": [
   10,
   15,
   20,
   25,
   30
  ]
 },
 "method_version": "rainfall_domain_review_v1"
}